Strong Chromatic Microlensing in HE0047-1756 and SDSS1155+6346
Abstract
We use spectra of the double lensed quasars HE0047-1756 and SDSS1155+6346 to study their unresolved structure through the impact of microlensing. There is no significant evidence of microlensing in the emission line profiles except for the Ly line of SDSS1155+6346, which shows strong differences in the shapes for images A and B. However, the continuum of the B image spectrum in SDSS1155+6346 is strongly contaminated by the lens galaxy and these differences should be considered with caution. Using the flux ratios of the emission lines for image pairs as a baseline to remove macro-magnification and extinction, we have detected strong chromatic microlensing in the continuum measured by CASTLES111www.cfa.harvard.edu/castles/, in both lens systems, with amplitudes for HE0047-1756, and for SDSS1155+6346. Using magnification maps to simulate microlensing, and modeling the accretion disk as a Gaussian source (I exp(-R2/2r)) of size rs we find, rs = 2.5 light days and p = 2.3 0.8, at the rest frame for = 2045, for HE0047-1756 (log prior), and rs = 5.5 light days and p = 1.5 0.6 at the rest frame of = 1398, for SDSS1155+6346 (log prior). Contrary to other studied lens systems, the chromaticity detected in HE0047-1756 and SDSS1155+6346 is large enough to fulfill the thin disk prediction. The inferred sizes, however, are very large compared to the predictions of this model, especially in the case of SDSS1155+6346.
1 Introduction
Gravitational lens systems are a powerful tool to study lens galaxies (Kochanek et al., 2001; Oguri et al., 2002; Davis et al., 2003; Moustakas & Metcal, 2003; Mandelbaum et al., 2009), to resolve lensed quasar structure (Pooley et al., 2007; Mosquera et al., 2009; Blackburne et al., 2011; Mosquera & Kochanek, 2011; Muñoz et al., 2011; Mediavilla et al., 2011; Guerras et al., 2013a), and to estimate cosmological constraints (Schneider et al., 1992; Koopmans & Fassnacht, 1999; Oguri, 2007; Jullo et al., 2010; Balmés & Corasaniti, 2013). Since the discovery of lensed quasars, anomalies in the flux ratios between images compared to the predictions of otherwise reliable models were found. These anomalies were thought to be associated with different phenomena: a complex mass distribution in the lens galaxy, dust extinction, dark matter substructure, and microlensing (Kochanek, 1991; Congdon et al., 2005; Yonehara et al., 2008). One of the most likely explanations, quasar microlensing, is produced by compact objects in the lens galaxy (Chang & Refsdal, 1979; Wambsganss, 2006). Two observational methods either based on the use of light curves or spectra have been used to study this effect. The first one uses the variability rate observed in the light curves to determine the time delay and measure the microlensing magnification (Rauch & Blandford, 1991; Yonehara et al., 1998; Poindexter & Kochanek, 2010). The disadvantage of this method is the need for monitoring over periods of years (for most systems microlensing variability is expected over scales greater than 10 years (Kochanek, 2004)). The second method uses the magnitude difference between continuum and emission lines in a single-epoch spectrum to measure microlensing (Mediavilla et al., 2011; Motta et al., 2012). The disadvantage of this method is the lack of a time-delay correction ( 30 days for an image separation of 1 arcsec (Yonehara et al., 2008)) to untangle microlensing from intrinsic variability.
Microlensing is size sensitive. Regions of the source with a size comparable to the Einstein radius of the microlenses or smaller are significantly magnified (Wambsganss, 1998, 2006; Schmidt & Wambsganss, 2010). Then, because the sizes of the emitting regions vary with wavelength, chromatic microlensing is expected (Wambsganss & Pacszyński, 1991; Witsotzki et al., 1995; Mosquera et al., 2009; Mediavilla et al., 2011). The effect is stronger for shorter wavelengths (e.g X-rays, Pooley et al., 2007), and can be neglected in the IR (e.g Poindexter et al., 2007).
Intrinsic quasar variability together with time delay could mimic chromatic microlensing (Yonehara et al., 2008; Motta et al., 2012). We estimate this effect for both systems, following Yonehara et al. (2008) recipe. We assume an intrinsic magnitude of MI = -21 for the quasar and we estimated the time delay modeling a SIS using lensmodel (Keeton, 2001). For HE0047-1756, with a time delay of 32.9 days, the expected intrinsic variability is 0.08 mag, and the chromaticity change is 0.03 mag. For SDSS1155+6346, with a time delay of 11.2 days, the expected intrinsic variability is 0.06 mag, and the chromaticity change is 0.02 mag. The chromaticity observed for both systems is at least one order of magnitude larger than expected from intrinsic variability.
The BLR has a size of 60 light-days (Bentz et al., 2009; Zu et al., 2011; Guerras et al., 2013a) which is much larger than the size of 4 light-days of the accretion disk (Jiménez-Vicente et al. (2012, 2014) and reference therein). It is therefore clear that the broad emission lines are expected to be much less affected by microlensing than the continuum. However there are examples of such variation due to microlensing. For instance, microlensing could affect the broad wings of the high ionization broad emission line profiles (Guerras et al., 2013a, b) but it is expected to affect very weakly the cores of the lines and the low ionization lines (Popović et al., 2001; Abajas et al., 2002; Richards et al, 2004; Lewis & Ibata, 2004; Gómez-Álvarez et al., 2006; Guerras et al., 2013a). Thus, following the steps of Motta et al. (2012) (see also Mediavilla et al. (2011) and references therein) we use the images (A and B) of double lensed quasars to estimate the amplitude of microlensing in the continuum from the magnitude difference of the continuum adjacent to the emission lines, , taking as baseline the magnitude differences of the emission line cores, , to remove the effects of macro-magnification and extinction, . We apply this analysis to spectra of HE0047-1756 and SDSS1155+6346 with the aim of using the variation in the microlensing amplitude with wavelength to constrain the size and the temperature profile of each emitting region.
The structure of the paper is as follows. In section 2 we present the data. In section 3 we give details about the procedure to determine the continuum and line core emission and about the Bayesian analysis used to estimate the size of the accretion disk and the slope of the temperature profile. We discuss the results in section 4, and present the conclusions in section 5.
2 Observations and Data Reduction
We obtained spectra for two lens systems: we observed HE0047-1756 with the IMACS Long-Camera at the Magellan telescope in 2008 with a seeing of 0.61, and SDSS1155+6346 with the Blue Channel spectrograph at the MMT in 2010 with a seeing of 0.7. The wavelength range, spectral resolution and dispersion of the spectra used are 3650-9740 Å, 6.75 Å, and 0.743 (Å/pix), 3000-10000 Å, 6.47 Å, 1.96 (Å/pix), for Magellan and MMT respectively. The position angle of the slit was chosen to observe the two lensed quasar images at once. Table 1 shows the log of our observations.
The data reduction was performed with IRAF, and includes bias subtraction, flat normalization and wavelength calibration. As the separation between the components is small (1.43 for HE0047-1756 and 1.94 for SDSS1155+6346222astrometic data obtained from CASTLES) the spectra slightly overlap, and the flux extraction of each component was made fitting a Gaussian to each component through each column of the 2D spectra (columns correspond to wavelength). The separation between Gaussians was fixed using the images positions in CASTLES. We did not flux calibrate our data because we are interested only in the flux ratio between components. We used data from CASTLES in three different bands (F160W, F555W, F814W) acquired with HST in 2003, and additional data from the literature (Sluse et al., 2012; Pindor et al., 2004).
3 Method
As discussed in Section 1, the method we use to measure microlensing is based on the comparison between the continuum and the emission line flux ratios, . We used DIPSO in STARLINK to fit the continuum on either side of the emission lines with a line (flux = a + b). After subtracting the continuum we integrate the line emission in a 100Å interval centered on the emission line peak (core). We estimate, conservatively, the continuum uncertainties from the rms of the continuum fit. The uncertainties in the line fluxes are obtained summing in quadrature the rms errors for the determination of the total flux (conservatively assumed to be the same as the continuum fit rms error) and the uncertainty in the continuum determination.
The flux ratio between images obtained from the cores of the emission lines are used to calculate singular isothermal sphere plus shear models (SIS + ) of HE0047-1756 and SDSS1155+6346 with Lensmodel (Keeton, 2001). For each system, we used the separations between the two lensed images and the lens galaxy from CASTLES astrometry. From the model for each system we obtain the convergence and shear for each image (, , , ) that we use to compute microlensing magnification maps.
We follow a Bayesian procedure (see e.g. Mediavilla et al. 2011) to estimate the size of the accretion disk and its temperature profile from the microlensing data. We model the accretion disk as a Gaussian with intensity profile ), with () , where is the accretion disk size and is related to the temperature profile of the disk ( = 4/3, Shakura & Sunyaev (1973) thin disk model). To estimate the likelihood, , of reproducing the measured microlensing amplitudes, , we convolve the magnification maps for the A and B images obtained using Inverse Polygon Mapping method (Mediavilla et al., 2006, 2011). We use Gaussian sources of different sizes, , and profile slopes, , at the rest frame = 2045 (HE0047-1756), and = 1398 (SDSS1155+6346). The size of each map is Einstein Radii ( pixels2). We assume a mass fraction in stars of 10%, and we use microlenses. From the likelihoods, we obtained Bayesian posterior probabilities, , using either a linear or logarithmic prior on rs as in Mediavilla et al. (2011) and Motta et al. (2012), to analyze the sensitivity of our study.
4 Results
4.1 HE0047-1756
HE0047-1756 is a double system discovered by Witsotzki et al. (2004) with a separation between images, A and B, of 1.43 (CASTLES, ). The quasar and lens galaxy redshifts are zS = 1.66 and zL = 0.41, respectively (Ofek et al., 2006; Eingenbrod et al., 2006).
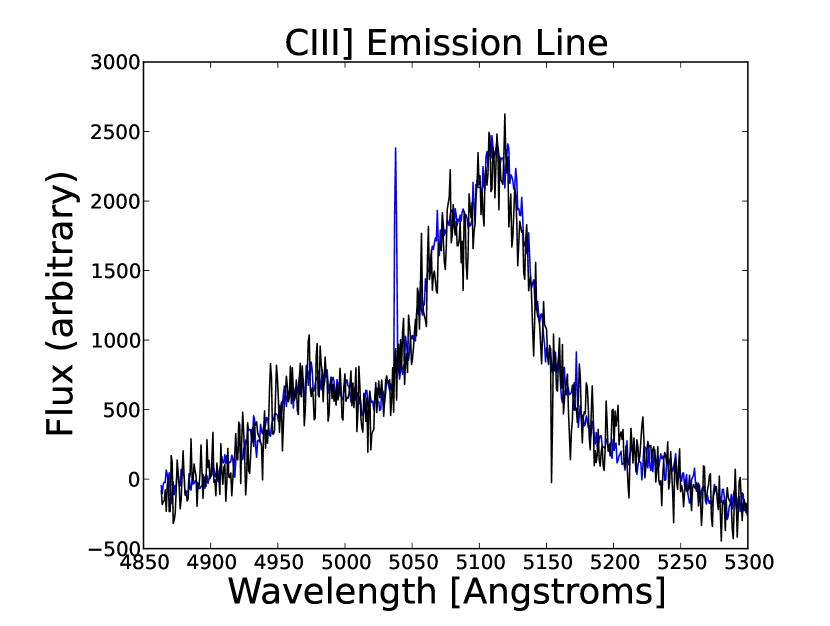
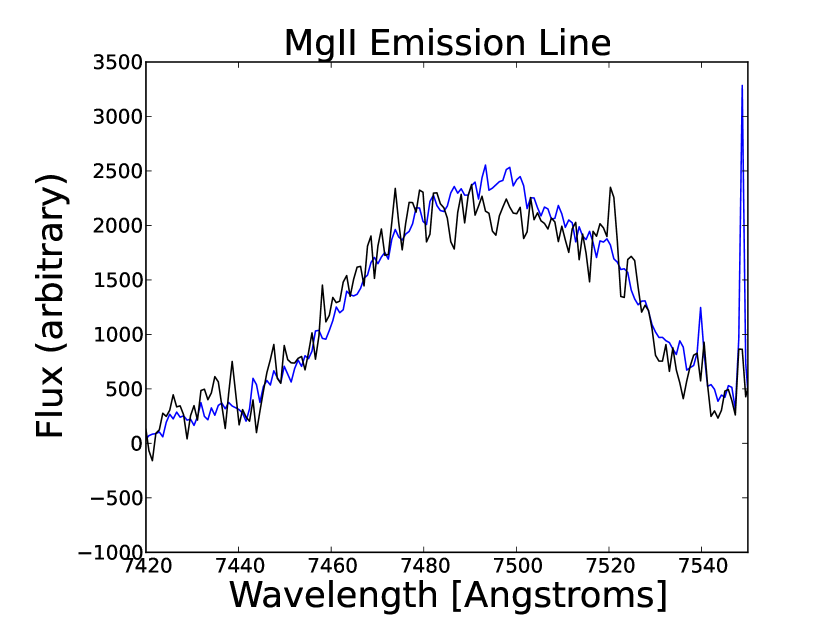
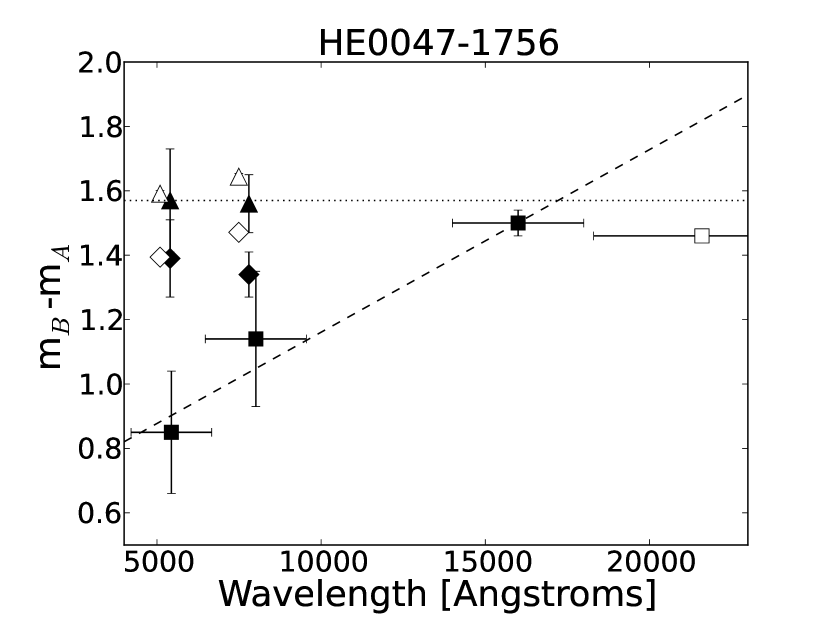
In Figure 1 the A and B spectra obtained with the Magellan telescope in 2008 are presented in the spectral ranges corresponding to the MgII and CIII] emission lines. There are no differences between the emission line profiles that could indicate microlensing effects on the BLR. In Table 2 and Figure 2 we present magnitude differences for the emission lines and adjacent continua. There is good agreement between our results and those of Sluse et al. (2012). The emission line average is 1.59 0.02 mag. In the 2008 (this work) and 2005 (Sluse et al., 2012) epochs there is a relatively small offset between lines and continuum that indicates microlensing of amplitude less than mag.
Much more significant variations of the continuum (Fig. 2) are found by comparing with CASTLES data in the F555W, and F814W filters. The result for the H-band filter (= 1.5 0.04), however, agrees with the emission line average indicating that the region generating the emission in the H band is not affected by microlensing. The dependence with wavelength is evidence of chromatic microlensing in the 2003 epoch when the HST data were taken. The differences between the average value of the emission lines and the three CASTLES points, , are listed in Table 3.
Following the method described in §3 we use these wavelength dependent microlensing measurements to estimate the size and temperature profile of the accretion disk. We have used Lensmodel (Keeton, 2001) to fit a SIS + lens model to the images coordinates of HE0047-1756 from CASTLES and to the emission-line average flux ratio that we measured. The best fit yields a mass scale of =0.75, shear of =0.05 and shear position =-6.44 (see Table 7). These results are in agreement with Mediavilla et al. (2009) and Sluse et al. (2012).
In Figure 3 we present the probability density functions of and conditioned to the microlensing measurements, (Table 3), , using either a linear or log prior. From these probability distributions we obtain the following estimates for the accretion disk parameters: = (9.2 5.0) light days and p = (2.0 0.8) using linear priors, and rs = 4.6 light days and p = (2.3 0.8) using logarithmic priors (Fig. 3). For 0.3M⊙ microlenses the sizes would be: = (5.0 2.7) light days (lin) and rs = 2.5 light days (log). The values for are in reasonable agreement with typical size estimates derived for other systems using microlensing (see Jiménez-Vicente et al. (2012) and references therein). Due to the large microlensing chromaticity detected in this system, the values for are larger than those predicted by Shakura & Sunyaev (1973), although consistent within errors. This is notable because in previous studies (Jiménez-Vicente et al., 2014) microlensing chromaticity was relatively weak and the inferred values for significantly smaller than the predictions of the thin disk model.
4.2 SDSS1155+6346
SDSS1155+6346 is a double system discovered by Pindor et al. (2004) in the Sloan Digital Sky Survey data set (York et al., 2000) with a separation of 1.94 between the images (CASTLES, ). Pindor et al. (2004) measured redshifts of zL = 0.18 and zS = 2.89 for the lens and the source, respectively. The B image is within 0.2 from the galaxy center and, unusually, it is the brighter component.
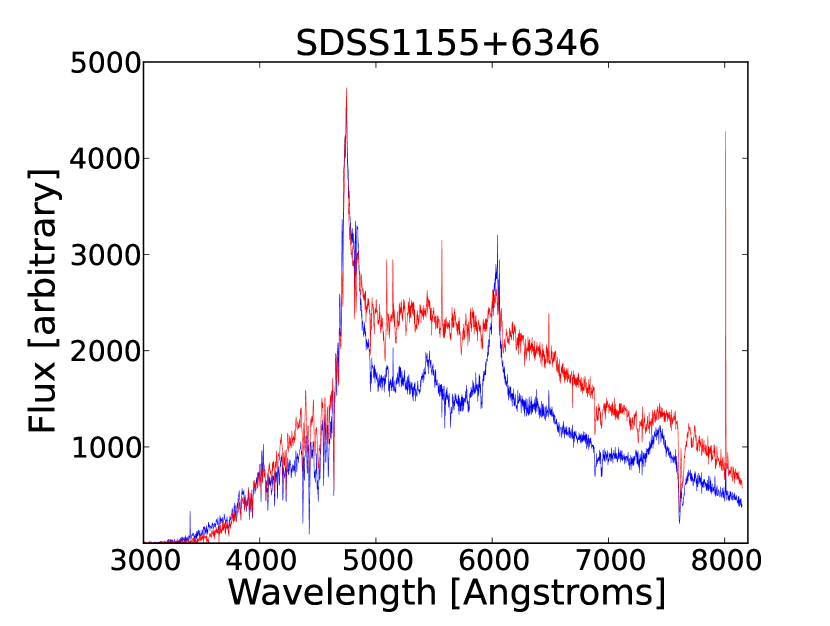
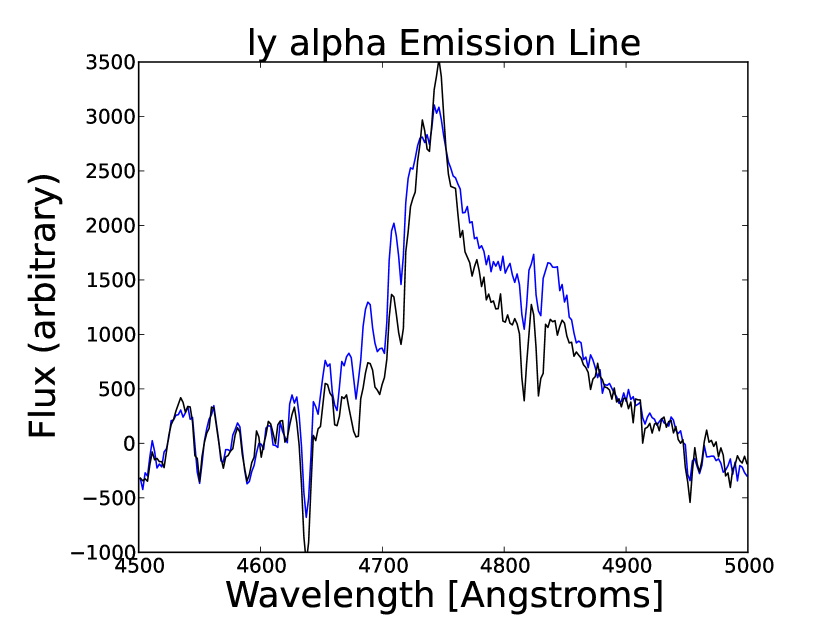
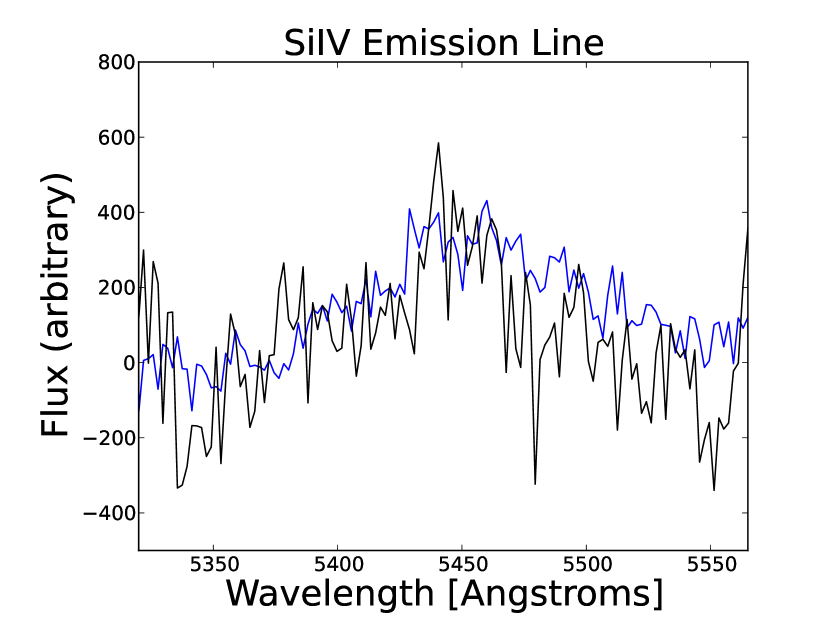
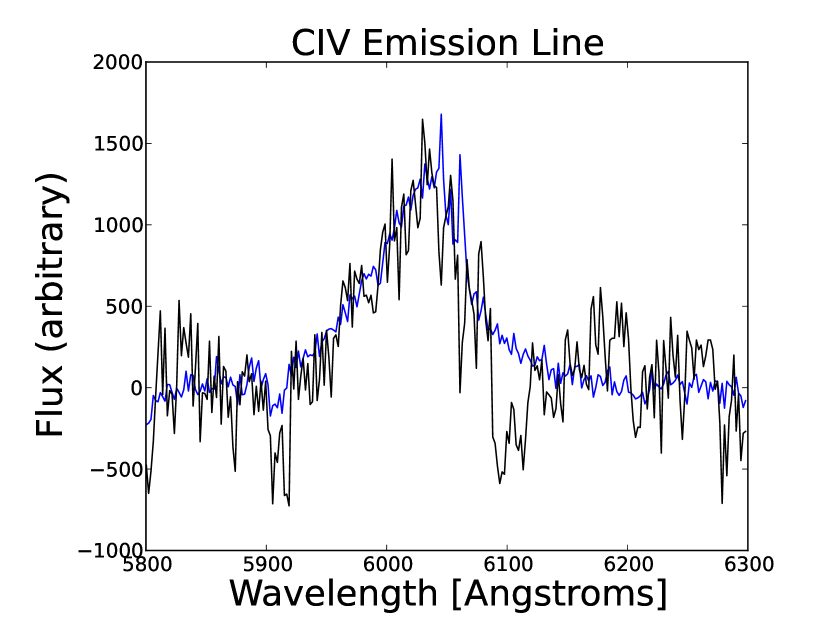
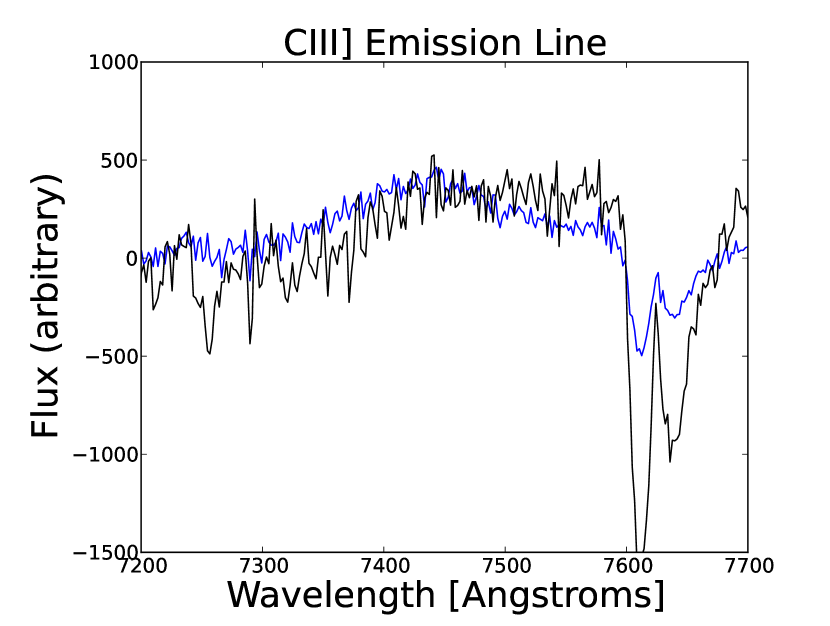
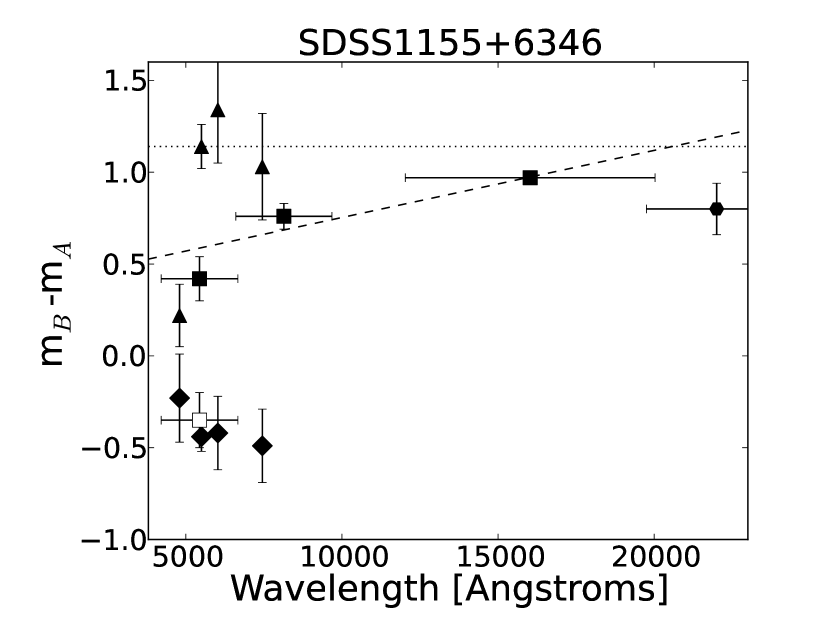
In Figure 4 we present the A and B spectra from the 2010 MMT observations. These spectra are very similar in shape to those obtained by Pindor et al. (2004) if one takes into account that our data have not been flux-calibrated. The contribution from the lens galaxy to the continuum almost disappears blue-ward from Ly. In Figure 5 we present the continuum-subtracted and normalized spectra in the regions corresponding to the Ly, SiIV, CIV, and CIII] emission lines. The A and B spectra are well matched for SiIV, CIV, and CIII] taking into account the presence of absorption features corresponding to the lens galaxy in the B spectrum. In Ly, however, there is a significant difference between the shapes of the line profiles corresponding to A and B images. We have tried a second order polynomial fit to the continuum and obtained the same results. These differences seem to be also present in the spectra taken by Pindor et al. (2004). However, the lens galaxy contribution to the continuum of the B image spectrum drastically changes from the red to the blue sides of Ly making more uncertain the continuum subtraction and a sharp decay of the lens galaxy contribution in the red wing of Ly may explain the observed differences. On the other hand, the magnitude differences obtained from the continua adjacent to the emission lines show a significant variation at Ly: -0.23 0.17 mag (Ly), -0.44 0.08 mag (SiIV region), -0.42 0.20 mag (CIV region) and -0.49 0.20 mag (CIII] region). In Figure 6 we plot the magnitude differences corresponding to the emission lines and adjacent continua with data corresponding to the F555W, F814W, F160W, (CASTLES) and K bands (Pindor et al. 2004) obtained after subtracting the lens galaxy. The contamination from the lens galaxy is clearly present in our continuum data. In fact, if we use the F555W data without removing the contamination of the galaxy (Fig. 6) the resulting magnitude difference is in agreement with our data. If we leave aside the Ly data that may be most contaminated by the lens galaxy continuum, the magnitude differences obtained from the other lines agree within the uncertainties and are also consistent with the K band data from Pindor et al. (2004), indicating that no strong differential extinction is affecting the flux ratios. If we take the average of the values corresponding to SiIV, CIV, and CIII] emission lines as the no microlensing baseline, 1.17 0.11 mag, we can determine the chromatic variation of the CASTLES continuum that will be used to estimate the size and temperature of the quasar disk (see Table 5).
We use Lensmodel (Keeton, 2001) to fit a SIS + lens model to the image positions of SDSS1155+6346 from CASTLES and of the average flux ratio emission lines measured (excluding Ly). The best fit yields a mass scale of =0.78 and a very high shear of =0.21 with =6.63 (Table 7). Chantry et al. (2010) suggest a nearby cluster may explain the high shear and ellipticity that we measured. We identify this cluster as MaxBCG J178.81693+63.83446 (Koester et al., 2007).
In Figure 7 we present , the pdf of and conditioned to the microlensing measurements, (Table 6 ), using either a linear or log prior. From these probability distributions we obtain the following estimates for the accretion disk parameters: rs = (18 7) light days and p = 1.4 0.6 for the linear prior, and rs = 10 light days and p = 1.5 0.6 for the logarithmic prior. For 0.3M⊙ microlenses the sizes would be rs = (0.9 3.8) light days (lin prior) and rs = 5.5 light days (log prior).
As in the case of HE0047-1756 the large measured microlensing chromaticity implies values of consistent with the thin disk model. The inferred size is large not only compared with the thin disk model predictions but also with microlensing based estimates obtained for other lensed systems
5 Conclusions
In this paper we analyzed spectroscopic data for HE0047-1756 and SDSS1155+6346 to determine the influence of microlensing and study the inner quasar structure. We point out the following results:
1 - The shapes of the emission line profiles corresponding to the A and B images match well except in the case of Ly for SDSS1155+6346, which shows strong differences in shape and an anomalous B/A flux ratio. However, the contamination from the lens galaxy in the image B spectrum strongly falls off just below this emission line, so the continuum subtraction is uncertain.
2 - When we compare the continuum from CASTLES broad band data (2003), with the no microlensing baseline consistently established for each lensed system using the emission line core flux ratios, we find strong chromatic microlensing in both systems. In HE0047-1756 we measure microlensing amplitudes of: -0.75 0.19 mag (5439), -0.45 0.22 mag (8012), and -0.09 0.04 mag (16000). In SDSS1155+6346 we measure: -0.75 0.16 mag (5439), -0.41 0.13 mag (8012), and -0.20 0.11 mag (16000).
3 - Using a Bayesian analysis, we estimate the size, , and the slope of the size scaling with wavelength, , of the quasar continuum emitting regions. For HE0047-1756 we found = (5.0 2.7) light days and p = 2.0 0.8 (linear prior), and rs = 2.5 light days and p = 2.3 0.8 (log prior). For SDSS1155+6346 we found rs = (9.9 3.8) light days and p = 1.4 0.6 (linear prior), and rs = 5.5 light days and p = 1.5 0.6 (log prior). The estimated values for are consistent, within errors, with the predictions of the thin disk theory but values are substantially larger than expected (see Jiménez-Vicente et al. (2012, 2014), and references therein).
4 - Using the extinction-free and microlensing-free emission line ratios, we have computed SIS + models for the two lens systems. In the SDSS1155+6346 case we found a high shear as previously found by Chantry et al. (2010), which can be explained by the presence of the cluster MaxBCG J178.81693+63.83446 (Koester et al., 2007).
References
- Abajas et al. (2002) Abajas, C., Mediavilla, E., Munõz, J.A., Popović, L.C., Oscoz, A. 2002, ApJ, 576, 640
- Balmés & Corasaniti (2013) Balmés, I., Corasaniti, P. S., 2013 MNRAS431, 1528-1540
- Blackburne et al. (2011) Blackburne, J.A., Pooley, D., Rappaport, S. ans Schechter, P.I. 2011, ApJ, 729,34
- Bentz et al. (2009) Bentz, M. C., Walsh, J. L., Barth, A. J., Baliber, N., Bennert, V. N., Canalizo, G., Filippenko, A. V., Ganeshalingam, M., Gates, E. L., Greene, J. E., and 17 coauthors 2009, ApJ, 705, 199
- (5) CASTLES survey: C.S. Kochanek, E.E. Falco, C. Impey, J. Lehar, B. McLeod, H.W. Rix
- Chang & Refsdal (1979) Chang, K., & Refsdal, S. 1979, Nature, 282, 561
- Chantry et al. (2010) Chantry, V., Sluse, D., & Magain, P. 2010, A&A, 522, A95
- Congdon et al. (2005) Congdon, A. B., Keeton, C. R., 2005, MNRAS364, 1459-1466
- Davis et al. (2003) Davis, A. N., Huterer, D., Krauss, L. M., 2003, MNRAS344, 1029-1040.
- Eingenbrod et al. (2006) Eigenbrod, A., Courbin, F., Meylan, G., Vuissoz, C. & Magain, P. 2006b, A&A, 451, 759
- Fadely & Keeton (2011) Ross Fadely & Charles Keeton, 2011 ApJ, 141:101
- Gómez-Álvarez et al. (2006) Gómez-Álvarez, P., Mediavilla, E., Muñoz, J.A., Arribas, S., Sánchez, S.F., Oscoz, A., Prada, F., Serra-Ricart, M. 2006 ApJ, 645, L5
- Guerras et al. (2013a) Guerras, E., Mediavilla, E., Jimenez-Vicente, J., Kochanek, C. S., Muñoz, J. A., Falco, E., Motta, V. 2013a ApJ, 764, 160
- Guerras et al. (2013b) Guerras, E., Mediavilla, E., Jimenez-Vicente, J., Kochanek, C. S., Muñoz, J. A., Falco, E., Motta, V., Rojas, K. 2013b ApJ778, 123
- Jiménez-Vicente et al. (2012) Jiménez-Vicente, J., Mediavilla, E., Muñoz, J. A., Kochanek, C. S. 2012, ApJ, 751, 106
- Jiménez-Vicente et al. (2014) Jiménez-Vicente, J., Mediavilla, E., Kochanek, C. S. , Muñoz, J. A., Motta, V., Falco, E., Mosquera A. M. 2014 ApJ783, 47
- Jullo et al. (2010) Jullo, E., Natarajan, P., Kneib, J.P., DÁloisio, A., Limousin, M., Richard, J., Schimd, C., 2010, Science, 329, 924
- Keeton (2001) Keeton, C.R. 2001, unpublished [arXiv:astro-ph/0102340]
- Kochanek (1991) Kochanek, C., 1991, ApJ, 373, 354-368
- Kochanek et al. (2001) Kochanek, C. S.; Keeton, C. R.; McLeod, B. A., 2001 ApJ, 547, 50-59
- Kochanek (2004) Kochanek, C. S., 2004, ApJ, 605, 58-77.
- Koester et al. (2007) Koester, B. P., McKay, T. A., Annis, J., Wechsler, R. H., Evrard, A., Bleem, L., Becker, M., Johnston, D., Sheldon, et al., 2007, ApJ, 660, 239-255
- Koopmans & Fassnacht (1999) Koopmans, L. V. E., & Fassnacht, C. D. 1999, ApJ, 527, 513
- Lewis & Ibata (2004) Lewis, G.F, Ibata, R.A. 2004, MNRAS, 355, 106
- Mandelbaum et al. (2009) Mandelbaum, Rachel; Li, Cheng; Kauffmann, Guinevere; White, Simon D. M., 2009, MNRAS393, 377-392
- Mediavilla et al. (2006) Mediavilla, E., Muñoz, J.A., Lopez, P., Mediavilla, T., Abajas, C., González-Morcillo, C., Gil-Merino, R. 2006, ApJ, 653, 942
- Mediavilla et al. (2009) Mediavilla, E., Muñoz, J.A., Falco, E., Motta, V., Guerras, E., Canovas, H., Jean, C., Oscoz, A., Mosquera, A.M. 2009, ApJ, 706, 1451
- Mediavilla et al. (2011) Mediavilla, E., Mediavilla, T., Muñoz, J.A., Ariza, O., Lopez, P., González-Morcillo, C., Jimenez-Vicente, J. 2011 ApJ, 741, 42
- Morgan et al. (2010) Morgan, C., Kochanek, C.S., Morgan, N.D., & Falco, E.E. 2010, ApJ, 712, 1129
- Mosquera et al. (2009) Mosquera, A.M., Muñoz, J.A., Mediavilla, E. 2009 ApJ, 691, 1292
- Mosquera & Kochanek (2011) Mosquera, A.M., Kochanek, C.S., 2011, ApJ, 738, 96
- Motta et al. (2012) Motta, V., Mediavilla, E., Falco, E., & Muñoz, J. A. 2012, ApJ, 755, 82
- Moustakas & Metcal (2003) Moustakas, L.A. and Metcalf, R.B. 2003, MNRAS, 339, 607-615
- Muñoz et al. (2011) Muñoz, J. A., Mediavilla, E., Kochanek, C. S., Falco, E. E., & Mosquera, A. M. 2011, ApJ, 742, 67
- Ofek et al. (2006) Ofek, E.O, Maoz, D., Rix, H.-W., Kochanek, C. S., & Falco E. E. 2006, ApJ, 641, 70
- Oguri et al. (2002) Oguri, M., Taruya, A., Suto, Y., Turner, E. L., 2002, ApJ568, 488-499
- Oguri (2007) Oguri, M., 2007, ApJ, 660, 1-15.
- Pindor et al. (2004) Pindor, B. Eisenstein, D. J., Inada, N., et al. 2004 AJ, 127, 1318
- Poindexter et al. (2007) Poindexter, S., Morgan, N., Kochanek, C. S., Falco, E. E., 2007 ApJ660, 146-151.
- Poindexter & Kochanek (2010) Poindexter, S., Kochanek, C. S., 2010, AJ712, 668-673
- Popović et al. (2001) Popović, L.Ć., Mediavilla E., Muñoz, J.A. 2001 A&A, 378,295
- Pooley et al. (2007) Pooley, D., Blackburne, J.A., Rappaport, S., & Schechter, P.L. 2007, ApJ, 661, 19
- Rauch & Blandford (1991) Rauch, K. P., Blandford, R. D., 1991, AJ381, L39-L42.
- Richards et al (2004) Richards, G.T., Keeton, C.R., Pindor, B., Hennawi, J.F., Hall, P.B., Turner, E.L., Inada, N., Oguri, M., Ichikawa, S.I., Becker, R.H., Gregg, M.D., White, R.L., Wyithem J.S.B., Schneider, D.P., Johnston, D.E., Frieman, J.A., Brinkmann, J. 2004, ApJ, 610, 679
- Schechter Wambsganss (2002) Schechter, P., Wambsganss, J. 2002, AJ, 580, 685
- Schmidt & Wambsganss (2010) Schmidt, R. W.,& Wambsganss, J. 2010. Gen Rel. Grav., 42, 2127
- Schneider et al. (1992) Schneider, P., Ehlers, J., & Falco, E. 1992, Springer-Verlag
- Shakura & Sunyaev (1973) Shakura, N. I., & Sunyaev, R. A. 1073, A&A, 24,337
- Sluse et al. (2012) Sluse, D., Hutsemékers, D., Courbin, F., Meylan, G., & Wambsganss J. 2012 A&A544, A62
- Wambsganss & Pacszyński (1991) Wambsganss, J., Pacszyński, B. 1991, AJ, 102, 864
- Wambsganss (1998) Wambsganss, J. 1998, Liv. Rev., 1, 12
- Wambsganss (2006) Wambsganss, J. 2006, Gravitational Lensing: Strong, Weak and Micro, Saas-Fee Advanced Courses, Vol 33 (Berling: Springer), 453
- Webster et al. (1991) Webster, R. L., Ferguson, A. M. N., Corriga, R. T., & Irwin, M. J. 1991, AJ, 102, 1939
- Witsotzki et al. (1995) Wisotzki, L., Koehler, T., Ikonomou, M., Reimers, D. 1995, A&A, 279, L59
- Witsotzki et al. (2004) Wisotzki, L., Schechter, P., Chen, H.-W., et al. 2004, A&A, 419, L31
- Witt et al. (1995) Witt, H. J., Mao, S., & Schechter, P. L. 1995, AJ, 443, 18
- Yonehara et al. (1998) Yonehara, A., Mineshige, S., Manmoto, T., Fukue, J., Umemura, M, Turner, E. L., 1998, ApJ501, L41
- Yonehara et al. (2008) Yonehara, A., Hirashita, H., Richter, P., 2008, AJ, 478, 95-109
- York et al. (2000) York, D. G., et al. 2000, AJ, 120, 1579
- Zu et al. (2011) Zu, Y., Kochanek, C. S., Peterson, B. M. 2011, ApJ, 735, 80


| System | aaSeparation between images () | Instrument | Date | Seeing () | ExposurebbSeconds | P.A.ccPosition angle in degrees E of N |
|---|---|---|---|---|---|---|
| HE0047-1756 | 1.43 | Mag/IMACS Long Cam. | 2008/01/13 | 0.6 | 1200 | -62.9 |
| SDSS1155+6346 | 1.94 | MMT/Blue Channel | 2010/09/20 | 0.7 | 1800 | 124.9 |
| Region | Å | WindowaaIntegration window (Å) | mB - mA (mag) | mB - mAbbData from Sluse et al. (2012) (mag) |
|---|---|---|---|---|
| Continuum | 5077 | 4800-5400 | 1.39 0.12 | 1.394 0.003 |
| 7445 | 7330-7750 | 1.34 0.07 | 1.471 0.003 | |
| Line | CIII] | 5080-5140 | 1.57 0.16 | 1.591 0.007 |
| MgII | 7465-7525 | 1.56 0.09 | 1.644 0.005 |
| Å | mC - mL (mag) |
|---|---|
| 5439 | -0.75 0.19 |
| 8012 | -0.45 0.22 |
| 16000 | -0.09 0.04 |
| Region | Å | Windowaafootnotemark: (Å) | mB - mA (mag) |
|---|---|---|---|
| Continuum | 4730 | 4500-5050 | -0.23 0.17 |
| 5434 | 5350-5700 | -0.44 0.08 | |
| 6025 | 5600-6400 | -0.42 0.20 | |
| 7426 | 7000-7800 | -0.49 0.20 | |
| Line | Ly | 4718-4768 | 0.22 0.34 |
| SiIV | 5400-5500 | 1.14 0.12 | |
| CIV | 6015-6065 | 1.34 0.29 | |
| CIII] | 7390-7490 | 1.03 0.29 |
| Å | Continuum (mag) |
|---|---|
| 5439 | 0.42 0.12 |
| 8012 | 0.76 0.07 |
| 15500 | 0.97 0.03 |
| Å | mC - mL (mag) |
|---|---|
| 5439 | -0.75 0.16 |
| 8012 | -0.41 0.13 |
| 15500 | -0.20 0.11 |
| System | Model | b() | fb/fa | ||||||
|---|---|---|---|---|---|---|---|---|---|
| HE0047-1756 | SIS+ | 0.75 | 0.05 | -6.44 | 0.24 | 0.45 | 0.48 | 0.62 | 0.66 |
| SDSS1155+6346 | SIS+ | 0.78 | 0.21 | 6.63 | 0.34 | 0.22 | 0.03 | 1.67 | 1.47 |