The Zurich Environmental Study (ZENS) of Galaxies in
Groups along
the Cosmic Web. V. Properties and Frequency of Merging
Satellites and Centrals in Different Environments $\star$$\star$affiliation: Based on observations collected at the European Southern Observatory, La Silla Chile. Program ID 177.A-0680
Abstract
We use the Zurich ENvironmental Study (ZENS) database to investigate the environmental dependence of the merger fraction and merging galaxy properties in a sample of 1300 group galaxies with and . In all galaxy mass bins investigated in our study, we find that decreases by a factor of in groups with halo masses relative to less massive systems, indicating a suppression of merger activity in large potential wells. In the fiducial case of relaxed groups only, we measure a variation dex-1, which is almost independent of galaxy mass and merger stage. At galaxy masses , most mergers are dry accretions of quenched satellites onto quenched centrals, leading to a strong increase of with decreasing group-centric distance at these mass scales. Both satellite and central galaxies in these high mass mergers do not differ in color and structural properties from a control sample of nonmerging galaxies of equal mass and rank. At galaxy masses – where we mostly probe satellite–satellite pairs and mergers between star-forming systems – close pairs (projected distance kpc) show instead enhanced (specific) star formation rates and larger sizes than similar mass, nonmerging satellites. The increase in both size and SFR leads to similar surface star-formation densities in the merging and control-sample satellite populations.
Subject headings:
galaxies: evolution – galaxies: formation – galaxies: groups: general – galaxies: interactions – galaxies: star formation – galaxies: structure1. Introduction
It is observationally established that galaxy properties, such as star-formation activity or morphology, can be influenced by the surrounding environment (e.g., Oemler , 1974; Dressler , 1980; Balogh et al., 1999; Baldry et al., 2006; Weinmann et al., 2006; Park et al., 2007; Peng et al., 2010; Kormendy & Bender, 2012; Newman et al., 2012; Peng et al., 2012; Wetzel et al. , 2012; Carollo et al., 2014; Cibinel et al., 2013a, b). Among the different processes through which environmental forcing on galaxies can manifest itself, an enhanced rate of galaxy-galaxy interactions or mergers (e.g., Toomre , 1977; Feldmann et al., 2010; Kampczyk et al., 2013) is naturally expected in a cold dark matter (CDM) universe, in which the backbone growth of dark matter halos is well understood in terms of hierarchical accretion of smaller structures within the filamentary cosmic web (e.g., Davis et al., 1985; Pearce et al., 1999; Wechsler et al., 2002; Springel et al., 2006; Maulbetsch et al., 2007; McBride et al., 2009).
Together with both internal (e.g., bar instabilities, Kormendy 1979; Combes et al. 1990; Carollo et al. 1997; Carollo 1999; Debattista et al. 2004, 2006; Kormendy & Kennicutt 2004) and environmental secular processes (e.g., ram-pressure stripping or harassment, Gunn & Gott 1972; Moore et al. 1996; Kormendy & Bender 2012), mergers can play a substantial role in the evolution of galaxies in high-density environments (Perez et al. 2009; McIntosh et al. 2008; Kormendy et al. 2010; Kampczyk et al. 2013, see also Kormendy 2013 for a review on internal versus external processes). Interactions and mergers between relatively gas-rich galaxies are likely to induce an enhancement in the star-formation rates (SFRs) of participating units or coalesced remnants (e.g., Larson & Tinsley , 1978; Mihos & Hernquist , 1994; Barnes , 2004; Feldmann et al., 2010; Kampczyk et al., 2013; Robotham et al., 2013) and are undoubtedly able to alter galaxy morphologies and structural properties (e.g., Toomre & Toomre , 1972; Dekel & Cox , 2006; Hopkins et al. , 2008; Naab Burkert & Hernquist , 1999; Naab, Jesseit & Burkert , 2006; Feldmann et al., 2008, 2010).
A number of studies have investigated galaxy mergers, and their effects on galaxy properties, as a function of galaxy stellar mass, central/satellite rank and environment (e.g., Barton et al., 2007; Perez et al., 2009; Ellison et al., 2010; Robotham et al., 2013). Although there is a general consensus that galaxies interacting with a close companion show a factor of 2 enhancement in their SFRs (e.g., Larson & Tinsley , 1978; Kennicutt et al., 1987; Barton et al. , 2000; Lambas et al., 2003; Robaina et al., 2009; Bridge et al., 2010; Robotham et al., 2013) and in their specific star formation rates (sSFR; Sol Alonso et al. 2006) relative to their counterparts in isolation, it is still debated whether the strength of the merger-induced star formation varies with environment. Some of these studies indicate that the enhancement of star formation is predominantly happening in pairs with small ( kpc) physical separations (Alonso et al., 2004; De Propris et al., 2005; Geller et al., 2006; Perez et al., 2009; Ellison et al., 2010; Scudder et al., 2012; Patton et al., 2013); other works suggest that star formation in merging systems is preferentially enhanced only in the poorest groups (Sol Alonso et al., 2006) or at relatively low large-scale structure (LSS) densities (Perez et al. , 2009; Ellison et al., 2010; Patton et al., 2011; Kampczyk et al., 2013). A comprehensive picture is, however, still missing, often because of a lack of disentanglement of the environmental signal from the effect of galaxy mass and because of differences between the adopted environmental definitions in the various studies.
Furthermore, it is also unclear which environment is more conducive to galaxy mergers and interactions. The -body simulations of a CDM universe show that dark matter halo position, orbit and rank in the LSS determine whether and when halos will merge (e.g., Angulo et al., 2009). While this indirectly implies a dependence of galaxy mergers and interaction rates on environment, the relative importance of the LSS density, group halo mass, and location within group halos in facilitating galaxy encounters is still unclear. Also debated is whether galaxy mergers can affect both central galaxies and satellite galaxies in the same halos. Semianalytic models of galaxy formation seem to indicate that satellite–satellite mergers are rare and that most mergers involve central galaxies swallowing satellites (e.g., Hatton et al., 2003; Guo et al., 2011); currently there is, however, little observational evidence for this.
In this work we utilize the database of the Zurich Environmental Study (ZENS) (Carollo et al., 2013b, hereafter Paper I) to make further progress on understanding the dependence of the merger fraction and the properties merging galaxies on (1) galaxy stellar mass, (2) rank of central or satellite within a group halo potential, and (3) local (mass of host group halo and group-centric distance) versus LSS environment.
Specifically we use the environmental measurements of Paper I, the structural measurements for the ZENS galaxies presented in Cibinel et al. (2013a, hereafter Paper II), and the corresponding photometric measurements presented in Cibinel et al. (2013b, hereafter Paper III) to investigate: (1) how the fraction of galaxy mergers depends, at fixed stellar mass and central/satellite rank, on group halo mass, group-centric distance and large scale structure (over)density; and (2) the structural and star-formation properties of satellites and centrals participating in mergers, relative to nonmerging galaxies of similar stellar mass, rank and environment.
The paper is organized as follows. In Section 2, a brief summary of ZENS is given, with emphasis on the set of environmental, structural and photometric measurements of Papers I, II and III, that we utilize for this study as well as on the definition of the (sub) sample of merging galaxies. The dependence of merger fraction on the mass of the group, group-centric distance and LSS density is presented in Section 3. We present our results on the properties of merging satellites in Section 4 and merging centrals in Section 5. The results are discussed in Section 6 and summarized in Section 7. Throughout this work we assume , and ; all magnitudes are in the AB system.
Total & 162 (74,43) 34 (27,15) 19 (13,6) 89 (14,2) 20 (20,20)
Centrals 32 (15,7) 8 (5,2) 6 (5,1) 14 (1,0) 4 (4,4)
Low-mass satellites 81 (38,25) 14 (13,8) 3 (1,0) 50 (10,1) 14 (14,14)
()
High-mass satellites 49 (21,11) 12 (9,3) 10 (7,5) 25 (3,1) 2 (2,2)
()
Relaxed groups
Total 123 27 15 67 14
Centrals 28 8 5 12 3
Low-mass satellites 59 8 2 40 9
()
High-mass satellites 36 11 8 15 2
()
Note. — Breakdown of the number of central and satellite galaxies per merger type: class 1: close pairs with clear signs of mergers, identified as single objects in the 2dFGRS, no confirmation of physical association; class 2: same as 1, but physical association confirmed by redshifts found in other surveys (see text); class 3: ‘close kinematic pairs’ with projected distances lower than 50 kpc; class 4: single galaxies with disturbed morphologies and/or irregular shapes. We refer to these galaxies as ‘coalesced systems’ throughout the paper. The numbers in parentheses in the upper half of the Table refer to galaxies in systems with projected separation lower than 20 kpc and 10 kpc (left and right, respectively). Satellites are further split into two galaxy mass bins ( and ), as discussed in Section 2.4. The table shows additionally the statistics for relaxed groups only, where the majority of the mergers occurs.
2. Dataset
2.1. A brief description of ZENS
ZENS is based on a sample of 141 galaxy groups extracted from the 2-degrees Field Galaxy Redshift Survey (2dFGRS; Colless et al. 2001), and specifically from the Percolation-Inferred Galaxy Group (2PIGG) catalog (Eke et al., 2004a). The 141 ZENS groups are an unbiased selection of the 2PIGG groups in the redshift range 0.050.0585 that have at least five confirmed members brighter than ; ZENS group halo masses range from to .
We observed all ZENS groups in the and bands with the Wide Field Imager (WFI) camera on the 2.2m telescope at la Silla (ESO Large Programme 177.A-0680). The details of these observations are provided in Paper II. Briefly, our new imaging reached a resolution of about 1′′ ( 1kpc at the redshift of ZENS) in both bands and, with a total integration time of about 700 sec per group, a depth of =27.2mag/arcsec2 and =25.5 mag/arcsec2. A fully-calibrated set of structural and photometric parameters obtained from these observations is published in the ZENS catalog of Paper I. The derivation of the structural parameters is described in Paper II, and the corresponding photometric measurements are presented in Paper III. Key data products from these works which we utilize in this paper include measurements of galactic sizes (-band half-light radii from single Sérsic profiles) integrated and spatially resolved colors, stellar masses, SFRs and sSFRs. Galaxy stellar masses and (s)SFRs were derived from spectral energy distribution (SED) fitting using the ZEBRA+ code (Oesch et al., 2010), an unpublished upgraded version of the ZEBRA code of Feldmann et al. (2006). Specifically, ZEBRA+ was run using synthetic stellar population models from the Bruzual &, Charlot et al. (2003) library, with a Chabrier et al. (2003) initial mass function (IMF).
2.2. Four Different Measurements of Environment
ZENS enables us with a single galaxy sample to investigate how galaxy properties depend, at fixed stellar mass, on four different measurements of environment: the mass of the host group halo, , the projected group-centric distance in units of , the typical scale radius of the group halo111 is defined in Paper I as , with the Hubble constant at the given redshift., the LSS (over)density , and (4) the rank of central or satellite galaxy within the group halo. Paper I presents the computations of these environmental metrics, including a comprehensive set of tests done to assess their robustness; here we only briefly highlight the main steps in their derivation.
The group halo mass was computed from the total group luminosity, integrating the luminosity function to account for the contribution of galaxies below the survey magnitude limit. The luminosity is then transformed into the dark matter halo mass by assuming a mass-to-light ratio calibrated with mock catalogs (Eke et al., 2004b). Tests done to assess the impact of interlopers and missed galaxies show that the masses of ZENS groups have a statistical uncertainty of about 0.3 dex.
The was defined through a fifth-nearest-neighbor algorithm, using however the mass-weighted groups (not the galaxies, as commonly done) as the tracers of the LSS density field. All galaxy members of a given ZENS group are thus at the same underlying LSS density. This approach reduces the cross-talk which is present, especially at high densities, between LSS density and halo mass/richness (and thus group-centric distance), when using the individual galaxies as Nth-nearest neighbors (see, e.g., Peng et al., 2010). The typical size of the LSS probed by our estimate of is between 1.5 Mpc and 2.5 Mpc (25th and 75th percentiles of the distributions of distances to the 5th nearest group, including ungrouped galaxies, see Paper I).
Both the radial projected position and the central/satellite rank depend on an accurate definition of the central galaxy in each group. We classified the ZENS groups as relaxed and unrelaxed, depending on whether or not a self-consistent solution for a galaxy member to be the central galaxy could be found for that group. To be bona fide centrals, we required galaxies (1) to be consistent with being the most massive member of the group (within the errors associated with our galaxy stellar mass estimates), (2) to be located at a projected distance within 0.5 from the mass-weighted center of the group, and (3) to have a velocity within one standard deviation from the mean group velocity. In about one-half of the groups, no galaxy member satisfied simultaneously these three conditions. These groups were flagged as unrelaxed and had assigned, as a formal central galaxy, the galaxy member with the highest stellar mass (although either the spatial or the velocity conditions for it to be a genuine central were not satisfied - see Paper I).
2.3. The Merger Sample
A total of 162 galaxies with mass above were identified as merging/disturbed systems in the ZENS sample; this includes ‘interacting galaxies’ (class 1 and 2), ‘close kinematic pairs’ (class 3) and ‘coalesced systems’ (class 4) as summarized in Table 1.
Specifically, galaxies in the interacting sample are systems that were identified as single sources in the 2dFGRS (namely they have only one redshift measurement) but for which we found an overlapping companion or clear merger features with another nearby galaxy (with no 2dFGRS spectra) in our WFI imaging. There are 26 such pairs (or triplets, see Figure 41 in Paper II) with a median separation of 11 kpc. Structural and photometric properties have been measured on each individual galaxy in most of the cases. In nine of these pairs we found the redshift of both companions in either the Sloan Digital Sky Survey (SDSS) (York et al., 2000) or the NED222http://ned.ipac.caltech.edu/ databases (merger flag in the ZENS database, class 2 in this work); this confirmed a physical association of the two galaxies in a merger process. In the remaining cases for which no spectroscopic information is available (merger flags in the ZENS database, class 1 in this work), the presence of tidal features or disturbed morphologies often supports the merger scenario, although for galaxies flagged as in the ZENS parent catalog a chance projection may not be excluded. We therefore checked and found that our results do not change if these systems are removed from the analysis. Given the typical separations and the total stellar masses of the 26 pairs we estimate using Equation (10) in Kitzbichler & White (2008) that these systems will merge on timescales of a 300 Myr (median value). In 14 of these 26 pairs, the primary galaxy (i.e., the most massive galaxy participating in the merger) is a central galaxy; in the remaining pairs both participating galaxies are satellites.
Another 89 merging galaxies belong to group ‘kinematic pairs’ (and one triplet: merger flag in the parent catalog, class 3 in this work). These are ZENS group members having a projected distance from another member smaller or equal to the largest separation observed in the ‘interacting’ sample (classes 1 and 2 in Table 1, maximal separation of kpc) and a velocity difference that is less than . For this subsample, the median projected separation is kpc. In a third of these cases a central galaxy is the primary of the merging systems.
The remaining 20 merging systems were identified as such because of a clear multiple galaxy appearance, i.e., a morphology most likely arising from a multiple-galaxy contribution rather than a simple disturbed morphology for a single galaxy (merger flag ) or for having irregular morphologies (morphology type in the parent catalog); we interpret these systems (grouped together as class 4 in Table 1) to be at stages where the two progenitor galaxies are no longer fully separable. Only four of these coalesced mergers are central galaxies, the remaining are satellite galaxies.
In the following and in light of the above discussion, all merger classes will be grouped together when considering galaxies with separation 50 kpc that hence correspond to the global sample of ZENS mergers. We will also discuss the results by restricting the sample to pairs with separations 20 kpc or 10 kpc.
2.4. Circumventing Sample Biases: The Galaxy Populations Investigated in This Study
With key galaxy properties depending on galaxy stellar mass (e.g., star formation activity and metallicity, Brinchmann et al., 2004; Tremonti et al., 2004; Thomas et al., 2005; Gallazzi et al., 2005; Peng et al., 2010) and on the central versus satellite rank of a galaxy within its host group (e.g., colors and concentrations; see, e.g., Weinmann et al. 2009, and also our Papers I, II and III), it is important to compare the structural and star formation properties of merging galaxies and nonmerging control-sample galaxies at constant stellar mass and central versus satellite rank within the host group. Consequently, we will compare merging satellites involved in satellite–satellite mergers, as well as satellite companions in mergers with central galaxies, with nonmerging satellites of similar masses and, merging centrals with nonmerging centrals of similar mass. The corresponding control sample will contain all nonmerging satellites or centrals with stellar masses within dex from the median mass of the merger sample in a given mass bin.
In particular, in the following we split the merger (and control) sample into two mass bins: a ‘low galaxy mass bin’, defined within the range [[ (median mass: ), and a ‘high galaxy mass bin’, defined within the range [] (median mass: for satellites and for centrals).
The lower mass limit of is the 85 stellar mass completeness level for our star-forming sample; the corresponding value for quiescent galaxies is (see Paper II). Thus, our low galaxy mass bin is incomplete for passive galaxies and hence we will not comment on this population of galaxies. In contrast, a comparative analysis between merging galaxies and nonmerging control-sample galaxies is nevertheless robust because both galaxy populations suffer from identical incompleteness. Furthermore, star-forming galaxies are mass-complete at these mass scales, enabling a sound comparison between merging and nonmerging star-forming galaxies. Note that, because of the sample construction of ZENS (see Papers I and III), in this low-mass bin there are no central merging galaxies and thus our analysis at these mass scales will refer to satellites only.
On the other hand, the high galaxy mass bin is also complete for passive galaxies and is substantially populated by both satellite and central galaxies. Therefore, at these higher galaxy masses we are able to explore mergers involving quenched or star-forming galaxies as well as central–satellite or satellite–satellite encounters. In the high-mass bin we have 28 mergers involving a central among the pairs in the sample and four centrals that are in the class of coalesced mergers. The remaining merging systems are, formally, satellite–satellite mergers. Incompleteness in the parent 2dFGRS spectroscopic sample and statistical uncertainties in the group-finding algorithm may of course introduce errors in ranking central and satellite galaxies (see Paper I). As far as we could check, these merging systems involve genuine satellites, at least in the sense that they occur in relaxed groups that, considering the errors on the galaxy stellar mass estimates, clearly host substantially more massive galaxies (identified as the centrals of these groups). Only three mergers occur in unrelaxed groups in which the mass of the primary galaxy is consistent with being the largest in the group (although it has been discarded as central on the basis of velocity constraints; see Paper I).
Finally, the ZENS detection limits (given by the 1 background fluctuations in a uniform area of 1 arcsec2) of = 27.2 mag arcsec-2 and = 25.5 mag arcsec-2 (AB magnitudes) prevent us from detecting (smooth) weak tidal features at lower surface brightnesses (e.g van Dokkum et al., 2005; Tal et al., 2009). According to simulations (Kawata et al., 2006; Feldmann et al., 2008), such features are distinctive of either minor mergers or of the late stages of major encounters. They are visible 3–4 Gyr after the mergers if created by the interaction of a bulge-dominated system with a disk-dominated one. In this case, we may only miss mergers that occurred Gyr prior to the observation. On the other hand, very low surface brightness features are visible for 1 Gyr if originated in a merger of two dynamically hot systems (Feldmann et al., 2008). In this case, strong features quickly fade away, so we may miss somewhat more recent mergers.
2.5. Uncertainties in Color and SFR of Close Pairs
In Sections 4 and 5 we will compare colors and derived properties such as SFR and sSFR of merging and nonmerging galaxies. We hence briefly discuss here the sources of uncertainties on such quantities. We refer the interested reader to Paper III for a general discussion on errors affecting the parameters derived from the SED fitting and focus instead on the aspects that are more specific to the merger sample.
For mergers in which the two galaxies are sufficiently separated or for the disturbed isolated galaxies (class 4), the main sources of uncertainties are those also affecting the other ZENS galaxies, i.e., background noise and errors in the SED modeling. Namely, we expect typical errors on the masses, color and sSFR of a given galaxies to be on the order of 0.05 mag, 0.1 dex and 0.2 dex, respectively. We show these average uncertainties for the individual measurements with gray crosses in Figures 4-7.
However, for class 3 mergers or very close pairs almost at coalescence in classes 1 and 2, the blending between the two merging galaxies can introduce further biases in the estimates of magnitudes and colors (and hence masses and SFR). To test the effects of such galaxy confusion, we generated a set of artificial images consisting of two model galaxies placed at increasingly closer separations, starting from the maximum distance of 50 kpc. The simulated galaxies were selected to have magnitudes and sizes within the range observed in our merger sample and the artificial images were processed to reproduce the typical ZENS resolution and noise properties. While it is important to probe different combinations of inclinations and steepness of the light profiles for testing the efficiency of recovery of the intrinsic fluxes (see the extensive discussion in Paper II), a dense sampling of all regions of the parameter space is beyond the scope of this test. To bracket the typical observed distributions, we thus created galaxies with either Sérsic index = 1 or = 4 and ellipticities between 0 and 0.6. We then processed these artificial mergers as the real ZENS pairs and compared the fluxes measured within our fiducial 2 aperture (see Paper III for all details of the photometric measurements in ZENS) with those that would be obtained if the galaxy were in isolation333As discussed in Paper II, biases between the measured and intrinsic (input model) fluxes can arise by a number of observational limitations that are not related to the presence of a nearby companion. For this reason, the input model magnitudes cannot be directly compared with the measured values unless the corrections described in Paper II are applied. A full calibration of the set of models presented here is however beyond the scope of the test. We hence have chosen to compare the fluxes measured on the simulated pairs with those for identical artificial galaxies with no companions. Because these measurements are both affected by the same biases, they enable us to perform a consistent comparison..
As a result of this test we found that robust flux estimates can be derived for pairs with separations down to 8 kpc, resulting in a median magnitude difference from the isolated case smaller than 0.05 mag, i.e. comparable with the photometric uncertainty. In our sample of class 1 and 2 mergers about 25 % (six out of 26) are located at separations smaller than 8 kpc. We have tested our results by excluding these objects with larger uncertainties and found no substantial change with respect to what is discussed in the following for the entire sample.
3. Merger fractions as a function of halo mass, group-centric distance and LSS density
Let us start by addressing the question of whether and how the galaxy merger fraction at a constant galaxy stellar mass depends on any of the environments that we study in ZENS, i.e., group halo mass , group-centric distance , and LSS density .
Note that, unless specified otherwise, we join together the samples of merging satellites and centrals in the total = central+satellite merger fractions, independent of galaxy rank within the group potentials. Specifically, in each of our galaxy stellar mass and environmental bins, we estimate the merger fraction as , i.e., as the ratio between the number of merging systems in that bin and the number nonmerging galaxies (central plus satellites) in the same galaxy mass and environmental bin. For this calculation, we count merging pairs as a single system with the mass assigned by the primary galaxy.
3.1. Halo Mass
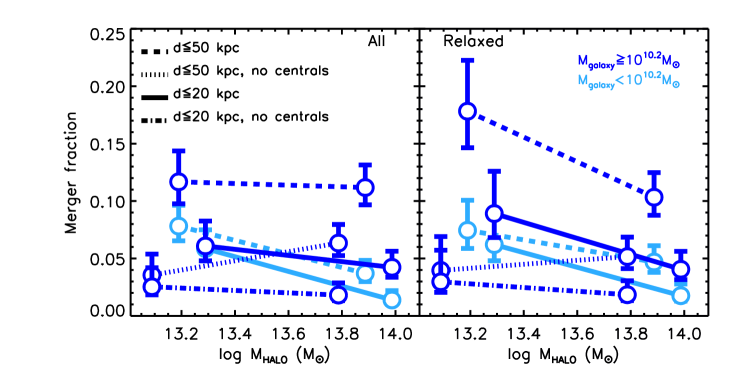
In Figure 1 we show the merger fraction as a function of the host halo mass, split into bins of primary galaxy stellar mass (dark blue: high-mass primaries - light blue: low-mass primaries). The results for all mergers (i.e., separation kpc) in our sample are shown with dashed lines (dotted when the mergers involving centrals are removed at high galaxy masses), whereas the measured fraction for close ( kpc) mergers are shown with solid lines (dot-dashed when the mergers involving centrals are removed).
Focusing at first on the entire sample of ZENS groups (left panel in the figure) and galaxies, we find that the merger fraction is a factor of 2–3 higher in the low group-mass bin relative to the high group-mass bin. Specifically, increases from in groups with , up to in lower mass groups, with a significance at both separations of kpc and kpc. The decline of the merger fraction between our low and high group-mass bins suggests that low-mass galaxy–galaxy merger activity is virtually fully suppressed in potential wells above mass scales of order . No dependence on halo mass is instead observed at galaxy masses when considering all groups; however, if we restrict the sample to relaxed groups only (right panel) a decrease in the merger fraction with halo mass is also observed at these high masses. Considering kpc pairs as our reference, we find a variation in the fraction for both galaxy mass bins. Similar slopes, within the errors, are also measured at separations of kpc and kpc (not shown), strengthening the inference of the halo mass being the main driver of the change, with no effects due to the stage at which the mergers are observed.
As discussed in Paper I, the statistical scatter in our group-mass estimates most likely decreases the strength of any measured trend with halo mass; tests performed in Paper I indicate a flattening of a factor of of the slope of the relationship between merger faction and group halo mass (Paper I). Hence, the increase in the merger fraction from high- to low-mass groups is estimated to be intrinsically dex-1.
Given the specifics of our sample, removing the mergers that involve a central galaxy (dotted and dot-dashed lines in Figure 1) affects only the high galaxy mass bin. Because satellite–central mergers make up of the total number of merger occurrences at these masses, the net effect is a strong suppression of the merger fraction at any halo mass. More specifically, at kpc (dot-dashed line) the exclusion of such mergers leaves a flat trend with halo mass. The trend becomes instead positive when considering mergers with all separations (dotted line), owing to the presence of a few massive satellite–satellite mergers in high-mass groups. As discussed above, three such cases occur in unrelaxed groups and the masses of the merging satellites are similar (within the errors) to the masses of the centrals in the same halos. Removing them (by considering only relaxed groups; right panel of the figure) would also produce a flat trend, within errors, of the massive satellite–satellite merger fraction with the host halo mass.
Finally, as a consistency check, we note that measured values for the entire sample of ZENS mergers are consistent with previously reported merger fractions for low-redshift galaxies of similar masses (e.g., Lotz et al., 2010; Bridge et al., 2010). Also, the value that we measure in the high galaxy mass bin at high halo masses is in agreement with the results reported by McIntosh et al. (2008), who studied the properties of high-mass () galaxy pairs with kpc separation in SDSS groups above ; these authors found a merger fraction of 1–3% at a halo mass scale of , consistent with our result.
3.2. Group-centric Distance
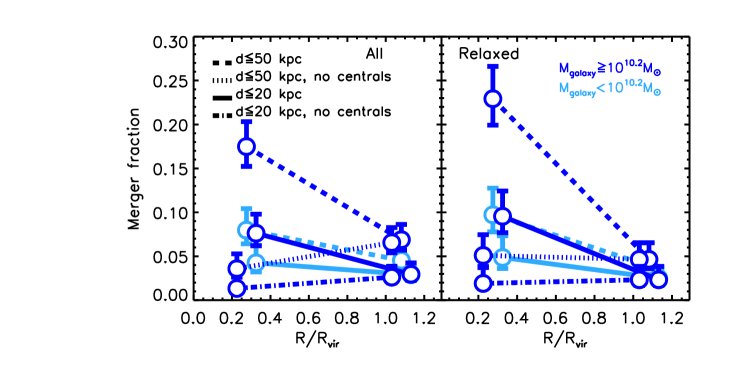
Considering the variation of the merger fraction with distance from the group center in Figure 2, the most striking effect we observe is a strong decrease in moving from the inner () group regions toward the group outskirts, if mergers with are considered. The effect is seen at all separations and at more than the level in the full merger sample, where varies by a factor of 3, from to .
However, remembering what was already discussed in the previous section regarding the frequency of central–satellite mergers at these high galaxy masses, we stress that the increase in merger fraction toward the group centers is largely driven by mergers involving the central galaxy of the given group, which are at by construction. In fact, when systems in which the primary is also a central galaxy are excluded (dotted and dot-dashed lines in Figure 2 ) we do not measure any significant change in with group-centric distance. This highlights the importance of categorizing galaxies according to their rank within their host-group halos, to avoid incorrect interpretations of the observational signals.
As the only marginal effect of the group dynamical state, we mention that in unrelaxed groups the fraction of mergers with kpc formally increases in the group outskirts when centrals are excluded, with a slope of and a significance. One can speculate that the massive satellite–satellite mergers giving rise to this trend have probably just been accreted. Coupled with what was mentioned in the previous section, that their masses are consistent within the errors with that of the nominal central galaxy of their halos, we could identify these mergers as one of the channels that will create the new central galaxy when the group will have relaxed.
In the low galaxy mass bin, which instead includes only satellite galaxies, we measure a variation of with when the entire kpc merger sample is considered (dashed line) suggesting a mild dependence on group-centric distance of satellite–satellite mergers at galaxy masses in the range ; we note, however, that such an effect is not present if we restrict the sample to only mergers with the closest separations.
3.3. LSS Density
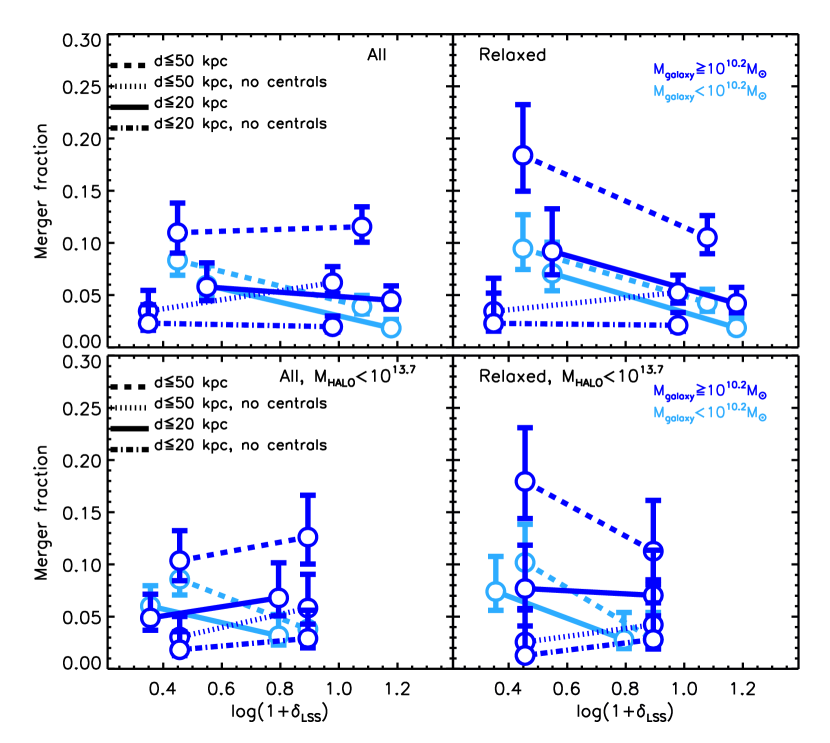
Finally, we investigate in Figure 3 variations of the merger fraction above and below a threshold value of that separates our two bins of low and high LSS density environment. The precise value of 0.7 was chosen to divide the sample of galaxies and mergers in roughly equal numbers while still straddling the transition between high and low LSS densities (see Figure 12 of Paper I).
The upper panels of the Figure present the results with no cut in . In the low galaxy stellar mass bin, we observe a decrease of the merger fraction with increasing LSS density, regardless of the group dynamical state or merger type or separation (taking separations kpc as an example, we measure vs at low and high , respectively). At high galaxy stellar masses, a similar environmental effect is instead observed only if the sample is limited to relaxed groups and if mergers involving a central galaxy are also considered. On the other hand, at these masses no significant trends with LSS density are detected when we consider satellite–satellite mergers only. For both the low-mass mergers and the high-mass (including centrals) mergers, we measure , independent of separation.
These results could however be a consequence of the fact that in our sample and start correlating at halo masses above (see Paper I and the trends with halo mass in Figure 1). It is thus important to test whether they still hold when we further restrict our analysis to groups below , as shown in the lower panels of Figure 3. In this case, for the low galaxy mass bin, the observed relations remain almost unchanged hinting at a genuine LSS environmental effect, although the significance of the variation of in low and high decreases to the level. At galaxy masses , the larger errors and the different trends observed when splitting the sample according to the pair separation make the interpretation of the results not straightforward. We nonetheless note that at these high masses a nominal decrease of the merger fraction with is still also found for relaxed groups with when central–satellites mergers with kpc are considered. We highlight this suggested trend as potentially interesting because it would indicate that regions of low LSS density are more conducive to central–satellite mergers.
4. Physical Properties of Merging Satellites Relative to Equal-Mass Nonmerging Satellites
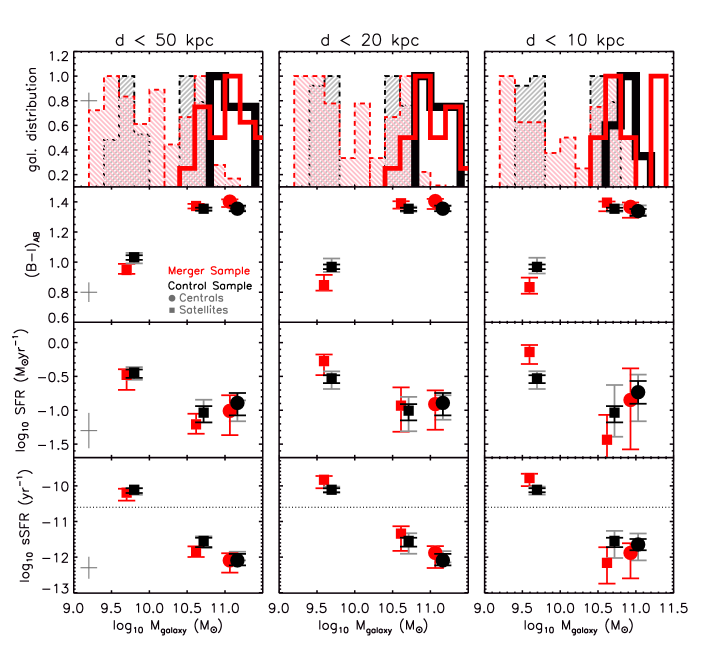
Let us now turn our attention to the star-formation and structural properties of merging galaxies. For reference, we show in Figure 4, top row, the mass distributions of each subsample of merging galaxies and their nonmerging counterparts that we consider in the analysis. In particular, satellites are shown by shaded histograms, whereas centrals are shown with empty thick line histograms. In this section we focus on the comparison of satellite galaxies involved in mergers with similar-mass nonmerging satellites (control sample), and we defer the analysis of the properties of merging central galaxies to Section 5.
We note here that, especially when performing the comparison among satellite galaxies, the control sample can be substantially more numerous than the merging one. Some of the observed differences between the two populations could thus be a consequence of the lower number statistics in the merging galaxies and the much higher accuracy of the derived medians in the control sample. To test how our results would have changed if we had probed the control sample with a smaller number of galaxies, we calculated the dispersions around the control median values, which are obtained by randomly extracting 400 subsamples that are matched in number to the merger sample. We show these dispersions in Figures 4–10 together with the nominal errors derived over the entire sample.
4.1. Integrated Colors
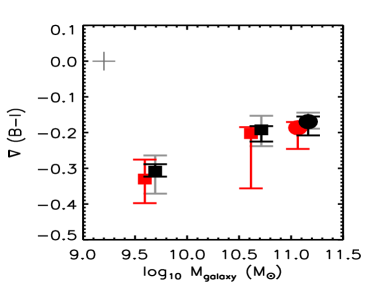
We first investigate the median colors of the merging satellites, which are plotted as red squares in the second row of Figure 4. High-mass merging satellites have colors in the range 1.3–1.5 mag, i.e., as red as those of the nonmerging satellite population of similar galaxy mass, shown with black symbols. The same holds if we restrict the analysis to either mergers with projected separation lower than kpc (see Figure 4, middle column) or to both a projected separation lower than kpc (right column) and to coalesced systems (class 4, not shown).
In the assumption that these red colors are not severely affected by dust reddening and can thus be interpreted with stellar populations models (an assumption that we justify below in Section 4.2, in our analysis of the spectral types and sSFRs of these high-mass systems), such mag colors are well modeled with old stellar populations, produced in relatively fast and metal-rich star-formation episodes, followed by stellar passive evolution (e.g., Gunn & Gott , 1972; Tinsley , 1972; Bower et al., 1992; Peletier et al., 1999; Carollo et al., 2007). Specifically, using Bruzual &, Charlot et al. (2003) synthetic stellar population models with exponentially decreasing star-formation histories and a Chabrier et al. (2003) IMF, typical values for the stellar population of age , star-formation timescale and metallicity are, respectively, Gyr, Gyr, and . An inspection of the spectral types and sSFR of these high galaxy mass merging satellites (discussed in detail in Section 4.2) shows that only in one such system the red color [ 1.4 mag] is due not to passively evolving stellar populations but to dust obscuration of star formation.
Note that, by construction of the ZENS sample, we could have easily seen blue, star-forming mergers; the fact that we do not see them at these galaxy mass scales implies that they are not there in the relatively dense environments probed by ZENS, i.e., galaxy groups with at least five galaxy members and masses above .
In the low galaxy mass bin, as discussed in Section 2.4, we are only mass-complete for star-forming galaxies. This is not a limiting factor when comparing properties of merging satellites with properties on nonmerging satellites of similar masses. Overall, low-mass merging satellites have a median color mag (left column in Figure 4), slightly bluer but consistent within the errors with that of the control sample. However, if we limit the analysis to those mergers with projected separation lower than kpc (Figure 4, middle column), the median color of the low-mass merging satellites decreases with respect to that of the full sample and it is mag bluer than mass-matched nonmerging satellites in the control sample. The color difference further increases if we limit the analysis to even smaller separations (right column in Figure 4) or to coalesced galaxies, which have a median color of 0.65 mag. It is important to note that these results hold if we remove the irregular galaxies (morphology flag ) from the merger sample and/or if we exclude those close pairs that are likely projection effects (merger flag ). Within the family of Bruzual & Charlot models above, assuming a metallicity 0.004–0.008, typical of galaxies at these stellar mass scales (Gallazzi et al., 2005), these low galaxy mass merging satellites are well described by mean ages of Gyr and star-formation timescales of Gyr.
A potential source of concern is that the measured effects may be the outcome of slightly different mass distributions between the merger and control sample, even if their median masses are matched. We therefore performed a further test by randomly extracting control samples that matched in number and mass distribution (and, of course, the satellite status) the merger sample in both the low and the high galaxy mass bin. We generated 400 realizations of control-sample galaxies whose mass distribution had a probability of being drawn from the same distribution of the merger mass distribution according to a Kolmogorov–Smirnov test. For the low-mass bin and in the case of satellites in mergers with kpc projected separation, the mean difference in color (namely ) between the merger sample and these realizations of the control sample is -0.16 mag, never exceeding -0.06 mag in any single realization, thus confirming our results of a median bluer color in merging galaxies. In the case of low-mass coalesced systems, the mean difference in color over 400 realizations is –0.26 mag (and limited between –0.15 and –0.35 mag). Similarly reassuring conclusions apply to the satellites in the high-mass bin, as well as to the centrals (see Section 5).
4.2. SFRs and sSFRs
The availability of (s)SFRs and stellar masses, from fits to the UV-to-NIR SEDs of ZENS galaxies (from Paper III), enables us to get a more precise picture of the origin of the bluer-than-normal colors at low stellar masses and normally red colors of merging satellites relative to nonmerging satellites at high masses.
The third and bottom rows of Figure 4 show the SFR and sSFR versus galaxy stellar mass relations, respectively. In the high galaxy mass bin, consistent with their color discussed above, merging satellites have median SFR and sSFR values typical of quiescent populations (), confirming their nature as red-and-dead systems participating in gas-less ‘dry’ mergers. If anything, they are even marginally ‘more quiescent’ than their control-sample nonmerging relatives. We do not find substantial differences if we consider either the closest (separation kpc, middle and right columns of Figure 4) or the coalesced systems (not shown).
Close ( kpc in projection) merging satellites in the low galaxy mass bin, in contrast, show SFR values slightly below 1 yr-1, and median sSFR 0.7/Gyr which are a factor of 2–3 enhanced above the median rates of the control sample of nonmerging satellites at similar galaxy masses. The difference becomes even more significant if one limits the sample to pairs closer than kpc in projection (right panel). Similar values are obtained if we limit the analysis to coalesced mergers only.
As before, we performed a further test by randomly extracting control samples that matched in number and mass distribution (and, of course, the central versus satellite status) the merger sample in both the low- and the high-mass bin. In the low-mass bin and in the case of satellites in mergers with kpc projected separation, the mean difference in SFR over these realizations is 0.38 dex, never becoming lower than +0.12 dex, thus confirming our results.
The bluer colors of low-mass merging satellites relative to nonmerging satellites of similar mass presented in Section 4.1 are thus indicative of a merger-triggered enhancement of their SFRs, occurring only when the separation between the two galaxies is relatively small. The corresponding mass doubling timescales are about Gyr, i.e., a factor 3–5 longer than merging timescales inferred from simulations (e.g., Cox et al., 2006; Kitzbichler & White , 2008).
4.3. Color Gradients
Having established that close mergers induce a blueing of the low-mass galaxies, it is interesting to see if the induced star formation is a burst in the center of the galaxies or if it is distributed throughout the galaxy and if it results in distinct color profiles with respect to the noninteracting galaxy sample. For a quantitative analysis, we make use of the radial color gradients derived from the analytical fits of the galaxy light profiles (Paper II) and we compare in Figure 5 the gradients for kpc mergers with those in the control sample.
We do not find any significant difference between the color profiles of satellite galaxies involved in close mergers and those in the control sample. In absolute terms, in high-mass merging galaxies only negative color gradients are found. At low masses, where merging satellites are bluer than the control sample, only a small fraction (10%) of our merger sample shows inverted color gradients, i.e., blue cores, indicative of centrally concentrated star formation, relative to redder galaxy outskirts. Another 15% of the low-mass merging systems has instead rather flat (i.e., mag) color gradients, suggesting that the merger-induced star formation affects the whole system (see also Knapen & James , 2009). We do not find, however, a correlation between the amount of induced star formation (or the size) and the presence of an inverted or flatter gradient.
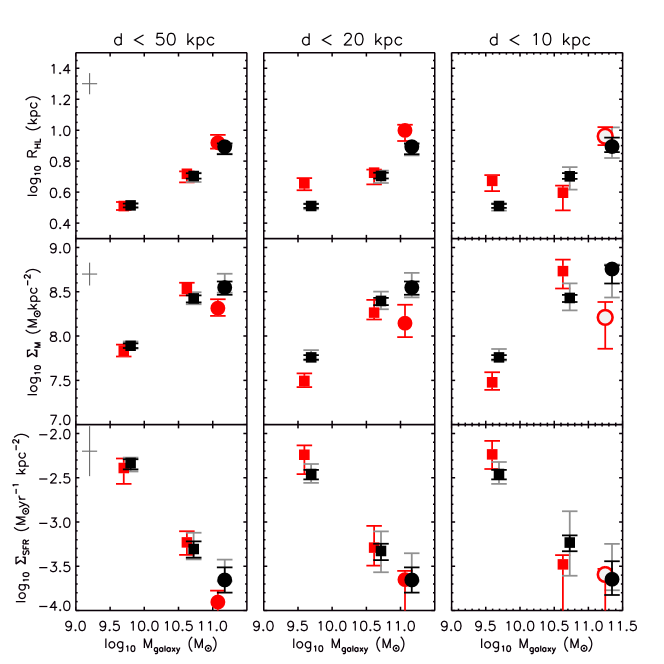
4.4. Sizes, Stellar Mass and SFR surface densities
In order to infer the presence of any merger-induced structural perturbations and check whether merging satellites may sustain higher local SFRs, we also compare in Figure 6 the -band half-light radii from analytical single Sérsic fits (top panel), the stellar mass surface densities (middle panel) and the surface star-formation densities (bottom panel) of merging satellites with the control sample of nonmerging satellites of matched stellar masses 444It was not possible to obtain reliable measurements of the radii for 12 merging galaxies. They are therefore not included in any panel of Figure 6..
In the high galaxy mass bin, merging satellites with kpc have sizes (kpc) and surface mass densities (kpc-2) that are comparable to those of nonmerging satellites of similar mass. An inversion of the Schmidt (1959) law using Kennicutt (1998) and the measured median value result in a median gas-to-stars ratio in these galaxies (see also Ellison et al., 2010).
In the low galaxy mass bin, structural differences between (star-forming) merger galaxies and the control sample are only visible for the closest or coalescing systems (middle and right panels of Figure 6, respectively), which are typically times larger than their nonmerging counterparts. With a typical (median) kpc-2, these low-mass merging satellites have a factor of lower surface mass densities than nonmerging satellites of similar stellar mass. For them, the inferred median gas-to-stars ratio is , to be compared with the value inferred for the nonmerging satellite population at these galaxy masses. It is remarkable, however, that in such low-mass merging satellites, their larger sizes and enhanced sSFRs compensate for each other to result in similar median surface star-formation densities ( yr-1 kpc-2) in both merging and control samples.
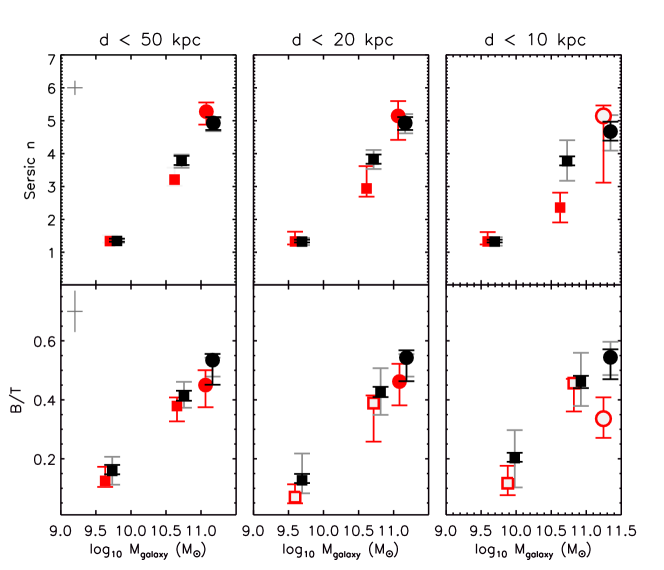
4.5. Morphologies
It is now interesting to see whether the changes in the star-formation properties we discussed in the previous sections are followed by significant morphological transformations. We quantify galaxy morphology in terms of the global Sérsic index and bulge-to-total ratio B/T in Figure 7.
We find low -band Sérsic indices in low mass galaxies involved in mergers irrespective of the separation. More quantitatively, and considering the sample of mergers with kpc separation, the median Sérsic index in merging satellites is (1.26–1.63 are the 16th and 84th percentiles, respectively). The median value for the control sample is 1.32, hence showing no difference to be associated to the mergers. At higher galaxy masses, the Sérsic indices increase in both the mergers and the control sample, again showing no significant differences for separations kpc. The closest ( kpc) merging satellites have instead significantly lower Sérsic indices than the control sample. However, there is no Sérsic index determination available in the parent ZENS catalog for five of 11555In the low-mass bin, the Sérsic index is available for 23 of 25 of the merging galaxies with kpc. of the merging galaxies. Therefore, the suggested trend should be confirmed with larger samples.
Likewise, no differences are found for the -band bulge-to-total ratios666Available in the parent catalog only for systems where the bulge/disk decomposition could be performed and that are not best fit by an elliptical morphology. (see Figure 7, bottom panel) at all galaxy masses and separations: we measure a median value of 0.1 in low-mass merging satellites and of in high-mass ones, in agreement with the median values for the control sample. This consistency is also reflected in the morphological mix of noninteracting and merging galaxies. Under the reasonable assumption that incompleteness in the sample of (mostly quiescent) early-type777Morphological classes 1 and 2; see Paper II. galaxies affects equally the merging and the control sample, for the low-mass bin we estimate that the fraction of early-type satellites involved in all mergers is 10/81, which is very close to the 13% featured by the control sample. Similarly, at high galaxy masses where the sample is complete, the fraction of early-type bulge-dominated systems is 11/49, which is 22% as in the control sample.
In conclusion, we do not find any significant structural difference that might be induced by the merger process even at the low galaxy mass scale and smallest separations, where we instead observe an enhancement of the SFR and larger radii in the merging population.
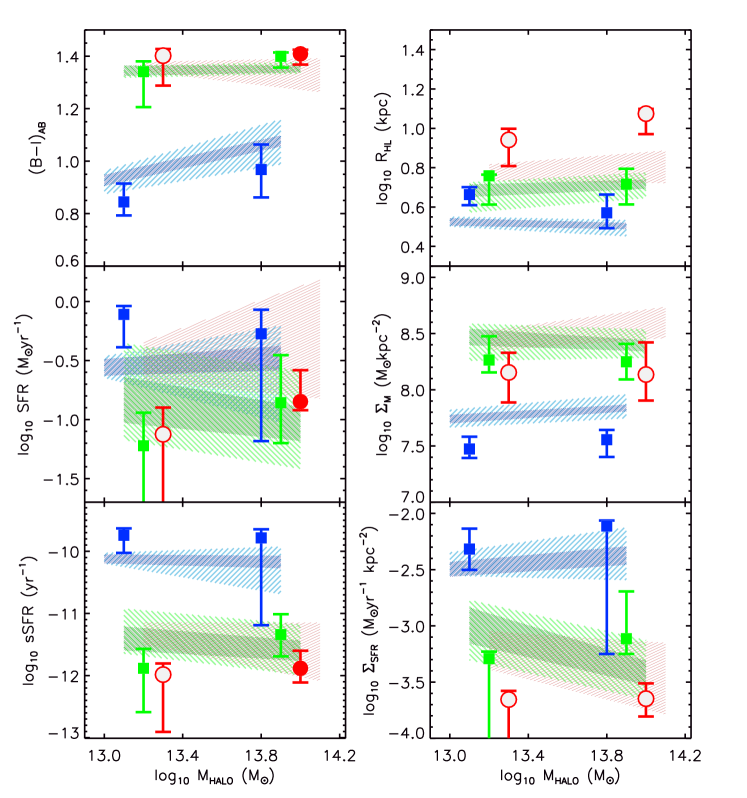
4.6. Environmental Effects
In the spirit of ZENS, we now investigate if any of the merger-induced changes in the stellar properties and their trends with galaxy mass can be ascribed to or enhanced by a particular environment. For this analysis, we limit the discussion to mergers with projected separation kpc, where the merger-induced variations in colors, radii and SFRs become significant.
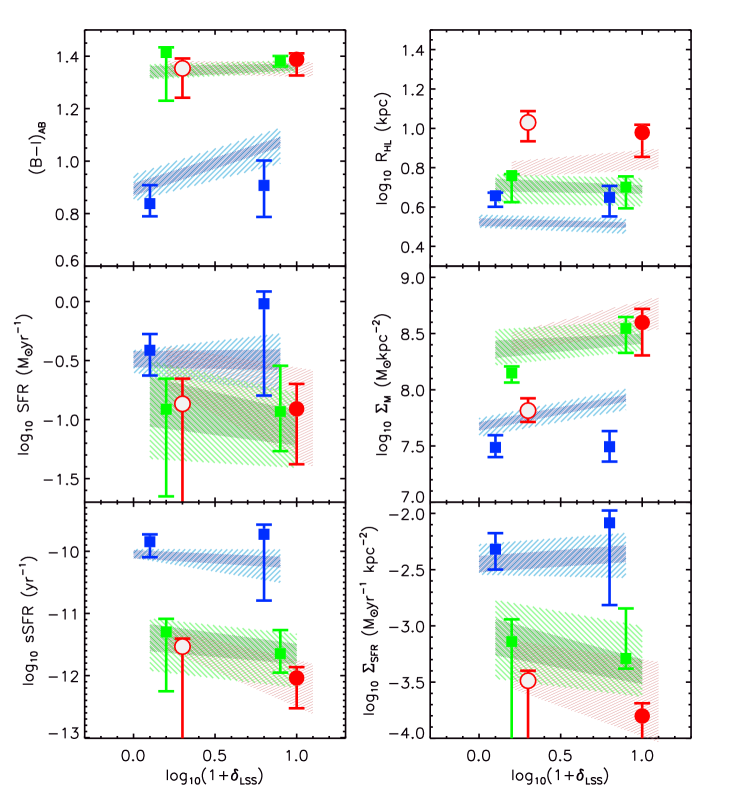
The environmental trends are highlighted in Figs. 8-10 where we compare galaxies in mergers with control samples that are additionally drawn from the same (dense versus sparse) environments. In Figure 8 we focus on the role of , whereas in Figure 9 we split both merging and control samples into group-centric regions. Obviously, centrals have by construction hence they are not consider in this case. Finally, Figure 10 compares mergers and control samples at fixed LSS overdensities. In these figures, low-mass merging satellites are shown with blue dots and their control sample as a blue shaded area. Higher mass satellites are in green, and centrals are in red.
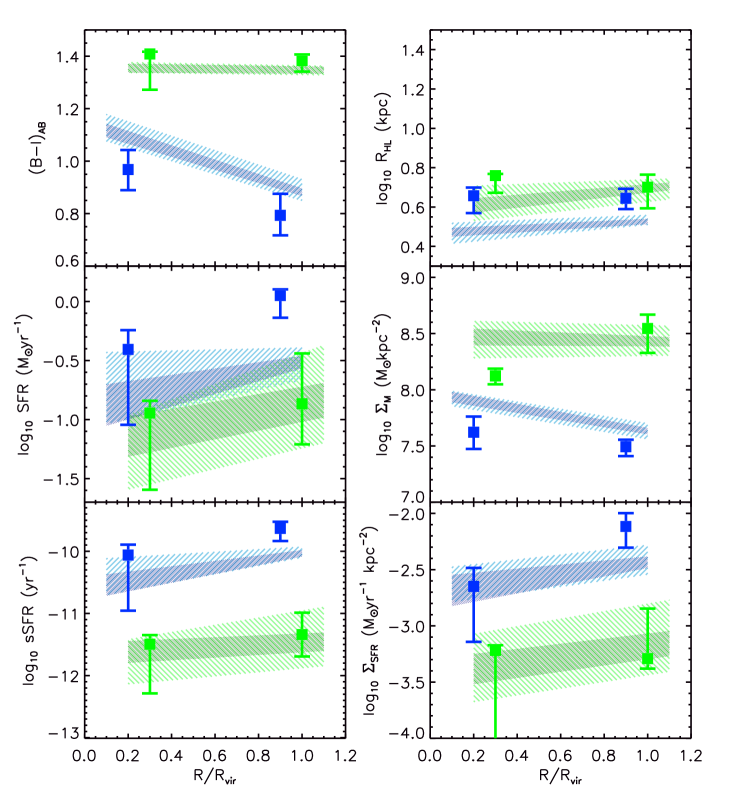
Within a fixed environmental bin, the results presented in the previous sections on the merging and control-sample satellites remain qualitatively unchanged, and we will therefore not repeat the discussion. We instead comment in the following on differential effects in the merger and control samples across the environmental bins; this may help us to understand the role of the environment in the transformations triggered by the merger event.
First, although we do not show this explicitly in a figure, we find that if we limit the analysis to relaxed groups the merger-induced enhancement in the SFR for systems with separation kpc disappears because of a decrease in the median SFR of the mergers (as opposed to an increase in the median SFR of the control sample). In other words, a substantial fraction of the low-mass satellites in mergers with the highest SFRs are those in groups that are not yet relaxed. In contrast, low-mass satellites in mergers with low () SFR are mostly in relaxed systems. We also mention the fact that the difference in radius at low galaxy masses becomes insignificant when the study is limited to mergers (and galaxies in the control sample) in relaxed groups.
Second, the merger-induced variations in galaxy properties are present even if the given galaxy properties have themselves an environmental dependence. For instance, the median color of low-mass galaxies becomes bluer at lower halo masses and outer group radii (see Figure 8 and 9 and also Paper III). The relative change in the color with environment for the low mass merging satellites and the control sample is however of a similar amount, keeping the merger-induced bluening almost constant with environment. Therefore, turning the argument around, we demonstrate that the effect of mergers is to induce a mag blueing of the color irrespective of environment (within the errors) at low galaxy masses. This is a clear example that highlights the need for comparing merging galaxies and control samples at fixed mass and environment in order to isolate the effect of mergers on galaxy properties.
Third, for low-mass merging satellites, the enhancement in the SFR becomes more significant in the group outer regions. Although the radial trend is partly due to the fact that the low-mass nonmerging satellites are preferentially located at large radii rather than in the group cores thus reducing the scatter (i.e., the width of the shaded area) around the median SFR in the former regions, our data suggest that the strength of the merger-induced star-formation episode may change with environment. We checked, by generating random control subsamples matching in mass distribution and number of galaxies those involved in mergers in a given environmental bin, that any little difference in the mass distributions of both the merger and the control sample in the low galaxy mass bin did not contribute to the signal.
In conclusion, we are able to order the different environmental indicators by importance in setting the star-formation properties of the merging system: the most important indicator is the proximity to the companion, then the status (relaxed or unrelaxed) of the host group and finally the position within the halo.
5. Physical Properties of Merging Centrals Relative to Equal-Mass Nonmerging Centrals
We now focus on the properties of merging central galaxies with an analysis similar to that done for satellite galaxies. As highlighted in Section 2.4, this analysis of centrals is limited to the high galaxy mass bin, and is conducted at a median galaxy stellar mass of .
At these galaxy masses, merging central galaxies have red colors ( mag) similar to the control-sample nonmerging centrals of comparable masses, reflecting the fact that the high-mass centrals of our sample are mostly passively evolving systems, whether they are in a merger or not (middle and bottom panels of Figure 4). There are exceptions, however. Among mergers involving central galaxies, our sample includes: one system with a high SFR yr-1 in the secondary galaxy, i.e., at face value, a merger-induced burst in which a high SFR is triggered in the least massive galaxy; and two systems in which a highly enhanced SFR is observed, relative to the comparison nonmerging population, in the primary central galaxy (SFR yr-1).
Moreover, we note that high-mass secondaries (which are by definition satellite galaxies) that are members of merging pairs are as red as their primaries: the median color difference between primary central galaxies and high-mass secondary satellite galaxies involved in the merging pairs is always mag (Figure 4). This is a straightforward consequence of the fact that both primary central galaxy and secondary satellite companion galaxies have stellar masses in the regime where passive bulge-dominated galaxies dominate the global galaxy population at . Following a similar reasoning as in Section 4.4, the accreting primary (central) galaxy of the merging pair must have a very low gas-to-star fraction on average, motivating our classification of these mergers as dry in the discussion.
One-half of the centrals have companions in the lower galaxy mass bin. As a consequence of the stellar mass difference, these secondaries are bluer (by mag, median difference) than the primaries but their colors ( mag, median value) and SFRs ( yr-1, median value) are consistent with those of their control sample. The median SFR in the centrals of such pairs are also low ( yr-1). Therefore these pairs would also result in relatively ‘dry’ mergers.
A structural comparison of central galaxies involved in a merger with nonmerging central galaxies returns a marginally significant result in the direction of larger half-light radii in merging centrals by a factor of in kpc pairs. This would formally yield surface mass densities in merging centrals about 0.3 dex lower on average than those in control sample centrals. With respect to the other properties considered here, merging centrals have negative color gradients and equally high Sérsic indices (, Figure 6, top panel) and bulge-to-total ratios (B/T=, see Figure 6) as in the control sample.
As is clear from Figs. 8 and 10, the environment (including the relaxed or unrelaxed status of the host group) does not strongly affect the stellar or structural properties of central galaxies involved in mergers. The only suggested environmental effect is an increase in the difference between the half-light radii of merging and noninteracting centrals with halo mass/LSS density, in the sense that merging centrals appear more noticeably extended than the control sample when located in a massive group or low . The number of ZENS central galaxies in these bins is however small (), and the observed trends should be confirmed with larger samples.
6. Discussion
6.1. How Do Mergers Affect the Properties of Galaxies in Groups?
As highlighted in Sections 4.2 and 5, high galaxy mass mergers involving galaxies, whether centrals or satellites, are consistent with being mostly gas-depleted dry mergers. The result is not surprising in light of the environment-independent quenching of star formation in galaxies at these high masses (e.g., Peng et al., 2010), and it extends the findings of McIntosh et al. (2008) to lower halo masses. Evidence for merger-induced structural changes in these quenched galaxies is minimal. A dry merger will lead to an increase in size of the coalesced remnant central galaxy, while roughly preserving its nuclear stellar velocity dispersion (e.g., Ciotti et al., 2007). This may lead to larger sizes in the central galaxy population than in the corresponding satellite population of similar galaxy stellar mass or velocity dispersion. This is convincingly observed in the galaxy size versus mass and galaxy size versus velocity dispersion relations for the brightest cluster members and satellite galaxies in galaxy clusters (e.g., Bernardi et al., 2011). Furthermore, although the observed size evolution of early-type galaxies can be largely explained by the appearance of newly quenched, extended galaxies with cosmic time, some degree of size growth for individual galaxies is expected at the highest masses (see Carollo et al. 2013a for a discussion on both effects). Mergers of massive central galaxies with quenched a satellite, like those observed in our high-mass sample, could be a potential channel for size variations in these individual objects.
At low galaxy masses, there is plenty of merging activity among star-forming satellites.888We remind readers that we do not attempt a study of passive mergers at these low galaxy masses because our sample is not complete for such systems below and that only satellites populate the ZENS groups at these galaxy mass scales. Moreover, at variance with the high-mass case, the low-mass mergers can induce star formation and merging satellites below exhibit a factor of enhancement in SFRs and sSFRs relative to their nonmerging counterparts. Noticeably, the fact that such an effect is evident only at low separations (20kpc) reinforces the notion that mergers in their final stages profoundly alter the behavior of galaxies, in the very least in terms of boosting their rate of consumption of their gas reservoirs (see also, e.g., Larson & Tinsley , 1978; Kennicutt et al., 1987; Lambas et al., 2003; Sol Alonso et al., 2006; Woods & Geller , 2007; Di Matteo et al., 2008; Kampczyk et al., 2013). In particular, simulations show that any enhancement in the SFR generally occurs either at the first pericenter or at the coalescence, depending on the orbit configuration (e.g., Di Matteo et al., 2007) and if both the eccentricity and the impact parameter are high, there might be an intermediate phase during which the star formation is suppressed (Patton et al., 2013).
Large catalogs of simulated mergers show that the strongest bursts happen in a minority (15%) of the cases and are short lived, whereas 76% of fly-bys and 50% of mergers display an integrated SFR only 1.25 larger than that of isolated galaxies (Di Matteo et al. 2007, 2008, see also Woods et al. 2010; Patton et al. 2013). This is consistent with our findings. The predicted star-formation enhancement in these simulations is comparable during fly-bys and coalescence, justifying a posteriori our choice to discuss mergers at coalescence and those in very close pairs at the same time. Numerical simulations further show that such mergers often stop gas accretion onto the coalesced remnant (Feldmann, Carollo & Mayer , 2011). As mentioned in Section 4.2, however, the Gyr mass-doubling timescales of merging satellites in our sample imply that these systems will possibly reach an undisturbed appearance in the coalesced remnant well before their current gas reservoir is exhausted. This is potentially interesting in light of the results in Carollo et al. (2014), where we discuss the possibility that quenching may not significantly alter the structural properties of galaxies, which are instead set prior to star-formation cessation, and find that the increase in the median B/T of quenched satellite galaxies with respect to star-forming ones can be explained by fading of the disks following quenching.
Despite the boost in sSFR induced by the merger event, the rate of surface star formation per kpc2 remains similar at the yr-1kpc-2 level, both for merging and nonmerging low-mass satellites, on account of their different sizes (i.e., 50 larger in the interacting satellites). These may indicate that feedback is strong enough that it prevents star formation from concentrating in the central galactic regions, leading to an increase in measured galaxy sizes relative to the progenitors (e.g., Hopkins et al. , 2008). Moreover, a more diffuse distribution of star formation seems to emerge in simulations with a sufficient physical resolution to better reproduce the real distribution of star formation within galaxies (e.g., Teyssier et al. , 2010). Similar evidence for a reduced gas flow toward the galaxy cores during interactions (relative to earlier pioneering experiments, e.g., Mihos & Hernquist 1994) is also found in other recent simulations (Cox et al., 2008; Di Matteo et al., 2007), which indicate that feedback is most likely responsible for preventing gas from flowing to the center and feeding a centrally concentrated burst (see also Hopkins et al., 2013; Newton & Kay , 2013). Our data offer global support for this scenario.
6.2. Which of the Different Environments Leads to Galaxy Mergers?
From an environmental perspective, our data suggest two main factors that either preferentially induce or preferably enable galaxy mergers: either galaxies inhabit the relatively small potential wells of low-mass group halos (see Figure 1) or they lie at the bottom of the potential wells of their host groups, i.e., they are central galaxies (see Figure 2 and the discussion in Section 3.2).
The fact that, at any galactic mass in our study, galaxy mergers are favored at low halo masses is consistent with the expectation based on simple dynamical friction timescale arguments of satellites falling into groups (Chandrasekhar , 1943; Binney & Tremaine , 1987), as well as with analytical estimates that take into account the merger cross section for direct mergers (e.g., Mamon , 1992, 2000; Makino & Hut , 1997). That is potentials with relatively low velocity dispersions are more conducive to galaxy–galaxy interactions than more massive, higher velocities halos (see also Perez et al. , 2009; McIntosh et al., 2008; Heiderman et al., 2009; Tal et al., 2009). Halo-occupation models further support this interpretation by showing that the merger efficiency (i.e., the merger timescale relative to the Hubble time) is about an order of magnitude higher at halo masses than in massive halos with (Hopkins et al. , 2008).
These overall trends discussed when showing Figure 1 aggregate both mergers onto the central and satellite–satellite mergers. At high galaxy masses, from Figure 1 we can infer that the biggest contribution to the slope comes from mergers involving central galaxies. This is further highlighted in Figure 11, where we present once again our results on the merger fraction as a function of for relaxed groups, this time considering separately mergers with a central as the primary galaxy (left panel) and mergers with a satellite as the primary galaxy (right panel). The slope stays almost constant with pair separation around a value of . Such a value for the slope can be qualitatively understood in terms of the merger rate scaling as the inverse of the group velocity dispersion to the third power (e.g., Mamon , 2000), further considering that this latter quantity scales as (e.g., Bryan & Norman, 1998), and finally taking into account that the merger timescale (necessary to convert the merger rate into fractions) seems to be independent of the halo mass (Kitzbichler & White , 2008).
At high galaxy masses, the predominance of central–satellite mergers in our sample is also in very good agreement with previous studies based on independent samples. For example, in their SDSS sample of galaxies, McIntosh et al. (2008) find that at least half of their merger events involve a central–satellite systems. The increase in the merger rate with decreasing group-centric distance is expected in analytical estimates (e.g., Mamon , 2000). Moreover, the important role of mergers in building up the central galaxies of groups is well documented in numerical simulations (e.g., Feldmann et al., 2010; Feldmann, Carollo & Mayer , 2011), and is supported by observations at both similar (Tal et al., 2009; Rasmussen et al., 2010) and earlier epochs (e.g., Rines et al. , 2007; Tran et al., 2008; Lin et al., 2010) as that of the ZENS sample.
Finally, we note that the mild increase in the merger fraction of low galaxy mass satellites in regions of low (relative to high) LSS density is also found in other data sets (see, e.g., Ellison et al., 2010). This would also be supported by the predictions of the Guo et al. (2011) semianalytical model that show a decrease (9% 6%) in the merger fraction as the density increases, in agreement within the errors with the ZENS data.
6.3. Comparison with Semianalytical Models
In order to make a more quantitative comparison with theoretical expectations, we made use of the publicly available999Available at http://gavo.mpa-garching.mpg.de/Millennium/ (Lemson et al., 2006). data from the Guo et al. (2011) semianalytical model. In brief, the model follows the dynamics of the subhaloes hosting the satellite galaxies until their dark matter content exceeds their baryonic mass, switching a merger clock based on the estimated dynamical friction timescale afterward. By construction, satellite galaxies merge with the central of their halo. Groups fulfilling the ZENS specifics in terms of redshift, masses, number of members and magnitude of the galaxies were selected from a snapshot of the simulation box that was projected onto one of its axes in order to define the projected LSS density exactly as in Paper I and to compute projected distances among galaxies. Mergers were then identified according to the projected separation and velocities , as in the empirical sample.
The dark red lines in Figure 11 show the predictions from Guo et al. (2011) for the merger fraction versus relation. As shown in the left panel, by selecting 20 kpc (50 kpc) pairs involving central galaxies, we estimate in the models a merger fraction of 6% (17%) at low and 2% (5%) at higher group mass, respectively. The predicted variation of the merger fraction with halo mass for mergers involving a central is in excellent agreement with our findings at small separations. When selecting 50 kpc pairs, the model predicts instead a steeper slope than the observed one, but still in agreement within the errors.
Because in the Guo et al. (2011) model the satellite mergers are computed on the basis of the dynamical friction formulae, in light of what was discussed at the outset of this section, it is not surprising that the simulation broadly matches the observed trend with halo mass. It is, however, remarkable the agreement in the normalization, namely in the actual merger fractions. Given this consistency with observations for the merger fraction in groups of different halo masses, we can use the model predictions to estimate that 1/6 (1/2) of the central–satellite mergers at low (high) halo masses and d20 kpc in ZENS will coalesce in less than 300Myr, whereas the remainder of the systems will take 1Gyr.
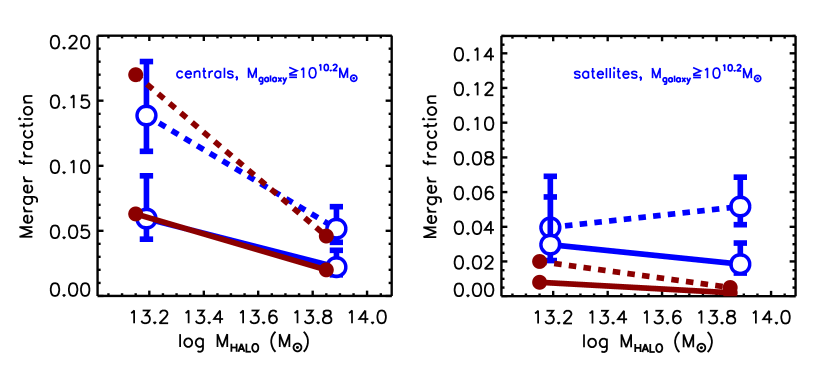
The right panel of Figure 11 shows that mergers involving only high-mass satellite as primaries are instead significantly underestimated in the model with respect to our measure for relaxed groups. In the Guo et al. (2011) semianalytical model, real satellite–satellite mergers are in general extremely rare, with a fraction lower than 0.1% that is well below our measured fraction. In the model, these mergers involve a central of a halo that has been accreted and still is a cooling site. Similarly rare are satellite–satellite mergers fraction in other semianalytical models (e.g., Pipino et al., 2009).
There are two possible interpretations of these findings. The first is that these models miss a key ingredient, namely satellite–satellite merging, which, if happening in nature (as indicated by our data), would be an important channel through which environment operates on galaxies. Another possibility is, however, that our results are affected by projection effects, which increase the number of close satellite–satellite pairs. To disentangle between these alternatives, we estimate the fraction of close ( kpc) low-mass satellite–satellite pairs that are sufficiently distant from their central galaxy to avoid satellite–central mergers; we thus set a threshold distance of 50 kpc between the satellite–satellite pair and the central galaxy. In the models, the fraction of such systems that we find in low and high groups is respectively % and %. These fractions are well below our estimated fractions in the ZENS sample (see Figure 1), and they provide support for the interpretation that only a small fraction of our detected satellite–satellite mergers are due to projection effects that lead to galaxy closeness or even superposition.
Dark matter simulations also provide support in the same direction. Angulo et al. (2009) show that satellite–satellite mergers occur in a CDM universe and become increasingly more frequent with decreasing subhalo versus main-halo mass ratio. These authors interpret this result as being due to mergers of progenitor satellites that are members of a subhalo that is in the process of being accreted by a larger halo.
We finally also use the models to estimate whether spurious galaxy superpositions may have led us to overestimated the central–satellite merger fractions. To this purpose we compute in the ZENS sample the fraction of non-member galaxies which lie at a projected distance kpc from the central of a given group. We compare this fraction with the population of galaxies in the simulation cube that lie within a 20 Mpc thick slice centered on the given group, which have a velocity difference and projected distance relative to the central galaxy of that group. This returns a probability of a random projection at all group masses under study. We therefore also conclude that the central–satellite merger fractions that we have estimated from our sample are not severely affected by superposition effects.
6.4. An Empirical View of the Effects of Mergers on Galaxy Evolution
In contrast to the above-mentioned complex galaxy formation simulations, a simple yet successful empirical picture of galaxy formation has been recently presented to explain the role of galaxy mass and environment in the evolution of the mass function of both active and passive galaxies (Peng et al., 2010).
This scenario explains the evolution of galaxies as a population driven by the cosmic run of the sSFR and its interplay with both internally and environmentally induced quenching rates. For what concerns our paper, it is useful to remind that in the Peng et al. (2010) framework, mergers are proportionally more important for the growth of massive galaxies than at lower galaxy masses, and that the merger fraction is about a factor of four higher in the densest regions (which in their definition roughly corresponds to the inner group regions, Peng et al. 2012) than in the less dense environment. Massive galaxies, however, have already been mass quenched. Therefore, the mergers involving massive galaxies are dry and the fraction of passive galaxies undergoing subsequent dry mergers quickly increases at masses above .
This is consistent with ZENS data where: (1) the median mass of centrals involved in high mass mergers exceeds ; (2) their colors are as red as galaxies in the control sample at the same mass, and (3) a strong radial dependence of the merger fraction linked to the growth of the centrals (e.g., Figure 2) is found. In addition, we find that the star formation is generally not enhanced in low-mass satellites merging with centrals.
Taking into account the mass ratios of the pairs in our sample, we expect that the increase in mass caused by these dry mergers will be between 15% (median contribution of low-mass secondaries) and 38% (median contribution if the secondary is in the high galaxy mass bin). A quantitatively similar average increase in mass is also expected by Peng et al. (2010) considering the constraints given by the galaxy mass function evolution. Therefore, our data offer to the broad picture of galaxy formation a quantitative estimate of the typical growth of central galaxies in the group environment.
7. Summary and concluding remarks
We have utilized the sample of ZENS galaxies with (1274 galaxies) and its 162 identified merging or close pairs systems to investigate: the dependence of the merger fraction on three different measurements of environment, i.e., halo mass, group-centric distance, and LSS density; and the internal properties of merging satellite and central galaxies in comparison with galaxies of a control sample having similar stellar masses, rank within the host group potentials, and environment. Our main findings are as follows:
-
1.
In relaxed groups and at any galaxy mass scale in the range – 10, an enhancement in by a factor of is observed in groups with masses relative to higher mass groups. The sharp drop in at halo masses suggests that merger activity is effectively suppressed by the large galaxy velocities sustained in high mass halos. In the case of relaxed groups, we infer a variation in the merger fraction dex-1, which is almost independent on galaxy mass and merger stage.
-
2.
A similar increase in the merger fraction at low LSS densities () is seen in our data at the level for low-mass pairs or high-mass mergers involving a central galaxy. We find that it holds at the level if we restrict the analysis to groups with and hence it is not caused by an underlying correlation between halo mass and overdensity. This interesting suggested effect is thus a possible indication of the influence of the LSS density on low-mass mergers and central–satellites interactions which should be further investigated with larger data sets.
-
3.
Most mergers that we observe in our sample at galaxy masses are central–satellite, gas-depleted dry mergers (see also, e.g., Edwards & Patton , 2012). These high-mass dry mergers occur preferentially in relaxed groups, and support numerical experiments indicating a substantial role of mergers in the mass assembly histories of the central galaxies of group halos (e.g., De Lucia & Blaizot , 2007).
-
4.
The high frequency of central–satellite mergers at high galaxy masses results in a nominal increase of in the inner, group regions; this highlights the need to accurately disentangle the galaxy populations of groups/clusters into centrals and satellites, in order to properly interpret any observational trend in galaxy properties with group or cluster-centric distance.
-
5.
At low galaxy masses of , where in ZENS we are only probing satellite galaxies, we find evidence of merger-induced star formation in the gas-rich (satellite–satellite) mergers. The relevant environments in determining the amount of induced star formation are, in decreasing order of importance, the proximity to the companion, the status (relaxed/unrelaxed) of the host group, and to a minor extent the position within the halo. In particular, the low-mass satellite–satellite mergers have (specific) SFRs enhanced by a factor of relative to their nonmerging counterparts when we consider either coalesced or very close ( kpc) systems. Furthermore, a substantial fraction of the low-mass satellites in mergers with the highest SFR are those in groups that are not yet relaxed, whereas low-mass satellites in mergers with low () SFR are mostly in relaxed systems.
-
6.
From the analysis of the color maps and the comparison of the color gradients of merging galaxies to those of the control sample, it appears that these boosted star-formation activities are mostly distributed over the whole galaxy body, rather than being concentrated in a nuclear ‘burst’ of star formation. The most recent numerical simulations also correct earlier claims for a merger-driven nuclear enhancement of star formation and ascribe to stellar feedback the diffusion of the star-formation activity throughout the extent of the galaxy (Cox et al., 2008). This may also explain the larger sizes (implying 2–3 lower surface mass densities) of these low-mass merging satellites relative to nonmerging satellites of similar mass.
-
7.
The mass doubling timescales for low-mass satellite–satellite mergers is 2–3 Gyr, a factor of times shorter than that of similar nonmerging galaxies, but it remains nevertheless a factor of longer than numerically estimated merging timescales for these systems (Cox et al., 2006).
acknowledgments
We acknowledge the support from the Swiss National Science Foundation. This publication makes use of data from ESO Large Program 177.A-0680. We also use data products from the Two Micron All Sky Survey, which is a joint project of the University of Massachusetts and the Infrared Processing and Analysis Center/California Institute of Technology, funded by the National Aeronautics and Space Administration and the National Science Foundation. This research has made use of the NASA/IPAC Extragalactic Database (NED) which is operated by the Jet Propulsion Laboratory, California Institute of Technology, under contract with the National Aeronautics and Space Administration. The Millennium Simulation databases used in this paper and the web application providing online access to them were constructed as part of the activities of the German Astrophysical Virtual Observatory (GAVO). A.P. thanks P. Di Matteo for useful comments on numerical simulations.
References
- Alonso et al. (2004) Alonso, M. S., Tissera, P. B., Coldwell, G., & Lambas, D. G. 2004, MNRAS, 352, 1081
- Angulo et al. (2009) Angulo, R. E., Lacey, C. G., Baugh, C. M., & Frenk, C. S. 2009, MNRAS, 399. 983
- Baldry et al. (2006) Baldry, I. K., Balogh, M. L., Bower, R. G., et al. 2006, MNRAS, 373, 469
- Balogh et al. (1999) Balogh, M. L., Morris, S. L., Yee, H. K. C., Carlberg, R. G., & Ellingson, E. 1999, ApJ, 527, 54
- Barnes (2004) Barnes, J.E., 2004, MNRAS, 350, 798
- Barton et al. (2007) Barton, E. J., Arnold, J. A., Zentner, A. R., Bullock, J. S., & Wechsler, R. H. 2007, ApJ, 671, 1538
- Barton et al. (2000) Barton, E. J., Geller, M. J., & Kenyon, S. J. 2000, ApJ, 530, 660
- Bernardi et al. (2011) Bernardi, M., Roche, N., Shankar, F., & Sheth, R. K. 2011, MNRAS, 412, 6
- Binney & Tremaine (1987) Binney, J., & Tremaine, S. 1987, Galactic Dynamics (Princeton: Princeton Univ. Press)
- Bower et al. (1992) Bower, R. G., Lucey, J. R., & Ellis, R. S. 1992, MNRAS, 254, 589
- Bridge et al. (2010) Bridge, C. R., Carlberg, R. G., & Sullivan, M. 2010, ApJ, 709, 1067
- Brinchmann et al. (2004) Brinchmann, J., Charlot, S., White, S. D. M., et al. 2004, MNRAS, 351, 1151
- Bruzual &, Charlot et al. (2003) Bruzual, G. &, Charlot, S. 2003, MNRAS, 344, 1000
- Bryan & Norman (1998) Bryan, G. L., & Norman, M. L. 1998, ApJ, 495, 80
- Cameron (2011) Cameron, E. 2011, PASA, 28, 128
- Carollo et al. (1997) Carollo, C. M., Stiavelli, M., de Zeeuw, P. T., & Mack, J. 1997, AJ, 114, 2366
- Carollo (1999) Carollo, C. M. 1999, ApJ, 523, 566
- Carollo et al. (2007) Carollo, C. M., Scarlata, C., Stiavelli, M., Wyse, R. F. G., & Mayer, L. 2007, ApJ, 658, 960
- Carollo et al. (2013a) Carollo, C. M., Bschorr, T. J., Renzini, A., et al. 2013a, ApJ, 773, 112
- Carollo et al. (2013b) Carollo, C. M., Cibinel, A., Lilly, S. J., et al. 2013b, ApJ, 776, 71 (Paper I)
- Carollo et al. (2014) Carollo, C. M., Cibinel, A., Lilly, S. J., et al. 2014, arxiv:1402.1172
- Chabrier et al. (2003) Chabrier, G. 2003, ApJ, 586, 133
- Chandrasekhar (1943) Chandrasekhar, S. 1943, ApJ, 97, 255
- Cibinel et al. (2013a) Cibinel A., Carollo, C. M., Lilly, S. J., et al. 2013a, ApJ, 776, 72 (Paper II)
- Cibinel et al. (2013b) Cibinel A., Carollo, C. M., Lilly, S. J., et al. 2013b ApJ, 777, 116 (Paper III)
- Ciotti et al. (2007) Ciotti, L., Lanzoni, B., & Volonteri, M. 2007, ApJ, 658, 65
- Colless et al. (2001) Colless, M., Dalton, G., Maddox, S., et al. 2001, MNRAS, 328, 1039
- Combes et al. (1990) Combes, F., Debbasch, F., Friedli, D., & Pfenniger, D. 1990,A&A, 233, 82
- Cox et al. (2006) Cox, T. J., Jonsson, P., Primack, J. R., & Somerville, R. S. 2006, MNRAS, 373, 1013
- Cox et al. (2008) Cox, T. J., Jonsson, P., Somerville, R. S., Primack, J. R., & Dekel, A. 2008, MNRAS, 384, 386
- Davis et al. (1985) Davis, M., Efstathiou, G., Frenk, C. S., & White, S. D. M. 1985, ApJ, 292, 371
- Debattista et al. (2004) Debattista, V. P., Carollo, C. M., Mayer, L., & Moore, B. 2004, ApJ, 604, L93
- Debattista et al. (2006) Debattista, V. P., Mayer, L., Carollo, C. M., et al. 2006, ApJ, 645, 209
- Dekel & Cox (2006) Dekel, A., & Cox, T.J. 2006, MNRAS, 370, 1445
- De Lucia & Blaizot (2007) De Lucia, G., & Blaizot, J. 2007, MNRAS, 375, 2
- De Propris et al. (2005) De Propris, R., Liske, J., Driver, S. P., Allen, P. D., & Cross, N. J. G. 2005, AJ, 130, 1516
- Di Matteo et al. (2007) Di Matteo, P., Combes, F., Melchior, A.-L., & Semelin, B. 2007, A&A, 468, 61
- Di Matteo et al. (2008) Di Matteo, P., Bournaud, F., Martig, M., et al. 2008, A&A, 492, 31
- Dressler (1980) Dressler, A. 1980, ApJ, 236, 351
- Edwards & Patton (2012) Edwards, L. O. V., & Patton, D. R. 2012, MNRAS, 425, 287
- Eke et al. (2004a) Eke, V. R., Baugh, C. M., Cole, S., et al. 2004a, MNRAS, 348, 866
- Eke et al. (2004b) Eke, V. R., Frenk, S. S., Baugh, C. M., et al. 2004b, MNRAS, 355, 769
- Ellison et al. (2010) Ellison, S. L., Patton, D. R., Simard, L., et al. 2010, MNRAS, 407, 1514
- Feldmann et al. (2006) Feldmann, R., Carollo, C. M., Porciani, C., et al. 2006, MNRAS, 372, 565
- Feldmann et al. (2008) Feldmann, R., Mayer, L., & Carollo, C. M. 2008, ApJ, 684, 1062
- Feldmann et al. (2010) Feldmann, R., Carollo, C. M., Mayer, L., et al. 2010, ApJ, 709, 218
- Feldmann, Carollo & Mayer (2011) Feldmann, R., Carollo, C. M., & Mayer, L. 2011, ApJ, 736, 88
- Gallazzi et al. (2005) Gallazzi, A., Charlot, S., Brinchmann, J., White, S. D. M., & Tremonti, C. A. 2005, MNRAS, 362, 41
- Geller et al. (2006) Geller, M. J., Kenyon, S. J., Barton, E. J., Jarrett, T. H., & Kewley, L. J. 2006, AJ, 132, 2243
- Guo et al. (2011) Guo, Q., White, S., Boylan-Kolchin, M., et al. 2011, MNRAS, 413, 101
- Gunn & Gott (1972) Gunn, J. E., & Gott, J. R., III 1972, ApJ, 176, 1
- Hatton et al. (2003) Hatton, S., Devriendt, J. E. G., Ninin, S., et al. 2003, MNRAS, 343, 75
- Heiderman et al. (2009) Heiderman, A., Jogee, S., Marinova, I., et al. 2009, ApJ, 705, 1433
- Hopkins et al. (2010) Hopkins, P. F., Bundy, K., Hernquist, L., Wuyts, S., & Cox, T. J. 2010, MNRAS, 401, 1099
- Hopkins et al. (2013) Hopkins, P. F., Cox, T. J., Hernquist, L., et al. 2013, MNRAS, 430, 1901
- Hopkins et al. (2008) Hopkins, P. F., Cox, T. J., & Hernquist, L. 2008, ApJ, 689, 17
- Kampczyk et al. (2013) Kampczyk, P., Lilly, S. J.; de Ravel, L., et al. 2013, ApJ, 762, 43
- Kawata et al. (2006) Kawata, D., Mulchaey, J. S., Gibson, B. K., Sanchez-Blzquez, P. 2006, ApJ, 648, 969
- Kennicutt et al. (1987) Kennicutt, R. C., Jr., Roettiger, K. A., Keel, W. C., van der Hulst, J. M., & Hummel, E. 1987, AJ, 93, 1011
- Kennicutt (1998) Kennicutt, R. C., Jr. 1998, ApJ, 498, 541
- Kitzbichler & White (2008) Kitzbichler, M. G., & White, S. D. M. 2008, MNRAS, 391, 1489
- Knapen & James (2009) Knapen, J. H., & James, P. A. 2009, ApJ, 698, 1437
- Kormendy (1979) Kormendy, J. 1979, ApJ, 227, 714
- Kormendy & Kennicutt (2004) Kormendy, J., & Kennicutt, R. C., Jr. 2004, ARA&A, 42, 603
- Kormendy et al. (2010) Kormendy, J., Drory, N., Bender, R., & Cornell, M. E. 2010, ApJ, 723, 54
- Kormendy & Bender (2012) Kormendy, J., & Bender, R. 2012, ApJS, 198, 2
- Kormendy (2013) Kormendy, J. 2013, Secular Evolution of Galaxies, Cambridge, UK: Cambridge University Press, p.1
- Lambas et al. (2003) Lambas, D. G., Tissera, P. B., Alonso, M. S., & Coldwell, G. 2003, MNRAS, 346, 1189
- Larson & Tinsley (1978) Larson, R. B., & Tinsley, B. M. 1978, ApJ, 219, 46
- Lemson et al. (2006) Lemson, G. & the Virgo Consortium 2006, arXiv:astro-ph/0608019
- Lin et al. (2010) Lin, L., Cooper, M. C., Jian, H.-Y., et al. 2010, ApJ, 718, 1158
- Lotz et al. (2010) Lotz, J. M., Jonsson, P., Cox, T. J., & Primack, J. R. 2010, MNRAS, 404, 590
- Makino & Hut (1997) Makino, J., & Hut, P. 1997, ApJ, 481, 83
- Mamon (1992) Mamon, G.A. 1992, ApJ, 401, 3
- Mamon (2000) Mamon, G. A., 2000, in Dynamics of Galaxies: from the Early Universe to the Present, 15th IAP meeting. Eds.: Francoise Combes, Gary A. Mamon, and Vassilis Charmandaris ASP Conference Series, Vol. 197, p. 377.
- Maulbetsch et al. (2007) Maulbetsch, C., Avila-Reese, V., Colin, P., et al. 2007, ApJ, 654, 53
- McBride et al. (2009) McBride, J., Fakhouri, O., & Ma, C.-P. 2009, MNRAS, 398, 1858
- McIntosh et al. (2008) McIntosh, D. H., Guo, Y., Hertzberg, J., Katz, N., Mo, H. J., et al. 2008 MNRAS, 388, 1537
- Mihos & Hernquist (1994) Mihos, J. C., & Hernquist, L. 1994, ApJ, 425, L13
- Moore et al. (1996) Moore, B., Katz, N., Lake, G., Dressler, A., & Oemler, A. 1996, Nature, 379, 613
- Naab Burkert & Hernquist (1999) Naab, T., Burkert, A., & Hernquist, L. 1999, ApJ, 523, L133
- Naab, Jesseit & Burkert (2006) Naab, T., Jesseit, R., & Burkert, A. 2006, MNRAS, 372, 839
- Newman et al. (2012) Newman, A. B., Ellis, R. S., Bundy, K., & Treu, T. 2012, ApJ, 746, 162
- Newton & Kay (2013) Newton, R. D. A., & Kay, S. T. 2013, MNRAS, 434, 3606
- Oemler (1974) Oemler, A. 1974, ApJ, 194, 10
- Oesch et al. (2010) Oesch, P. A., Carollo, C. M., Feldmann, R., et al. 2010, ApJ, 714, L47
- Park et al. (2007) Park, C., Choi, Y.-Y., Vogeley, M. S., Gott, J. R., III, Blanton, M. R., et al. 2007, ApJ, 658, 898
- Patton et al. (2011) Patton, D. R., Ellison, S. L., Simard, L., McConnachie, A. W., & Mendel, J. T. 2011, MNRAS, 412, 591
- Patton et al. (2013) Patton, D. R., Torrey, P., Ellison, S. L., Mendel, J. T., & Scudder, J. M. 2013, MNRAS, 433, L59 2013MNRAS.433L..59P
- Pearce et al. (1999) Pearce, F. R., Jenkins, A., Frenk, C. S., Colberg, J. M., White, S. D. M. et al. 1999ApJ, 521, 99
- Peletier et al. (1999) Peletier, R. F., Balcells, M., Davies, R. L., Andredakis, Y., Vazdekis, A. et al. 1999, MNRAS, 310, 703
- Peng et al. (2010) Peng, Y.-J., Lilly, S. J., Kovač, K., Bolzonella, M., Pozzetti, L., et al. 2010, ApJ, 721, 193
- Peng et al. (2012) Peng, Y.-J., Lilly, S. J., Renzini, A., & Carollo, M. 2012, ApJ, 757, 4
- Perez et al. (2009) Perez, J., Tissera, P., Padilla, N., Alonso, M. S., & Lambas, D. G. 2009, MNRAS, 399, 1157
- Perez et al. (2009) Perez, J., Tissera, P., & Blaizot, J. 2009, MNRAS, 397, 748
- Pipino et al. (2009) Pipino, A., Devriendt, J.E.G., Thomas, D., Silk, J., & Kaviraj, S. 2009, A&A, 505, 1075
- Rasmussen et al. (2010) Rasmussen, J., Mulchaey, J. S., Bai, L., Ponman, T. J., Raychaudhury, S., et al. 2010, ApJ, 717, 958
- Rines et al. (2007) Rines, K., Finn, R., & Vikhlinin, A. 2007, ApJ, 665, L9
- Robaina et al. (2009) Robaina, A. R.; Bell, E. F.; Skelton, R. E.; McIntosh, D H., Somerville, R. S., et al. 2009, ApJ, 704, 324
- Robotham et al. (2013) Robotham, A. S. G., Liske, J., Driver, S. P., Sansom, A. E., Baldry, I. K. et al. 2013, MNRAS, 431, 167
- Schmidt (1959) Schmidt, M., 1959, ApJ, 129, 243
- Scudder et al. (2012) Scudder, J. M., Ellison, S. L., Torrey, P., Patton, D. R., Mendel, J. T. 2012, MNRAS, 426, 549
- Sol Alonso et al. (2006) Sol Alonso, M., Lambas, D. G., Tissera, P., & Coldwell, G. 2006, MNRAS, 367, 1029
- Springel et al. (2006) Springel, V., Frenk, C. S., & White, S. D. M. 2006, Nature, 440, 1137
- Tal et al. (2009) Tal, T., van Dokkum, P. G., Nelan, J., & Bezanson, R. 2009, AJ, 138, 1417
- Teyssier et al. (2010) Teyssier, R., Chapon, D., & Bournaud, F. 2010, ApJ, 720, L149
- Thomas et al. (2005) Thomas, D., Maraston, C., Bender, R., & Mendes de Oliveira, C. 2005, ApJ, 621, 673
- Tinsley (1972) Tinsley, B.M. 1972, ApJ, 178, 319
- Toomre & Toomre (1972) Toomre, A., & Toomre, J. 1972, ApJ, 178, 623
- Toomre (1977) Toomre, A., & Toomre, J. 1977, in Evolution of Galaxies and Stellar Populations, ed. B. M. Tinsley & R. B. Larson (New Haven, CT: Yale Univ. Observatory), 401
- Tran et al. (2008) Tran, K. H., Moustakas, J., Gonzalez, A.-H., Bai, L., Zaritsky, D., & Kautsch, S. J. 2008, ApJ, 683, 17
- Tremonti et al. (2004) Tremonti, C. A., Heckman, T. M., Kauffmann, G., Brinchmann, J., Charlot, S. et al. 2004, ApJ, 613, 898
- van Dokkum et al. (2005) van Dokkum, P.G., 2005, AJ, 130, 2647
- Wechsler et al. (2002) Wechsler, Risa H., Bullock, James S., Primack, Joel R., Kravtsov, Andrey V., Dekel, Avishai 2002, ApJ, 568, 52
- Weinmann et al. (2006) Weinmann, S. M., van den Bosch, F. C., Yang, X., & Mo, H. J. 2006, MNRAS, 366, 2
- Weinmann et al. (2009) Weinmann, S. M., Kauffmann, G., van den Bosch, F. C., Pasquali, A., McIntosh, D. H., Mo, H. J., Yang, X., & Guo, Y. 2009, MNRAS, 394, 1213
- Wetzel et al. (2012) Wetzel, A. R., Tinker, J. L., & Conroy, C. 2012, MNRAS, 424, 232
- Woods & Geller (2007) Woods, D. F., & Geller, M. J. 2007, AJ, 134, 527
- Woods et al. (2010) Woods, D. F., & Geller, M. J., Kurtz, M.J., et al. 2010, AJ, 139, 1857
- York et al. (2000) York, D. G., Adelman, J., Anderson, J. E., Jr., et al. 2000, AJ, 120, 1579