119–126
The intergalactic medium in the cosmic web
Abstract
The intergalactic medium (IGM) accounts for of baryons at all epochs and yet its three dimensional distribution in the cosmic web remains mostly unknown. This is so because the only feasible way to observe the bulk of the IGM is through intervening absorption line systems in the spectra of bright background sources, which limits its characterization to being one-dimensional. Still, an averaged three dimensional picture can be obtained by combining and cross-matching multiple one-dimensional IGM information with three-dimensional galaxy surveys. Here, we present our recent and current efforts to map and characterize the IGM in the cosmic web using galaxies as tracers of the underlying mass distribution. In particular, we summarize our results on: (i) IGM around star-forming and non-star-forming galaxies; (ii) IGM within and around galaxy voids; and (iii) IGM in intercluster filaments. With these datasets, we can directly test the modern paradigm of structure formation and evolution of baryonic matter in the Universe.
keywords:
intergalactic medium; cosmology: large scale structure of the Universe; galaxies: formation; quasars: absorption linesEnn Saar and Jaan Einasto
1 Introduction
The physics of the intergalactic medium (IGM) and its connection with galaxies are key to understanding the evolution of baryonic matter in the Universe. The IGM is the main reservoir of baryons at all epochs (e.g. [Fukugita et al.(1998), Fukugita et al. 1998]; [Shull et al.(2012), Shull et al. 2012]), and provides the primordial material for forming galaxies. Once galaxies are formed, supernovae (SNe) and active-galactic nuclei (AGN) feedback inject energy in the interstellar medium, some of which escapes the galaxies as winds, enriching the IGM with metals (e.g. [Wiersma et al.(2011), Wiersma et al. 2011]; [Ford et al.(2014), Ford et al. 2014]). Because of the continuous interplay between the IGM and galaxies, it is sensible (if not necessary) to study these two concepts simultaneously (e.g. [Morris et al.(1993), Morris et al. 1993]; [lanzetta1995, Lanzetta et al. 1995]; [Tripp et al.(1998), Tripp et al. 1998]; [Chen & Mulchaey(2009), Chen & Mulchaey 2009]; [Prochaska et al.(2011), Prochaska et al. 2011]; [Tumlinson et al.(2011), Tumlinson et al. 2011]; [Tejos et al.(2014), Tejos et al. 2014]; [Werk et al.(2014), Werk et al. 2014]).
The large scale environment in which matter resides also plays an important role. Given that baryonic matter is expected to fall into the considerably deeper gravitational potentials of dark matter, the IGM gas and galaxies should be predominantly found at such locations, forming the so-called ‘cosmic web’ ([Bond et al.(1996), Bond et al. 1996]). Galaxies appear to follow the filamentary structure which simulations predict (e.g. [Springel et al.(2006), Springel et al. 2006]), and their properties are partly shaped by environmental effects (e.g. [Dressler(1980), Dressler 1980]; [Skibba et al.(2009), Skibba et al. 2009]). However, much less is known about the actual properties and distribution of the IGM in different cosmological environments. This is so because the only feasible way to observe the bulk of the IGM is through intervening absorption line systems in the spectra of bright background sources (e.g. quasi-stellar objects, gamma-ray bursts, galaxies), which limits its characterization to being one-dimensional.
The advent of big galaxy surveys such as the 2dFGRS ([Colless et al.(2001), Colless et al. 2001]) or the SDSS ([Abazajian et al.(2009), Abazajian et al. 2009]), have revolutionized the study of the cosmic web and the large-scale structure (LSS) of the Universe. This is eloquently demonstrated by the plethora of LSS catalogs that are currently available: from galaxy voids (e.g. [Pan et al.(2012), Pan et al. 2012]; [Sutter et al.(2012), Sutter et al. 2012]; [Nadathur & Hotchkiss(2014), Nadathur & Hotchkiss 2014]; [Way et al.(2014), Way et al. 2014]), galaxy filaments (e.g. [Tempel et al.(2014), Tempel et al. 2014]), to galaxy groups and clusters (e.g. [Hao2012, Hao et al. 2010]; [Rykoff et al.(2014), Rykoff et al. 2014]). By combining and cross-matching multiple one-dimensional IGM information with galaxy and LSS surveys, an averaged three dimensional picture can be obtained. Here, we present our recent and current efforts to map and characterize the IGM in the cosmic web using galaxies as tracers of the underlying mass distribution.
2 The IGM-galaxy cross-correlation
The two-point correlation function between neutral hydrogen (H i) and galaxies is a powerful statistical technique to assess the connection between the IGM and galaxies (e.g. [Chen et al.(2005), Chen et al. 2005]; [Ryan-Weber(2006), Ryan-Weber 2006]; [Wilman et al.(2007), Wilman et al. 2007]; [Chen & Mulchaey(2009), Chen & Mulchaey 2009]; [Shone et al.(2010), Shone et al. 2010]; [Tejos et al.(2014), Tejos et al. 2014]).
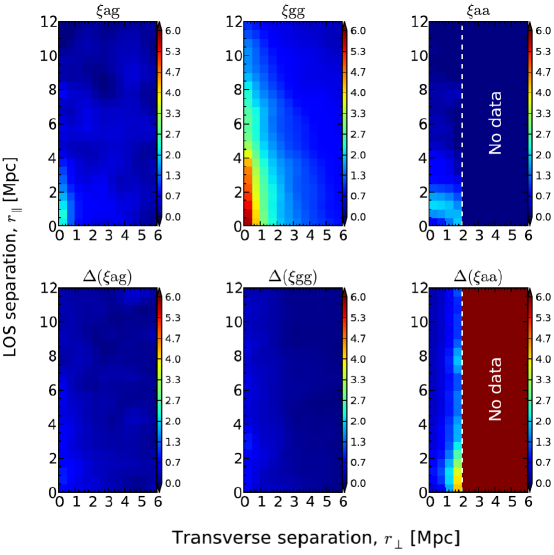
In [Tejos et al.(2014), Tejos et al. (2014)], we have recently published observational results on the H i–galaxy two-point cross-correlation at (; see Fig. 1). These results come from the largest sample ever done for such an analysis, comprising about H i absorption line systems in the UV spectra of background QSOs, in different fields observed with the HST, and about galaxies with spectroscopic redshifts around these QSOs sightlines, coming from our own spectroscopic surveys, and previously published catalogs by the VVDS ([Le Fèvre et al.(2013), Le Fèvre et al. 2013]) and GDDS ([Abraham et al.(2004), Abraham et al. 2004]) galaxy surveys.
Apart from , we also measured the H i–H i () and galaxy-galaxy () two-point auto-correlations. Our survey is one of the few in which these three quantities have been measured from the same dataset, and independently from each other. Comparing the results from , and , we constrained the IGM-galaxy statistical connection, as a function of both H i column density and galaxy star formation activity, on Mpc scales. Our results are consistent with the following conclusions: (i) the bulk of H i systems on Mpc scales have little velocity dispersion ( km s-1) with respect to the bulk of galaxies (i.e. no strong galaxy outflow/inflow signal is detected); (ii) the vast majority () of H i systems with cm-2 and star-forming galaxies are distributed in the same locations, together with of non-star forming galaxies; (iii) of non-star-forming galaxies reside in galaxy clusters and are not correlated with H i systems at scales Mpc; and (iv) of H i systems with cm-2 reside within galaxy voids and hence are not correlated with luminous galaxies.
3 The IGM within and around galaxy voids
In [Tejos et al.(2012), Tejos et al. (2012)] we have recently measured the properties of H i absorption line systems within and around galaxy voids at , using the galaxy void catalog published by [Pan2011, Pan et al. (2011)] and the low- H i absorption line catalog published by [Danforth & Shull(2008), Danforth & Shull (2008)]. Our key findings can be summarized as follows: (i) there is a significant excess of IGM gas at the edges of galaxy voids with respect to the random expectation, consistent with the overdensity of galaxies defining such voids; and (ii) inside galaxy voids the IGM gas matches the random expectation, inconsistent with the underdensity of galaxies defining such voids. In other words, there were no apparent IGM voids detected at the positions of galaxy voids.
We also showed that the column density () and Doppler parameter () distributions of H i lines inside and outside galaxy voids were not remarkably different, with only a and probability of rejecting the null-hypothesis of both samples coming from the same parent population, respectively. Still, a trend was present, in which galaxy void absorbers have systematically lower values of both and than those found outside galaxy voids. By performing a similar analysis using a state-of-the-art hydrodynamical cosmological simulation (GIMIC; [Crain et al.(2009), Crain et al. 2009]), we showed that these observed trends are qualitatively consistent with current theoretical expectations. However, more quantitative comparisons of the gas properties in galaxy voids between hydrodynamical simulations tuned to explore low density environments (e.g. [Ricciardelli et al.(2013), Ricciardelli et al. 2013]) and observations (e.g. [Tejos et al.(2012), Tejos et al. 2012]), are required.
4 The IGM in intercluster filaments
Galaxy clusters represent the densest nodes in the cosmic web (with dark matter halo masses of ) and as such, -body numerical simulations predict a high probability of finding intercluster filaments between galaxy cluster pairs when separated by Mpc (e.g. [Colberg et al.(2005), Colberg et al. 2005]; [González & Padilla(2010), González & Padilla 2010]). Hydrodynamical simulations predict that an important fraction of baryons at low- are in a diffuse, shock heated gas phase with K in these dense filaments, commonly referred to as the warm-hot intergalactic medium (WHIM; [Cen & Ostriker(1999), Cen & Ostriker 1999]; [Davé et al.(2001), Davé et al. 2001]). However, this WHIM has been very elusive and difficult to observe (e.g. [Richter et al.(2006), Richter et al. 2006]).
Here, we have presented preliminary results on the properties of the IGM in intercluster filaments at by using a single QSO observed with the HST/COS UV spectrograph, whose sightline intersects independent cluster-pairs at impact parameters Mpc from the intercluster axes. This technique allowed us to perform, for the first time, a systematic and statistical measurement of the incidence of H i and O vi absorption lines associated to intercluster filaments. We constrained the geometry and physical properties of the IGM gas lying between clusters. Our results are consistent with a filamentary geometry for the gas, and the presence of both broad H i ( km s-1) and O vi hint towards the existence of a WHIM (Tejos et al. in prep.).
This work was partly funded by CONICYT/PFCHA 72090883 (Chile).
References
- [Abraham et al.(2004)] Abraham, R. G., Glazebrook, K., McCarthy, P. J., et al. 2004, AJ, 127, 2455
- [Abazajian et al.(2009)] Abazajian, K. N., Adelman-McCarthy, J. K., Agüeros, M. A., et al. 2009, ApJS, 182, 543
- [Bond et al.(1996)] Bond, J. R., Kofman, L., & Pogosyan, D. 1996, Nature, 380, 603
- [Cen & Ostriker(1999)] Cen, R., & Ostriker, J. P. 1999, ApJ, 514, 1
- [Chen et al.(1998)] Chen, H.-W., Lanzetta, K. M., Webb, J. K., & Barcons, X. 1998, ApJ, 498, 77
- [Chen et al.(2005)] Chen, H.-W., Prochaska, J. X., Weiner, B. J., et al. 2005, ApJ(Letters), 629, L25
- [Chen & Mulchaey(2009)] Chen, H.-W., & Mulchaey, J. S. 2009, ApJ, 701, 1219
- [Colberg et al.(2005)] Colberg, J. M., Krughoff, K. S., & Connolly, A. J. 2005, MNRAS, 359, 272
- [Colless et al.(2001)] Colless, M., Dalton, G., Maddox, S., et al. 2001, MNRAS, 328, 1039
- [Crain et al.(2009)] Crain, R. A., Theuns, T., Dalla Vecchia, C., et al. 2009, MNRAS, 399, 1773
- [Danforth & Shull(2008)] Danforth, C. W., & Shull, J. M. 2008, ApJ, 679, 194
- [Davé et al.(2001)] Davé, R., Cen, R., Ostriker, J. P., et al. 2001, ApJ, 552, 473
- [Dressler(1980)] Dressler, A. 1980, ApJ, 236, 351
- [Ford et al.(2014)] Ford, A. B., Davé, R., Oppenheimer, B. D., et al. 2014, MNRAS, 444, 1260
- [Fukugita et al.(1998)] Fukugita, M., Hogan, C. J., & Peebles, P. J. E. 1998, ApJ, 503, 518
- [González & Padilla(2010)] González, R. E., & Padilla, N. D. 2010, MNRAS, 407, 1449
- [Hao et al.(2010)] Hao, J., McKay, T. A., Koester, B. P., et al. 2010, ApJS, 191, 254
- [Lanzetta et al.(1995)] Lanzetta, K. M., Bowen, D. V., Tytler, D., & Webb, J. K. 1995, ApJ, 442, 538
- [Le Fèvre et al.(2013)] Le Fèvre, O., Cassata, P., Cucciati, O., et al. 2013, A&A, 559, A14
- [Morris et al.(1993)] Morris, S. L., Weymann, R. J., Dressler, A., et al. 1993, ApJ, 419, 524
- [Nadathur & Hotchkiss(2014)] Nadathur, S., & Hotchkiss, S. 2014, MNRAS, 440, 1248
- [Pan et al.(2012)] Pan, D. C., Vogeley, M. S., Hoyle, F., Choi, Y.-Y., & Park, C. 2012, MNRAS, 421, 926
- [Prochaska et al.(2011)] Prochaska, J. X., Weiner, B., Chen, H.-W., Mulchaey, J., & Cooksey, K. 2011, ApJ, 740, 91
- [Ricciardelli et al.(2013)] Ricciardelli, E., Quilis, V., & Planelles, S. 2013, MNRAS, 434, 1192
- [Richter et al.(2006)] Richter, P., Savage, B. D., Sembach, K. R., & Tripp, T. M. 2006, A&A, 445, 827
- [Ryan-Weber(2006)] Ryan-Weber, E. V. 2006, MNRAS, 367, 1251
- [Rykoff et al.(2014)] Rykoff, E. S., Rozo, E., Busha, M. T., et al. 2014, ApJ, 785, 104
- [Shone et al.(2010)] Shone, A. M., Morris, S. L., Crighton, N., & Wilman, R. J. 2010, MNRAS, 402, 2520
- [Shull et al.(2012)] Shull, J. M., Smith, B. D., & Danforth, C. W. 2012, ApJ, 759, 23
- [Skibba et al.(2009)] Skibba, R. A., Bamford, S. P., Nichol, R. C., et al. 2009, MNRAS, 399, 966
- [Springel et al.(2006)] Springel, V., Frenk, C. S., & White, S. D. M. 2006, Nature, 440, 1137
- [Sutter et al.(2012)] Sutter, P. M., Lavaux, G., Wandelt, B. D., & Weinberg, D. H. 2012, ApJ, 761, 44
- [Tejos et al.(2012)] Tejos, N., Morris, S. L., Crighton, N. H. M., et al. 2012, MNRAS, 425, 245
- [Tejos et al.(2014)] Tejos, N., Morris, S. L., Finn, C. W., et al. 2014, MNRAS, 437, 2017
- [Tempel et al.(2014)] Tempel, E., Stoica, R. S., Martínez, V. J., et al. 2014, MNRAS, 438, 3465
- [Tripp et al.(1998)] Tripp, T. M., Lu, L., & Savage, B. D. 1998, ApJ, 508, 200
- [Tumlinson et al.(2011)] Tumlinson, J., Thom, C., Werk, J. K., et al. 2011, Science, 334, 948
- [Way et al.(2014)] Way, M. J., Gazis, P. R., & Scargle, J. D. 2014, arXiv:1406.6111
- [Werk et al.(2014)] Werk, J. K., Prochaska, J. X., Tumlinson, J., et al. 2014, ApJ, 792, 8
- [Wiersma et al.(2011)] Wiersma, R. P. C., Schaye, J., & Theuns, T. 2011, MNRAS, 415, 353
- [Wilman et al.(2007)] Wilman, R. J., Morris, S. L., Jannuzi, B. T., Davé, R., & Shone, A. M. 2007, MNRAS, 375, 735