Self-normalizing phase measurement in multimode terahertz spectroscopy based on photomixing of three lasers
Abstract
Photomixing of two near-infrared lasers is well established for continuous-wave terahertz spectroscopy. Photomixing of three lasers allows us to measure at three terahertz frequencies simultaneously. Similar to Fourier spectroscopy, the spectral information is contained in an interferogram, which is equivalent to the waveform in time-domain spectroscopy. We use one fixed terahertz frequency to monitor temporal drifts of the setup, i.e., of the optical path-length difference. The other two frequencies are scanned for broadband high-resolution spectroscopy. The frequency dependence of the phase is obtained with high accuracy by normalizing it to the data obtained at , which eliminates drifts of the optical path-length difference. We achieve an accuracy of about m or of the optical path length. This method is particularly suitable for applications in nonideal environmental conditions outside of an air-conditioned laboratory.
pacs:
07.57.-c, 32.30.BvTerahertz spectroscopy has been revolutionized by laser-based techniques and bears an enormous potential both for fundamental science and for a wide range of applications.Lee08 ; Tonouchi2007 One intriguing aspect of the terahertz range is that it allows for the determination of both amplitude and phase of an electromagnetic wave. The phase delay induced by a sample can be employed for measuring both the refractive index and the thicknessJen2014 ; Scheller2010a ; Yasui2005 ; Johnson2001 ; Roggenbuck2010 or for tomography, e.g. for the inspection of space shuttle foam insulation.Mittleman1997 ; Zhong2005 ; Guillet2014 Reliable measurements of the phase require a high stability of the relevant experimental lengths, therefore (thermal) fluctuations or alignment drifts may not exceed a small fraction of the wavelength. Large wavelengths such as about 1 mm at 300 GHz thus facilitate the determination of the phase. However, thermal fluctuations cannot be fully suppressed even in an air-conditioned laboratory, and phase measurements in real-world applications in a less than ideal environment are challenging, in particular if they rely on a robust fiber-based system.Soltani2014 These difficulties are successfully surpassed in ellipsometry, which measures the phase difference between different polarization states. Here, we choose another route based on continuous-wave (cw) spectroscopy in the frequency domain and consider the phase difference of waves with different frequencies. Via photomixing of three lasers, we generate waves at three terahertz frequencies. The waves travel along the same path at the same time, their phases are measured simultaneously. We employ the phase at the fixed frequency to monitor length changes during the measurement. The normalized phases of the two other, scanning frequencies are nearly insensitive to thermal drifts. Without temperature stabilization of the laboratory, we achieve an accuracy which is equivalent to length changes of about 1-2 m or 3-6 fs, where denotes the speed of light.
Continuous-wave terahertz radiation can be generated and coherently detected by illuminating two photomixers, transmitter and receiver, with the optical beat of two near-infrared lasers with frequencies and .McIntosh1995 ; Verghese1998 ; Matsuura2005 ; Deninger2008 ; Roggenbuck2010 The biased transmitter emits radiation at the difference frequency = , whereas the photocurrent in the receiver measures the cross-correlationVerghese1998 ; Morikawa2000
| (1) |
where denotes the phase difference between the optical beat and the terahertz electric field with amplitude at the receiver. The sensitivity to reflects the similarity to a Mach-Zehnder interferometer. Both and can be determined from by phase modulation with, e.g., a mechanical delay stage or a fiber stretcher.Roggenbuck2012 In both cases, one modulates the optical path-length difference = between the receiver arm with the optical path length and the transmitter arm including the terahertz path, , see Fig. 1. A frequency-independent contributes a term to , but there are other contributions stemming from, e.g., the group delay introduced by the antennae, the photomixer impedance, and standing waves. Langenbach2014 We summarize these in ,
| (2) |
Accordingly, an uncertainty of arises from the uncertainties and of and , respectively,
| (3) |
In our setup, the right hand side typically is dominated by the first term, .Langenbach2014 The line width of the beat signal of two tunable lasers amounts to about = 5 MHz.Deninger2008 Choosing, e.g., 1 cm and cm, the second term on the right hand side roughly yields 0.12 m(THz/)2, which amounts to about 3 m at 200 GHz and 0.75 m at 400 GHz.Langenbach2014 Typically, one has to cope with much larger values of the length drift , which thus dominates . This claim is justified a posteriori by the success of our normalization procedure.
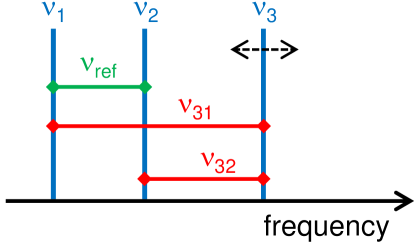
Continuous-wave terahertz spectroscopy based on photomixing of more than two modes has been discussed previously.Morikawa2000 ; Tani2005 ; Gregory2005 ; Scheller2009 ; Brenner2010 ; Molter2011 ; Morikawa2011 ; Morikawa2013 ; Scheller2010a ; Scheller2010b Using multimode laser diodes has been proposed as a low-cost, fast alternative for broadband spectroscopyMorikawa2000 ; Tani2005 ; Gregory2005 ; Scheller2009 ; Brenner2010 ; Molter2011 ; Morikawa2011 ; Morikawa2013 or to overcome the ambiguity of the phase.Scheller2010a ; Scheller2010b Here, we use three near-infrared lasers to correct the length drift in broadband spectroscopy. Two lasers operate at the fixed frequencies and while the frequency of the third laser is tunable. In the terahertz range, this yields three difference frequencies.Tani2005 ; Gregory2005 ; Scheller2009 The reference frequency = is fixed while = and = are tunable, see Fig. 2. Spectroscopic measurements are performed by varying , thus tuning and over the desired range. Simultaneously, we record the temporal evolution of . This yields an excellent measure of the drift which allows for an accurate correction of the spectroscopic data.
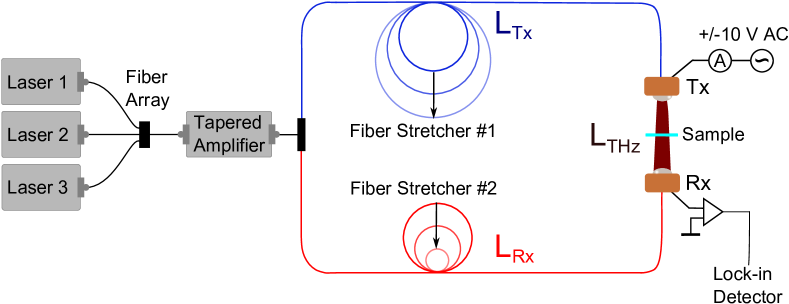
A sketch of our experimental setup is given in Fig. 1. We employ three distributed-feedback diode lasers (Toptica DL DFB) with center wavelengths of about 780 nm. One laser is locked to a Doppler-free Rb absorption line at /780 nm with a stability of about 1 MHz. The other two lasers with frequencies and are tunable over a broad range, the difference frequencies and cover the range up to 1.8 THz. Although our method is based on two fixed lasers at and plus a tunable one at , it is advantageous if both and are tunable. In this way the reference frequency = can be adapted to the experimental conditions, e.g., the transparent frequency range of a given sample. First, we tune to choose an appropriate value of . Then, spectroscopic measurements are performed by scanning over a wide range.
The laser beams are superimposed in a polarization-maintaining single-mode fiber array. Two beams are coupled in a 50:50 splitter, the third one is added via a 2:1 splitter. The superposition thus carries 1/3 of the power of each laser. After amplification (Toptica BoosTA 780), we use a further 50:50 splitter to illuminate the two fiber-pigtailed photomixers.Mayorga2007 For more details of the two-laser setup, we refer to Refs. Roggenbuck2010, ; Roggenbuck2012, ; Roggenbuck2013, ; Langenbach2014, .
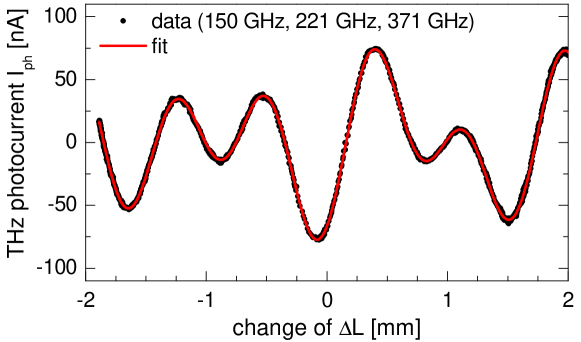
A temporal modulation of yields a photocurrent which is equivalent to an interferogram.Verghese1998 In the conventional case of a two-laser setup, there is a single difference frequency and the interferogram takes a cosine shape, see Equs. 1 and 2. For three difference frequencies, is a superposition of three cosines,Tani2005 ; Gregory2005 ; Scheller2009 see the example in Fig. 3. We modulate by two fiber stretchers which affect and with opposite signs.Roggenbuck2012 Each fiber stretcher adds 60 m of fiber with a refractive index of about 1.5 to the optical path, thus a single stretcher would introduce a large length difference between and . Using two fiber stretchers allows for a small value of and minimizes thermal drifts of . We employ a modulation frequency of 800 Hz and a delay length or maximum change of of mm.Roggenbuck2012 Typically, we collect data for a single interferogram over about 240 stretcher cycles (or 300 ms), resulting in a net data acquisition rate of about 3 Hz.Roggenbuck2012
In the photocurrent , the cosine amplitudes depend on the respective frequencies due to, e.g., the frequency dependence of the photomixers.Deninger2008 ; Roggenbuck2010 A Fourier transform or a fit of the interferogram yields the amplitudes and phases for all three difference frequencies. The spectral resolution d = of an interferogram amounts to 30 GHz for a delay length = 5 mm. In our case, the spectral resolution is given by the line width of the beat signal, = 5 MHz, or by the long-term frequency stability of better than 20 MHz over 24 h.Deninger2008 A reliable fit of the interferogram still requires that the three terahertz frequencies differ by at least d. Therefore, spectroscopic data cannot be obtained in the window . We typically collect data sets for different values of , which is another reason for using a tunable laser frequency , i.e., a tunable = .
Before addressing our results, we discuss the expected size of the drift. First we consider a free-space setup without fibers. For = 0, a common change of the laboratory temperature equally affects both interferometer arms, leaving unchanged. However, a temperature difference between the two arms induces a path-length difference of, e.g., 20 m/1m)/1K) if the setup is mounted on an Al plate with a thermal expansion coefficient /K. With dispersive elements such as the fibers, the discussion is more subtle. To achieve , the free-space path length has to be compensated by a piece of fiber, for which the thermal drift is dominatedRoggenbuck2012 by the thermo-optic coefficient . Hence already a common change causes a finite drift of roughly 10 m/1m)/1K). We have chosen a face-to-face geometry with m to keep this term small. Note that it is not always possible to choose a small value of , e.g., for measurements with focusing optics or within an optical cryostat. Additionally, a temperature difference between the two arms contributes roughly 10 m/1m)/1K). Due to the fiber stretchers, we have to deal with 100 m, causing a drift of 1000 m/1K). Therefore it is of utmost importance to prevent a temperature difference between the two arms, i.e., to provide good thermal contact between the two fiber stretchers. However, it is not possible to stabilize an extended setup to within 1 mK, which is already sufficient to cause a drift of 1 m.
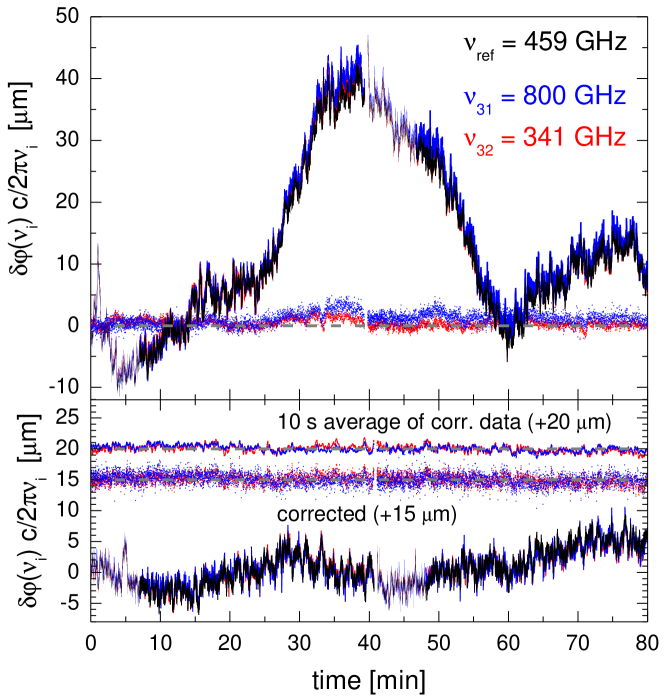
To demonstrate that our normalization method is able to correct for these drifts, we fix all 3 terahertz frequencies with and compare the temporal drifts measured in a laboratory without temperature stabilization. Ideally, the phase differences are independent of time. Accordingly, finite drifts of
| (4) |
offer a direct view on the temporal drift of the optical path-length difference, at least as long as the frequency-dependent contribution is negligible, see Eq. 3. Indeed, for cm we find that is basically independent of the frequency , see Fig. 4. Over roughly 30 min, we find drifts of m or 40 m in two data sets measured with (bottom panel) or without (top) good thermal contact between the two fiber stretchers, respectively. As discussed above, a temperature difference between the two stretchers is a major source for a length drift. Similar drifts of about 40 m (or 140 fs) have been reported for a fiber-based time-domain setup with 7 m of fiber in each arm.Soltani2014 Achieving a small drift of m requires an optimized setup (small , cm, m).Roggenbuck2012 Plotting averaged over 10 s shows that is determined to m in case of good thermal contact between the two stretchers (cf. lower panel of Fig. 4), even without temperature stabilization of the laboratory. Monitoring thus allows us to correct the drift with high accuracy. The normalized phases
| (5) |
with = 31, 32 are nearly insensitive to thermal drifts.
The remaining uncertainty of about 1 m corresponds to . This uncertainty is caused by a finite contribution of frequency fluctuations , cf. Eq. 3, and by the uncertainty of the interferogram fit. Moreover, one has to keep in mind that it takes about 300 ms to measure an interferogram, thus the method cannot correct fluctuations on such short time scales. However, the drift correction is very well suited to correct for slower drifts of and thus to provide long-term stability as required, e.g., for high-resolution measurements over a broad frequency range or for measurements as a function of an additional external parameter.
As an example, we performed 10 frequency sweeps with a resolution of 100 MHz over a period of 15 h without a sample. The phase data measured at the fixed frequency of 327 GHz reveal a slow drift of about 60 m over 12 h (bottom panel of Fig. 5). The top panel of Fig. 5 shows the effective optical path-length difference
| (6) |
where and denote the contributions stemming from the group delay of the antennae and the photomixer impedance (see Ref. [Langenbach2014, ] for details). Accordingly, contains the optical path-length difference mm as well as the effects of water vapor absorption in the terahertz path and standing waves. The strong modulation of with a period of 4.07 GHz is caused by standing waves within the photomixers’ Si lenses.Langenbach2014 The data in the top panel of Fig. 5 were obtained by averaging over 10 frequency sweeps after drift correction, yielding a standard deviation of 1-2 m (red symbols in middle panel). The accuracy obtained in the frequency sweeps is thus similar to the results for fixed frequencies discussed above. The modulation period of of GHz stems from the frequency control of the scanning laser, i.e., the remaining uncertainty originates mainly from the uncertainty . Averaging the uncorrected data yields a standard deviation of about 15 m (black symbols in middle panel). This clearly demonstrates the importance of drift correction for an accurate determination of the phase as well as the applicability of our method to broadband spectroscopy.
In summary, we employ three lasers to perform cw terahertz spectroscopy at one fixed frequency and two scanning frequencies and . The data obtained at monitors the drift of the optical path-length difference with an accuracy of about 1-2 m. This can be used to self-normalize the frequency dependence of the phase data measured at the scanning frequencies. The self-normalization is close to ideal because the drift correction is achieved by comparison of waves which travelled the same path at the same time, without reduction in measurement speed. This method allows for a reliable determination of the phase even in situations with large drifts such as in non-ideal environmental conditions.
References
- (1) Y.S. Lee, Principles of Terahertz Science and Technology, Springer, Berlin (2008).
- (2) M. Tonouchi, Nat. Photonics 1, 97 (2007).
- (3) C.-Y. Jen and C. Richter, Proc. SPIE 8984, Ultrafast Phenomena and Nanophotonics XVIII, 898414 (2014).
- (4) M. Scheller, K. Baaske, and M. Koch, Appl. Phys. Lett. 96, 151112 (2010).
- (5) T. Yasui, T. Yasuda, K. Sawanaka, and T. Araki, Appl. Opt. 44, 6849 (2005).
- (6) J.L. Johnson, T.D. Dorney, and D.M. Mittleman, Appl. Phys. Lett. 78, 835 (2001).
- (7) A. Roggenbuck, H. Schmitz, A. Deninger, I. Cámara Mayorga, J. Hemberger, R. Güsten, and M Grüninger, New J. Phys. 12, 043017 (2010).
- (8) D.M. Mittleman, S. Hunshe, L. Boivin, and M.G. Nuss, Opt. Lett. 22, 904 (1997).
- (9) H. Zhong, J. Xu, X. Xie, T. Yuan, R. Reightler, E. Madaras, and X.-C. Zhang, IEEE Sensors J. 5, 203 (2005).
- (10) J.P. Guillet, B. Recur, L. Frederique, B. Bousquet, L. Canioni, I. Manek-Hönninger, P. Desbarats, and P. Mounaix, J. Infrared Milli. Terahz. Waves 35, 382 (2014).
- (11) A. Soltani, T. Probst, S.F. Busch, M. Schwerdtfeger, E. Castro-Camus, and M. Koch, J. Infrared Milli. Terahz. Waves 35, 468 (2014).
- (12) K.A. McIntosh, E.R. Brown, K.B. Nichols, O.B. McMahon, W.F. DiNatale, and T. M. Lyszczarz, Appl. Phys. Lett. 67, 3844 (1995).
- (13) S. Verghese, K.A. McIntosh, S. Calawa, W.F. Dinatale, E.K. Duerr, and K.A. Molvar, Appl. Phys. Lett. 73, 3824-3826 (1998).
- (14) S. Matsuura and H. Ito, “Generation of cw terahertz radiation with photomixing,” in Terahertz Optoelectronics, K. Sakai, ed. (Springer-Verlag Berlin Heidelberg, 2005) 157-202.
- (15) A.J. Deninger, T. Göbel, D. Schönherr, T. Kinder, A. Roggenbuck, M. Köberle, F. Lison, T. Müller-Wirts, and P. Meissner, Rev. Sci. Instr. 79, 044702 (2008).
- (16) O. Morikawa, M. Tonouchi, and M. Hangyo, Appl. Phys. Lett. 76, 1519 (2000).
- (17) A. Roggenbuck, K. Thirunavukkuarasu, H. Schmitz, J. Marx, A. Deninger, I. Cámara Mayorga, R. Güsten, J. Hemberger, and M. Grüninger, J. Opt. Soc. Am. B 29, 614 (2012).
- (18) M. Langenbach, A. Roggenbuck, I. Cámara Mayorga, A. Deninger, K. Thirunavukkuarasu, J. Hemberger, and M. Grüninger, to be publ. in J. Infrared Milli Terahz Waves (2014), arXiv:1406.6589.
- (19) M. Tani, O. Morikawa, S. Matsuura, and M. Hangyo, Semicond. Sci. Technol. 20, S151 (2005).
- (20) I.S. Gregory, W.R. Tribe, M.J. Evans, T.D. Drysdale, D.R.S. Cumming, and M. Missous, Appl. Phys. Lett. 87, 034106 (2005).
- (21) M. Scheller and M. Koch, Opt. Express 17, 17723 (2009).
- (22) C. Brenner, M. Hofmann, M. Scheller, M.K. Shakfa, M. Koch, I. Cámara Mayorga, A. Klehr, G. Erbert, and G. Tränkle, Opt. Lett. 35, 3859 (2010).
- (23) D. Molter, A. Wagner, S. Weber, J. Jonuscheit, and R. Beigang, Opt. Express. 19, 5290 (2011).
- (24) O. Morikawa, M. Fujita, K. Takano, and M. Hangyo, J. Appl. Phys. 110, 063107 (2011).
- (25) O. Morikawa, M. Fujita, and M. Hangyo, Jpn. J. Appl. Phys. 52, 112401 (2013).
- (26) M. Scheller, M. Stecher, M. Gerhard, and M. Koch, Opt. Express 18, 15887 (2010).
- (27) I. Cámara Mayorga, E.A. Michael, A. Schmitz, P. van der Wal, R. Güsten, K. Maier, and A. Dewald, Appl. Phys. Lett. 91, 031107 (2007).
- (28) A. Roggenbuck, M. Langenbach, K. Thirunavukkuarasu, H. Schmitz, A. Deninger, I. Cámara Mayorga, R. Güsten, J. Hemberger, and M. Grüninger, J. Opt. Soc. Am. B 30, 1397 (2013).