The Quenching of the Ultra-Faint Dwarf Galaxies in the Reionization Era11affiliation: Based on observations made with the NASA/ESA Hubble Space Telescope, obtained at the Space Telescope Science Institute, which is operated by the Association of Universities for Research in Astronomy, Inc., under NASA contract NAS 5-26555. These observations are associated with program GO-12549.
Abstract
We present new constraints on the star formation histories of six ultra-faint dwarf galaxies: Bootes I, Canes Venatici II, Coma Berenices, Hercules, Leo IV, and Ursa Major I. Our analysis employs a combination of high-precision photometry obtained with the Advanced Camera for Surveys on the Hubble Space Telescope, medium-resolution spectroscopy obtained with the DEep Imaging Multi-Object Spectrograph on the W.M. Keck Observatory, and updated Victoria-Regina isochrones tailored to the abundance patterns appropriate for these galaxies. The data for five of these Milky Way satellites are best fit by a star formation history where at least 75% of the stars formed by (13.3 Gyr ago). All of the galaxies are consistent with 80% of the stars forming by (12.8 Gyr ago) and 100% of the stars forming by (11.6 Gyr ago). The similarly ancient populations of these galaxies support the hypothesis that star formation in the smallest dark matter sub-halos was suppressed by a global outside influence, such as the reionization of the universe.
Subject headings:
Local Group — galaxies: dwarf — galaxies: photometry — galaxies: evolution — galaxies: formation — galaxies: stellar content1. Introduction
One of the primary quests of astronomy is understanding the formation of structure in the universe. In this regard, the Cold Dark Matter (CDM) cosmological model is consistent with many observable phenomena, but there are discrepancies at small scales (Kauffmann et al. 1993). Specifically, CDM predicts many more dark-matter sub-halos than the number observed as dwarf galaxies (e.g., Moore et al. 1999; Klypin et al. 1999) – the “missing satellite” problem. As one way of rectifying this problem, Bullock et al. (2001) put forth the idea that reionization could have suppressed star formation in the smallest DM sub-halos (see also Babul & Rees 1992), essentially by boiling the gas out of their shallow potential wells. The dearth of stars would then make these sub-halos difficult or impossible to detect. Building upon this hypothesis, Ricotti & Gnedin (2005) proposed that dwarf galaxies could follow one of three evolutionary paths: “true fossils” that formed most of their stars prior to reionization, “polluted fossils” with star formation continuing beyond reionization, and “survivors” that largely formed their stars after reionization. It is now common for galaxy formation models to alleviate the missing satellite problem by truncating the star formation in DM halos below some nominal mass threshold, sometimes termed the “filtering mass,” with this threshold tuned to match the observations (e.g., Tumlinson 2010; Muoz et al. 2009; Bovill et al. 2009, 2011a, 2011b; Koposov et al. 2009; Li et al. 2010; Salvadori et al. 2009, 2014).
| Fieldccfootnotemark: | Exposure per tile | |||||||
| R.A.aafootnotemark: | Dec.aafootnotemark: | bbfootnotemark: | Ebbfootnotemark: | Contamination | F606W | F814W | ||
| Name | (J2000) | (J2000) | (mag) | (mag) | (%) | (s) | (s) | Tiles |
| Bootes I | 14:00:04 | +14:30:47 | 19.110.07 | 0.040.01 | 7.9 | 2,340 | 2,200 | 5 |
| Canes Venatici II | 12:57:10 | +34:19:23 | 21.040.06 | 0.040.01 | 2.2 | 20,850 | 20,850 | 1 |
| Coma Berenices | 12:27:21 | +23:53:13 | 18.080.10 | 0.040.01 | 24 | 2,340 | 2,200 | 12 |
| Hercules | 16:31:05 | +12:47:07 | 20.920.05 | 0.090.01 | 6.1 | 12,880 | 12,745 | 2 |
| Leo IV | 11:32:57 | -00:31:00 | 21.120.07 | 0.080.01 | 3.7 | 20,530 | 20,530 | 1 |
| Ursa Major I | 10:35:04 | +51:56:51 | 20.100.05 | 0.050.01 | 17 | 4,215 | 3,725 | 9 |
| aCenter of ACS observations. | ||||||||
| bApparent distance moduli and extinctions are determined from fits to the ACS data. | ||||||||
| cContamination near the upper MS, based upon the Besançon Galaxy model (Robin et al. 2003). | ||||||||
Over the same time period, wide-field surveys revealed the existence of additional dwarf satellites around the Milky Way (e.g., Willman et al. 2005; Zucker et al. 2006; Belokurov et al. 2007) and Andromeda (e.g., Zucker et al. 2004, 2007; McConnachie et al. 2009; Majewski et al. 2007; Irwin et al. 2008; Martin et al. 2009). The ultra-faint dwarf (UFD) galaxies have luminosities of mag (; Martin et al. 2008b), and thus most are fainter than the typical globular cluster. Photometric and spectroscopic observations of the UFD galaxies have shown that they are excellent candidates for demonstrating the existence of fossil galaxies. Color-magnitude diagrams (CMDs) indicate the UFDs are generally dominated by old (10 Gyr) populations (e.g., Sand et al. 2009, 2010; Okamoto et al. 2008, 2010, 2012; de Jong et al. 2008b; Hughes et al. 2008; Martin et al. 2008a; Greco et al. 2008; Muñoz et al. 2010; Weisz et al. 2014b), while spectroscopy of their giant stars indicates low metallicities, but with a dispersion significantly larger than the measurement errors (Frebel et al. 2010; Norris et al. 2010; Kirby et al. 2008, 2011, 2013). The internal kinematics from such spectroscopy also imply large mass-to-light ratios (; e.g., Kleyna et al. 2005; Muñoz et al. 2006; Martin et al. 2007; Simon & Geha 2007). Because even the most massive globular clusters have ratios consistent with little to no dark matter (e.g., Baumgardt et al. 2009; van de Ven et al. 2006; Bradford et al. 2012), the high in the UFDs is one of the characteristics that marks them as galaxies, instead of star clusters, despite their low luminosities. Another distinction with most star clusters is the fact that the stellar populations of galaxies exhibit spreads in age and metallicity. Given their low metallicities, old ages, faint luminosities, and high ratios, the UFDs are an excellent laboratory to search for reionization signatures in the star formation history (SFH) of small DM sub-halos, and to assess the possible solutions to the missing satellite problem.
In this paper, we present new constraints on the SFHs of six UFD galaxies: Bootes I (Boo I), Canes Venatici II (CVn II), Coma Berenices (Com Ber), Hercules, Leo IV, and Ursa Major I (UMa I). Our analysis focuses on high-precision photometry, from the Advanced Camera for Surveys (ACS) on the Hubble Space Telescope (HST), and new medium-resolution spectroscopy, from the DEep Imaging Multi-Object Spectrograph (DEIMOS) on the W.M. Keck Observatory. We interpret these data using a new isochrone grid generated with the Victoria-Regina code (VandenBerg et al. 2012), employing the latest physics, and assuming abundance profiles appropriate to the extremely metal-poor populations of the UFDs.
2. Observations and Data Reduction
2.1. Hubble
2.1.1 Observations
From Aug 2011 through Jun 2012, we obtained deep optical images of each galaxy in our sample (Table 1) using the F606W and F814W filters on ACS (GO-12549; PI Brown). A preliminary analysis of the earliest observations in this program was given by Brown et al. (2012). These galaxies were chosen to provide a representative sample of UFDs with integrated luminosities well below those of the classical dwarf spheroidals, but bright enough to provide sufficient numbers of stars for the SFH analysis. Specifically, the goal was to obtain photometry with a high signal-to-noise ratio () for 100 stars within 1 mag of the main sequence (MS) turnoff, thus cleanly defining the upper MS, subgiant branch (SGB), and lower red giant branch (RGB), and allowing sub-Gyr precision in relative ages. The turnoff has long been a reliable clock for the dating of stellar populations (e.g., Iben & Renzini 1984; VandenBerg et al. 1990), becoming fainter and redder at increasing age, but the changes are subtle at old ages. For example, at [Fe/H]= and 12 Gyr, an age increase of 1 Gyr shifts the turnoff 0.09 mag fainter in and 0.01 mag redder in . Although there is no age information below the turnoff, obtaining high SNR photometry at the turnoff produces photometry with a faint limit below 0.5 on the MS, enabling measurements of the stellar initial mass function (IMF; see Geha et al. 2013). Because their distances and apparent sizes span a wide range, the observing strategy for each galaxy was tailored to obtain photometry of similar quality in each galaxy, surveying a wide but shallow area in the relatively nearby satellites (e.g., Com Ber), and a narrow but deep pencil beam in the more distant satellites (e.g., CVn II).
2.1.2 Reduction
The images were processed with the latest pipeline updates, including a pixel-based correction (version 3.2) for charge-transfer inefficiency (CTI; Anderson & Bedin 2010) resulting from radiation damage to the ACS detectors. The individual exposures were dithered to enable resampling of the point spread function (PSF), mitigation of detector artifacts (hot pixels, dead pixels), and cosmic ray rejection. The exposures for each tile in each band were coadded with the drizzle package (Fruchter & Hook 2002), using the tweakshifts routine to iteratively solve for the offsets between individual images. This process produced geometrically-correct images with a scale of 0.035′′ pixel-1 and an area of approximately .
2.1.3 Photometry
We performed both aperture and PSF-fitting photometry using the DAOPHOT-II package (Stetson 1987), assuming a spatially-variable PSF constructed from isolated stars. The final catalog combined aperture photometry for stars with photometric errors 0.01 mag and PSF-fitting photometry for the rest, with both normalized to an infinite aperture. Due to the scarcity of bright stars, the uncertainty in the normalization to an infinite aperture is 0.02 mag. For the three nearest galaxies (Com Ber, Boo I, and UMa I), the scarcity of bright stars in any individual tile hampered the construction of an accurate PSF model, so a spatially-dependent PSF model for each galaxy was constructed from all of the tiles in a given band, selecting isolated bright stars from each tile. For Hercules, there were enough stars to construct an independent PSF model in each of the two tiles, but then the normalizations of those PSF models were adjusted to give agreement between the two tiles. Similarly, the single tiles obtained in Leo IV and CVn II were sufficiently populated to construct spatially-dependent PSF models for each. Our photometry is in the STMAG system: log. The catalogs were cleaned of background galaxies and stars with poor photometry using the of the PSF fitting, the PSF sharpness, and photometric errors. Stars were also rejected if they fell within the wings of brighter neighbors or within the extent of a background galaxy. After all the cuts were applied, between 12% and 35% of the sources were rejected from each catalog, largely near the faint limit.
Transformation from the HST photometric system to a ground-based system incurs significant systematic errors, as explored by Sirianni et al. (2005). For this reason, a direct comparison between our photometry and previously-published catalogs is of limited utility. However, for one galaxy in our sample (CVn II), a catalog with bands that overlap with our own ( and ) is publicly available (Sand et al. 2012). The transformations in Sirianni et al. (2005) do not reflect the updates to the ACS calibration after the last HST servicing mission, but we can derive our own transformations, using the available throughput curves in each system and the synthetic spectral library of Gustafsson et al. (2008). Doing so, we find that the photometry of the brightest stars in our catalog (20–23 mag) agrees with the Sand et al. (2012) photometry of these same stars at the level of 0.03 mag. This comparison demonstrates that there are no gross calibration differences between the HST photometry and previously published photometry from the ground.
To properly account for the photometric errors and completeness, we performed artificial star tests using the same photometric routines that were employed for the photometric catalogs. During such tests, one does not want to affect the crowding of the images, so small numbers of artificial stars were repeatedly added to each image and then blindly recovered, until there were over 5,000,000 artificial stars for each galaxy. To ensure that the noise in the artificial stars accurately represented that in the data in this high SNR regime, we included detector effects that would not be experienced by an artificial star simply inserted into the images and recovered. We assumed a residual flat fielding error of 1% (Gonzaga et al. 2014), and inserted artificial stars with the reduction in signal appropriate for the CTI that a real star would encounter at that signal level and background in each image (using the forward-modeling CTI software that is included in the CTI correction package). Although CTI losses in both real and artificial stars can be corrected to the appropriate flux level, these corrections do not recover the loss of SNR, because measurements still have the shot noise on the reduced signal. Neglecting this effect in the artificial star tests would make the photometry of artificial stars slightly less noisy than that of the real stars at the same magnitude.
2.1.4 Color-Magnitude Diagrams
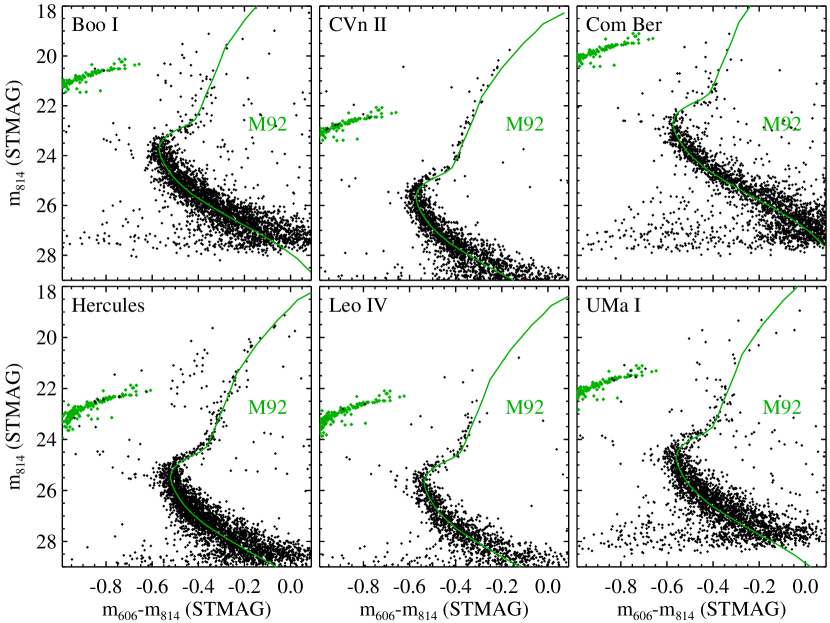
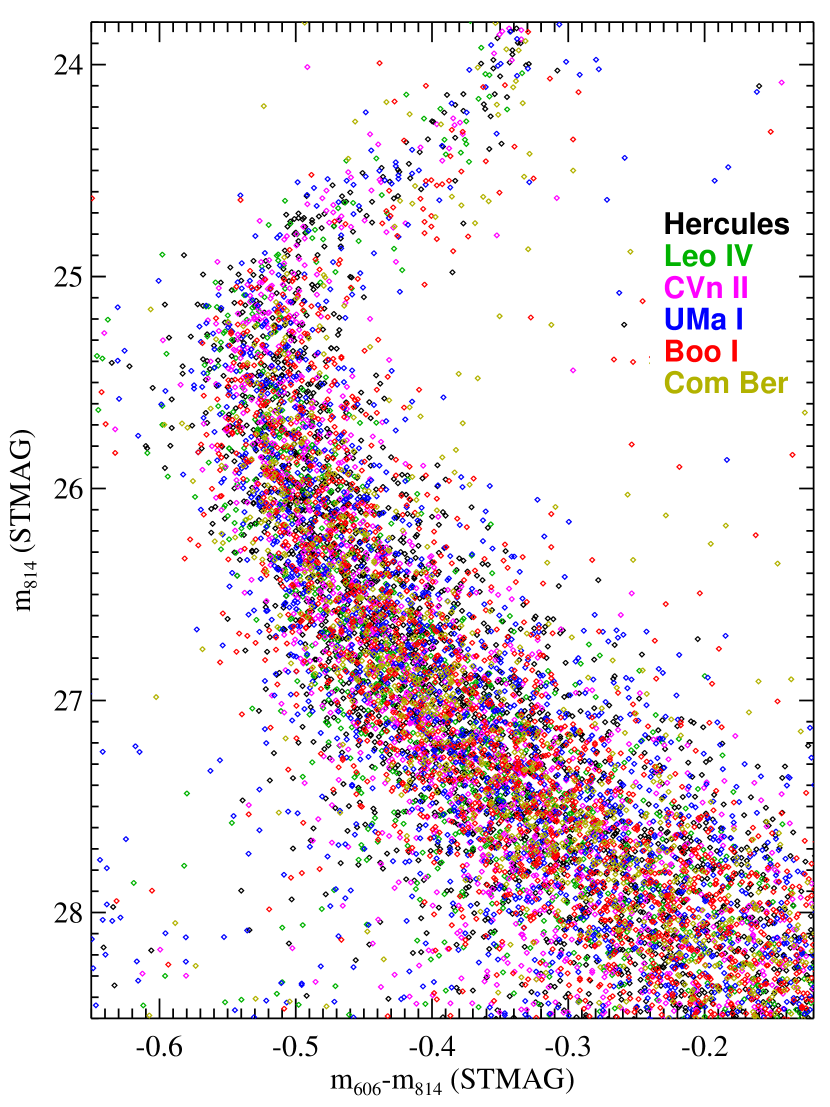
The CMD of each galaxy in our survey is shown in Figure 1. Two aspects of these CMDs are immediately apparent. First, the tight stellar locus of each CMD resembles that of a Galactic globular cluster, as will be discussed in the next section. Second, the CMDs all appear extremely similar to each other, implying the population ages and metallicities are also similar. In Figure 2, we show the composite CMD for all 6 galaxies in our sample, each shifted to the same distance and reddening (see §3.1), and focused on the CMD region most sensitive to age (i.e., the MS turnoff and SGB). To the eye, each UFD appears to be dominated by an ancient metal-poor population.
Further inspection of the CMDs reveals other details worth noting. Field contamination is high for those relatively nearby galaxies that were observed in several tiles (Com Ber, Boo I, and UMa I), and is apparent from the scattering of stars beyond the main stellar locus. The level of field contamination in the vicinity of the upper MS, where we fit the SFH, can be estimated by transforming the Besançon Galaxy model (Robin et al. 2003) to the ACS bands used here, and is reported in Table 1. The contamination depends upon the surface brightness of each galaxy, and scales with the number of tiles observed. There are also a few blue straggler (BS) stars apparent in each CMD, falling to the blue and extending brighter than the dominant MS turnoff. Although BS stars are common in ancient populations, they can mimic a much younger sub-population. For example, the turnoff mass at 12–13 Gyr is 0.8 , but BS stars can be up to twice as large, which would not normally appear on the MS for populations older than 2 Gyr. The BS frequency is generally expressed relative to that of horizontal branch (HB) stars. In globular clusters, typically ranges from 0.1 to 1 (e.g., Piotto et al. 2004; Ferraro et al. 2014). In the Galactic halo, Preston & Sneden (2000) find a much higher ratio: = 4.4. In low-luminosity dwarf galaxies, Momany et al. (2007) find ranging from 1 to 4, and Santana et al. (2013) found the frequency of BS stars to be similar in UFDs and the classical dwarf spheroidals. For the UFD CMDs here, our statistics on both BS stars and HB stars are too poor to give strong constraints on the BS frequency; assuming that HB stars cannot fall more than 0.2 mag below the expected HB locus, we estimate that . BS stars are largely excluded from our fits, except for any that might lie immediately adjacent to the dominant MS.
2.2. Keck
2.2.1 Observations
Metallicities for limited samples of stars in five of the six UFDs targeted with HST were determined by Kirby et al. (2008), Kirby et al. (2011), and Vargas et al. (2013), based on the medium-resolution (1.37 Å FWHM) Keck spectroscopy of Simon & Geha (2007). However, fewer than 16 measurements were available in every galaxy except UMa I, and Simon & Geha (2007) did not observe Boo I at all. To improve the constraints on the metallicity distributions (which, in turn, improve the constraints on the ages determined from the HST photometry), we obtained new Keck/DEIMOS spectroscopy for larger samples of stars in Leo IV, Com Ber, CVn II, Boo I, and Hercules. On the nights of 2013 March 10–11, 2013 April 12, and 2013 May 3–4, we observed a total of 13 slit masks, with typical integration times of 1–3 hr. Conditions during the observations ranged from good to poor. Mask design and calibration procedures followed those established by Simon & Geha (2007), Geha et al. (2009), and Simon et al. (2011). For Hercules and Com Ber, we also include several slit masks observed in 2010 and 2011 that have not yet been published. Note that the spectroscopic samples were targeted and analyzed using ground-based photometry, instead of the HST/ACS photometry described above. The small HST field of view is insufficient for multi-object spectroscopic selection, and much of the Keck analysis preceded the HST/ACS observations.
2.2.2 Reduction
The spectroscopic data were reduced with our slightly modified versions of the DEEP2 pipeline (Cooper et al. 2012), as described in Simon & Geha (2007). We measure stellar metallicities using the large number of neutral iron lines included in our spectral range ( Å). We match each spectrum against a grid of synthetic spectra sampling a wide range in [Fe/H], [/Fe], log , and (Kirby 2011). Prior to fitting, we degrade the synthetic spectra to the DEIMOS resolution. We excise wavelength regions affected by telluric contamination, strong sky emission lines, and regions improperly synthesized due to NLTE effects (Ca triplet and Mg I 8807).
2.2.3 Metallicities
We determine the best-fitting and [Fe/H] values simultaneously from minimization of the pixel-by-pixel flux difference between the observed spectra and the synthetic grid, using only spectral regions sensitive to variations in Fe abundance. We separately fit [/Fe] using regions sensitive to Mg, Si, Ca, and Ti variations. We then refit the Fe abundance while fixing [/Fe].
The uncertainty in [Fe/H] includes two components. The random component is the 1 error in [Fe/H] from the fitting, accounting for the non-zero covariance between and [Fe/H]. A systematic error floor of 0.11 dex is added in quadrature to the random errors for individual stars. It reflects the non-vanishing difference between DEIMOS and high-resolution [Fe/H] measurements in the limit of very small random errors (high SNR). We refer the reader to Kirby et al. (2010) and Vargas et al. (2013) for an in-depth description of the analysis.

2.2.4 Membership
We determined the membership status of stars in each sample using a refined version of the approach adopted by Simon & Geha (2007) and Simon et al. (2011), in which all of the available data for each star, including its velocity, color, magnitude, metallicity, position, and spectrum, were examined by eye. Photometry was extracted from Sloan Digital Sky Survey (SDSS) Data Release 9 (Ahn et al. 2012) or Data Release 10 (Ahn et al. 2014) for each galaxy, and for the particularly sparse UFDs Leo IV and CVn II, we supplemented the SDSS data at faint magnitudes with photometry from Sand et al. (2010) and Sand et al. (2012), respectively. For Boo I, Com Ber, Hercules, and UMa I, the photometric selection was based on an CMD and an M92 fiducial sequence in similar bands from Clem (2006). For Leo IV, Sand et al. (2010) provide much deeper photometry in and , so we used an CMD and the corresponding M92 fiducial track. For CVn II, the Sand et al. (2012) photometry is in and , so we transformed the SDSS magnitudes to those bands with the relations derived by Jordi et al. (2006) for metal-poor stars and compared to a theoretical isochrone (Dotter et al. 2008) for an age of 12 Gyr and [Fe/H], which matches the RGB well. For Hercules, we also made use of the Strömgren photometry from Adén et al. (2009) to separate RGB member stars from foreground dwarfs. At bright magnitudes, where the photometric uncertainties are small ( mag), the selection window extends 0.1 mag redward and blueward from the M92 fiducial or isochrone. At fainter magnitudes, the SDSS errors increase substantially, and so the selection window is gradually widened to 0.32 mag away from the fiducial/isochrone at mag. The Sand et al. (2010) photometry for Leo IV and CVn II is deep enough that the photometric uncertainties are negligible even at the faintest magnitudes of interest for spectroscopy, so the selection window remains at 0.1 mag at all magnitudes for those galaxies. Stars located outside the selection window are considered photometric non-members, with the exception of one star in Hercules – a known spectroscopic member from Koch et al. (2008), despite being 0.11 mag redder than the M92 track.
Stars with velocities more than three standard deviations away from the galaxy’s systemic velocity were classified as non-members, with the exception of suspected binaries (based on large velocity differences compared to previous measurements). We only measure metallicities for two of these velocity outliers, both RGB stars in Boo I with velocities that vary by more than 30 km s-1 from Koposov et al. (2011); the remainder cannot be constrained by our data because of their high temperatures and/or the low SNR of their spectra. We do not make hard cuts on position, metallicity, or Na I equivalent width, but stars that are outliers (even if not beyond the formal limits in color or velocity) in multiple categories are less likely to be judged as members.
Our final metallicity distribution function (MDF) for each galaxy was constructed from the set of RGB stars with valid [Fe/H] fits, relatively low surface gravities (log ), and secure membership. In these metal-poor galaxies, HB stars tend to fall far to the blue of the RGB. Blue HB stars (hotter than K) exhibit abundance anomalies due to atmospheric diffusion (e.g., Grundahl et al. 1999), and are excluded from our sample, but a few red HB stars overlapping with the RGB may be included. Membership for a large majority of the observed stars is obvious and thus secure, but there will always be stars whose membership is more ambiguous. For example, some stars are near the edge of the color selection region, their velocities are several standard deviations away from the systemic velocity, and/or they are located at large radii, any of which increases the likelihood of confusing a foreground star with a UFD member. Fortunately, if we include the handful of stars where membership is questionable, the resulting MDFs are not significantly changed, and the effect on the SFH fitting is small. The MDFs for each galaxy are shown in Figure 3, using a metallicity grid spanning [Fe/H] = to with 0.2 dex spacing, matching the metallicity grid of the isochrone set used for the SFH fits.
2.2.5 Modeling the Metallicity Distribution Function
To account for the MDF uncertainties in our SFH fitting, we used a Bayesian approach to construct a probabilistic MDF (PMDF) associated with each UFD, where the probabilities are those for the true intrinsic MDF. The PMDF enables the generation of artificial MDFs through Monte Carlo realizations. We constructed the PMDF as a piecewise constant function on the same metallicity grid defined for the observed MDFs and employed in the SFH fits. The likelihood for the true metallicity of each star is approximated as a Gaussian that is centered on the measured metallicity, with a width matching the metallicity error. The relative weights in the PMDF were estimated using an adaptive Markov Chain Monte Carlo (MCMC) algorithm, run 10 times for each UFD, with realizations per run. We then constructed the PMDF from the draws beyond the first in each run, after the draws had stabilized. The resulting PMDFs are shown in Figure 3. In general, they match the MDFs well, but there are distinctions because the MCMC takes into account the distinct measurement errors on individual stars. The latter are very heterogeneous, depending upon several factors (magnitude of the star, observing conditions, metallicity, etc.). For this reason, the direct comparison of the MDF and the PDMF can be slightly deceptive, because the histogram hides the true error distribution.
3. Analysis
3.1. Comparison with M92
An inspection of the photometric (Figure 1) and spectroscopic (Figure 3) data demonstrates that the stellar populations in our UFD sample are ancient and metal-poor. Before we explore the quantitative SFH fitting for each UFD, it is worth making a comparison to a well-studied population. An appropriate object is the Galactic globular cluster M92 – one of the most ancient and metal-poor stellar systems known. Of the globular clusters with little extinction, it is the most metal-poor (Harris 1996), and it has served as a reference population in previous studies of UFDs (e.g., Belokurov et al. 2006, 2007, 2009, 2010; Okamoto et al. 2008, 2012; Sand et al. 2009, 2010, 2012). It was observed with the same camera and filters by Brown et al. (2005), and its CMD is shown in Figure 4. We assume the cluster has a true distance modulus of mag, taking the mean of measurements from Paust et al. (2007; 14.600.09 mag), Del Principe et al. (2005; 14.620.1 mag), and Sollima et al. (2006; 14.650.1 mag). We assume = 0.023 mag (Schlegel et al. 1998), and [Fe/H] = (Harris et al. 1996). Comparison of the M92 CMD to those in our UFD sample requires that M92 be shifted in distance and reddening to match those parameters for each UFD.
We determine the distance and reddening to each UFD in our sample by fitting the HB luminosity and the MS color for stars more than 0.5 mag below the turnoff (and thus insensitive to age assumptions). In our preliminary analysis of 3 galaxies in this sample, we used the RGB instead of the lower MS to constrain the color (Brown et al. 2012), but the RGB is not well populated in all of our CMDs, and suffers from significant field contamination, so we altered our approach here. For the HB fit, we used the empirical HB locus for M92, because the metallicity of the cluster falls within the MDF for each galaxy, and the HB luminosity is a well-known standard candle. For the MS fit, we used synthetic MS loci, constructed from 13 Gyr isochrones (VandenBerg et al. 2012), assuming the MDF for each galaxy (Figure 3), a binary fraction of 48% (Geha et al. 2013), and the photometric errors determined via the artificial star tests. Unfortunately, no HB stars were detected in Com Ber, and so the fit is only constrained by the lower MS, resulting in larger uncertainties. Our derived distances and reddenings are listed in Table 1. For Hercules, Leo IV, and UMa I, the values are extremely close to those we determined in our preliminary analysis of these galaxies (Brown et al. 2012), but not identical, due to the reprocessed photometry and distinct fitting method here. The distance and reddening uncertainties are only those associated with the fits to our UFD photometry, and do not include systematic errors associated with the M92 distance and reddening, the isochrones, or MDFs. For example, the distance to M92 is uncertain at the level of 0.1 mag, and if we adopted a distinct M92 distance, all of our distances would shift accordingly. The apparent distance moduli, , are in good agreement with the values collected by Martin et al. (2008b), although in general our reddenings are larger and distances are smaller. More recent measurements for four of our galaxies (Musella et al. 2009, 2012; Moretti et al. 2009; Garofalo et al. 2013) also report similar apparent distance moduli through a combination of larger reddenings and smaller distances. If, instead, we were to adopt a combination of larger distances and smaller reddenings, both M92 and the isochrones would fall too far to the blue, relative to the MS and RGB in each UFD CMD.

The comparisons between the CMD of M92 and that of each UFD are shown in Figure 1. Due to the scarcity of HB stars in each UFD CMD, these can be shown on top of the HB locus of M92 without confusion. However, the earlier evolutionary phases in each UFD are well populated, so for clarity, the MS-SGB-RGB stellar locus of M92 is shown as a ridge line (see Figure 4; Brown et al. 2005). Although there are few HB stars in the CMD of each UFD, there is good agreement between these HB stars and those of M92, because the distance to each UFD was determined using the HB as a standard candle. Comparing the MS turnoff and SGB of M92 to those of each UFD (Figure 1), there is agreement to first order, implying that the dominant population in each UFD is as old as the metal-poor globular clusters of the Milky Way. However, the UFD stars in the vicinity of the turnoff extend bluer and brighter than the M92 ridge line, as one would expect from their MDFs (Figure 3), which extend to metallicities well below that of M92. The UFD RGB stars also scatter to the blue of the M92 ridge line, although it is difficult to quantify, given the contribution of the asymptotic giant branch stars and field contamination. Furthermore, the lower MS of each UFD scatters to the red of the M92 ridge line, but this is because of the difference in binary fraction. Like the dwarf spheroidals (e.g., Minor 2013) and the Galactic field (e.g., Duquennoy & Mayor 1991), the UFDs have a binary fraction of nearly 50% (Geha et al. 2013) – much higher than the binary fraction in M92 (2%; Milone et al. 2012), which has been reduced through dynamical evolution (e.g., Ivanova et al. 2005). To explore the UFD CMDs further, we proceed to synthetic CMD analysis.
3.2. Comparison with Isochrones
Globular clusters are useful empirical population templates for comparison to the UFDs, but the known clusters do not span the full range of age and metallicity required to quantitatively analyze the UFD populations. In particular, the UFD populations extend to much lower metallicities (Figure 3). For this reason, our quantitative analysis employs theoretical models. To generate these models, we use the Victoria-Regina isochrone and interpolation codes (VandenBerg et al. 2012; VandenBerg et al. 2014a), which were developed for a wide range of stellar population studies, but have a long history in the study of old metal-poor populations (e.g., Bergbusch & VandenBerg 1992; VandenBerg et al. 2000; VandenBerg et al. 2006).
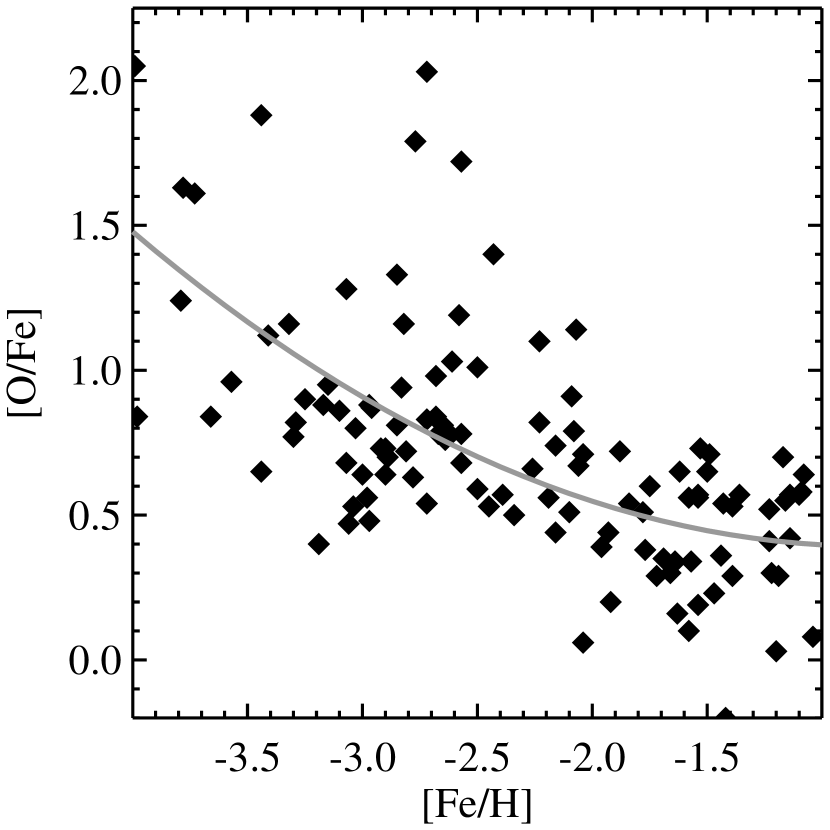
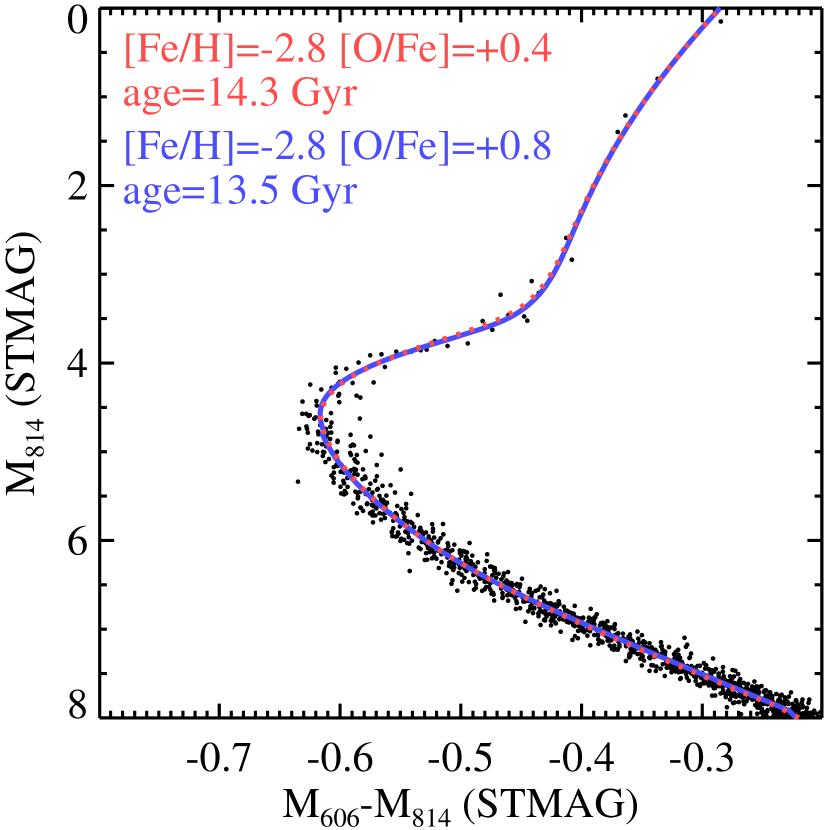
We calculated an isochrone grid spanning [Fe/H] , with 0.2 dex steps, and age Gyr, with 0.1 Gyr steps. The Victoria-Regina library is available with both scaled-solar abundances and an enhancement of +0.4 for the -elements (O, Ne, Mg, Si, S, Ca, and Ti). We assume [/Fe] = +0.4, as appropriate for old metal-poor populations, such as those in the Galactic halo and satellites. While this is certainly appropriate for most of the UFD population, for the minority of stars at [Fe/H], there is some indication that the UFDs may have [/Fe] values that are 0.1–0.2 dex lower (Vargas et al. 2013). If we adopted such -element abundances for the most metal-rich stars, the ages for such stars in our fits would be 0.2–0.4 Gyr older, specifically due to the change in oxygen abundance, which affects the rate of the CNO cycle. Because of its impact on nucleosynthesis (rather than opacity), the oxygen abundance affects the MS lifetime, and thus the relation between turnoff luminosity and age. For the analysis here, we calculated new grids with the oxygen abundance enhanced beyond the abundances of the other -elements. In stars of the diffuse halo, [O/Fe] appears to increase at decreasing metallicities (Figure 5; Frebel 2010). The isochrone that matches a particular CMD will be younger as the oxygen abundance increases, with a difference of 1 Gyr per 0.5 dex change in [O/Fe] (Figure 6). The measurements of [O/Fe] vs. [Fe/H] have significant scatter, such that our adopted [O/Fe] values are uncertain at the level of 0.2 dex, corresponding to an absolute age uncertainty of 0.4 Gyr. However, if we were to adopt a standard [O/Fe] of +0.4, as frequently assumed for all -elements when modeling old populations, the resulting ages in our SFH fits would be significantly older. Given their utility in the study of metal-poor populations, the isochrones with larger [O/Fe] values will be published in a later paper (VandenBerg et al., in prep.).
The transformation of the Victoria-Regina isochrones into the ACS bands is done via a method similar to that of Brown et al. (2005), although the transformation has been revised to account for subsequent updates to the isochrone code (VandenBerg et al. 2012) and the library of synthetic spectra employed (Gustafsson et al. 2008). Compared to the previous version of the isochrone code (VandenBerg et al. 2006), the current version includes the effects of He diffusion, new H-burning nuclear reaction rates, and the adoption of the Asplund et al. (2009) solar metals mixture. With these updates and our assumed parameters for M92, the isochrones match the M92 CMD at an age of 13.2 Gyr (Figure 4), and so the ages in our SFH fits to the UFD CMDs should be considered as relative to this age of M92. The absolute age of M92 is itself uncertain at the level of 1 Gyr, given the uncertainties in composition, reddening, and distance. For example, VandenBerg et al. (2014b) prefer a younger age of 12.5 Gyr, due to a longer assumed distance.
To fit the observed UFD CMDs, we must convert the isochrone grid into a set of synthetic CMDs having the same photometric properties as the observed UFD CMDs. These photometric properties (scatter and completeness) were determined via extensive artificial star tests (§2.1.3). Each synthetic CMD was constructed using the synth routine of Harris & Zaritsky (2001), which takes the isochrone library and artificial star tests as input. Each synthetic CMD represents a stellar population at a single age and metallicity, such that linear combinations of these synthetic CMDs can be used to fit the observed UFD CMDs. The synthetic CMD set for each galaxy is calculated using the measured distance and reddening values, and also includes a fixed field contamination component (Table 1). The contamination was determined from the Besançon Galaxy model (Robin et al. 2003) along the sightline to each galaxy, converted to the ACS bands using the same synthetic spectra employed in the isochrone conversion (Gustafsson et al. 2008).
We fit the CMDs through the minimization of a Poisson maximum likelihood statistic (PMLS), and evaluate the best fit through quality () and criteria, each defined in Dolphin (2002; respectively eqs. 10, 23, and 24). evaluates the PMLS of the best fit (corrected by the number of free parameters) with respect to the PMLS distribution, and is given in terms of ; e.g., implies the best fit is 1 worse than a typical fit in the center of the PMLS distribution. is analogous to the reduced value in classical minimization, with values close to unity implying a good fit. To determine the PMLS distribution, we perform fits to 104 Monte Carlo realizations of the photometric and spectroscopic data for each galaxy. The artificial realization of the photometric data is a random draw on the best-fit CMD model that results from the synthetic CMD fitting of the observed UFD CMD. The artificial realization of the spectroscopic data is a random draw on the PMDF estimated in §2.2.5.
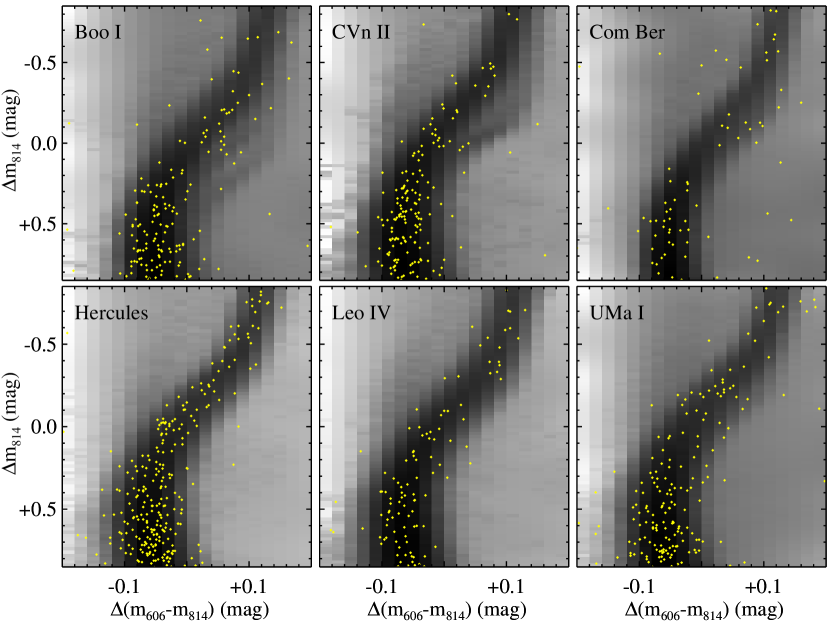
We restrict our SFH fits to that part of the CMD from the MS turnoff through the top of the SGB (Figure 7). By doing so, we avoid those parts of the CMD insensitive to age, such as the RGB and lower MS, which would otherwise dilute the impact of age variations on the fit. The restriction also has other motivations. By avoiding the lower MS, we restrict the fit to a small mass range (0.1 ), thus minimizing the sensitivity to the assumed IMF. By avoiding CMD regions where few or no stars are observed, and where few or no stars are predicted by the models, we prevent artificially enhancing the quality of the best fit, because the agreement between data and models in empty CMD regions is irrelevant (e.g., see discussion in Dolphin 2002). Finally, we avoid the BS sequence, which would otherwise mimic a minority population component far younger than the dominant population; as explained in §2.1.4, there are a few BS stars in each UFD CMD, with the ratio of BS to HB stars 2, similar to that observed in the Galactic halo and other dwarf galaxies. The identical region is fit in the CMD of each galaxy, with the region boundaries shifted from galaxy to galaxy using the reddening and distance to each galaxy. For the IMF power-law slope and binary fraction, we assume and 48%, respectively, previously derived for Hercules (Geha et al. 2013). However, because the fitting region is restricted to the upper MS and SGB, these choices are not important. For example, values of for the IMF power-law slope or 38% for the binary fraction lead to negligible differences in the resulting SFH (0.2 Gyr shifts in age).
Comparison of the observed CMDs to the synthetic CMDs demonstrates that the observed CMDs can be reproduced with a very simple model, comprised of two episodes of star formation. Specifically, the fit has 3 parameters: the ages of the two components, and the fraction of star formation in each. Each episode is a single-age population, but can have a range of metallicities. The metallicities in the fit are fixed to match the observed spectroscopic MDF, with the constraint that the metallicity monotonically increases at younger ages. The parameters of the best-fit model are listed in Table 2. In Figure 7, we show a comparison of the observed UFD CMDs to the best-fit synthetic CMDs, each represented as a two-dimensional distribution of probability density.
In general, the fits are excellent, particularly when one considers the simplicity of the 3-parameter model and the fact that the metallicities are constrained in the fits. Adding two additional parameters to the fit for each galaxy, varying the duration of star formation in each of the two bursts, does not improve the fit quality. The resulting 5-parameter fits minimize the duration of star formation in each burst and do not improve the PMLS, underscoring the preference for a narrow age range in each burst.
The two-burst model is a better match to each CMD than a model with a single burst, and has the advantage of quantifying the possible contribution of a minority population. However, a single burst of star formation cannot be ruled out from these data. This is not surprising, if one inspects the results of Table 2. For Boo I, the two components are essentially the same age. For CVn II, Com Ber, Hercules, and Leo IV, the younger component is small (25% of the population). If the SFH fit to each CMD is forced to a single age, the result is within 0.2 Gyr of the mean age in a two-burst model (within the uncertainties on the mean age; see Table 2), with less than 1 of degradation in fit quality. Furthermore, in the fits to the Monte Carlo realizations, a small but non-negligible fraction of the fits (20% of the time) result in an essentially single-age population, with both components having ages within 0.5 Gyr of each other.
| Ageaafootnotemark: | Fraction | Ageaafootnotemark: | Fraction | Mean | |||
| Component 1 | Component 1 | Component 2 | Component 2 | Agebbfootnotemark: | |||
| Name | (Gyr) | (%) | (Gyr) | (%) | (Gyr) | () | |
| Bootes I | 13.4 | 3 | 13.3 | 97 | 13.30.3 | 1.05 | +0.9 |
| Canes Venatici II | 13.8 | 95 | 10.6 | 5 | 13.60.3 | 0.99 | -0.2 |
| Coma Berenices | 14.0 | 96 | 11.1 | 4 | 13.90.3 | 1.09 | +1.8 |
| Hercules | 13.7 | 82 | 10.6 | 18 | 13.10.3 | 0.98 | -0.3 |
| Leo IV | 13.7 | 77 | 11.2 | 23 | 13.10.4 | 1.01 | +0.2 |
| Ursa Major I | 14.1 | 45 | 11.6 | 55 | 12.70.3 | 1.02 | +0.3 |
| aRelative to an M92 age of 13.2 Gyr. | |||||||
| bMean age of the two-component model, with statistical uncertainties only. | |||||||
When comparing the best-fit models for each galaxy (Table 2), the fit quality is a bit better than expectations for CVn II and Hercules, but their PMLS scores are still well within the distribution from the Monte Carlo runs. The worst fit is that for Com Ber, which is 1.8 worse than the median PMLS score in the Monte Carlo runs, although a 1.8 outlier is not unreasonable for a sample of six galaxies. The Com Ber dataset is by far the most problematic in our survey. Despite the large number of tiles used to observe the galaxy, its CMD is poorly populated, its distance is not well constrained (with no HB stars in the CMD), and the large number of tiles led to a high field contamination (24%).
The uncertainties in the fit can be derived from the Monte Carlo fits to artificial realizations of the CMD and MDF. Using the results of these Monte Carlo fits, the statistical uncertainty on the mean age of the population is well-defined, and included in Table 2 for each best-fit model. However, the uncertainties on the age and fraction for each of the two population components are not well-defined, because the fraction and age are strongly correlated. The older component has a standard deviation of 0.2–0.6 Gyr in the Monte Carlo runs for each galaxy. The age of the younger component varies much more widely (standard deviations of 1.1–1.8 Gyr), because in many of the Monte Carlo runs, the younger component is only a trace population (10%). For example, in the best-fit model for Boo I, the two components are nearly identical in age, with most of the weight in the slightly younger component (see Table 2). If we restrict the analysis to those Monte Carlo runs where this younger component is dominant (50%), the standard deviation in the age of the second component is 0.4 Gyr, but if we include those runs where the second component is only a trace population, the standard deviation is 1.7 Gyr. For these reasons, the uncertainties on the individual components are best expressed in a plot of cumulative SFH for each galaxy, shown in Figure 8. In such a plot, the fraction of the population that can fall in the second component quickly dwindles as the age of this component falls below 12 Gyr.
For each of the best-fit models, a significant fraction of the population is approximately as old as the universe, as measured in the 9-year results from the Wilkinson Microwave Anisotropy Probe (WMAP; 13.750.085 Gyr; Hinshaw et al. 2013). Although the oldest stars in the best-fit model formally exceed the age of the universe for Com Ber and UMa I, the exceedances are not significant when one considers the statistical and systematic uncertainties involved. As far as the statistical uncertainties are concerned, there is almost no difference in fit quality between the models derived above and ones that are bounded by the age of the universe. The systematic uncertainties associated with our modeling are even larger than the statistical uncertainties, and are primarily related to the oxygen abundance and distance moduli assumed in the fits. If we were to assume distance moduli that are 0.05 mag shorter or longer, the resulting ages would shift 0.5 Gyr older or younger, respectively. If we were to assume [O/Fe] values that are 0.2 dex lower or higher, the resulting ages would shift 0.4 Gyr older or younger, respectively. For this reason, the SFH fits we present here are best considered as relative ages with respect to an M92 that is 13.2 Gyr old.
The three most distant galaxies in our sample were also observed with the Wide Field Planetary Camera 2 (WFPC2) on HST. Although the WFPC2 data are noisier at the MS turnoff than the ACS data we present here, Weisz et al. (2014b) fit the SFHs for these three galaxies from the WFPC2 CMDs, and found similar results to our own for Hercules and Leo IV, with 70% of the SFH occurring by 12 Gyr. In contrast, they found CVn II to be significantly younger, with 70% of the stars older than 10 Gyr, and a tail to even younger ages. The distinction is puzzling, because WFPC2 observations of CVn II fall completely within the ACS observations, albeit with half the areal coverage, 4 times less throughput, and 4 times less exposure time. Their finding of younger stars in CVn II does not seem to be due to distance assumptions. Weisz et al. (2014a) assume apparent distance moduli for CVn II, Hercules, and Leo IV that are 0.06, 0.05, and 0.2 mag shorter than our own (and similarly shorter than those of Martin et al. 2008b). All else being equal, this would make their ages about 0.5 Gyr older than our ages for CVn II and Hercules, and about 2 Gyr older for Leo IV, but the offsets in distance modulus for Hercules and CVn II are nearly identical. They used a distinct set of isochrones, but this would not give an offset with only one galaxy. They assume the color excess from reddening is about 0.05 mag larger in Hercules than in CVn II, as do we, so it cannot be due to a relative color shift. We assume CVn II is somewhat more metal poor than Hercules, and that is the reason we actually find CVn II to be 0.5 Gyr older than Hercules (on average), despite the fact that the ACS CMDs are very similar. Although they make no mention of BS stars, there are only a few in the CVn II CMD, so their presence would not yield a significantly young population in their CVn II fit, even if they were modeled as young stars. A possible explanation is the depth of their data. In the WFPC2 data, the MS turnoff is closer to the faint limit, and so there is significantly more spread at the turnoff due to photometric errors, which might allow a younger population in their fits. If we appropriately increase the photometric errors in both the ACS catalog for CVn II and its artificial star tests, a wider range of SFHs are consistent with the data.

4. Discussion
We have used a combination of Keck spectroscopy and HST photometry to characterize the stellar populations of six faint Milky Way satellites. The spectroscopy demonstrates that these galaxies are comprised of extremely metal-poor stars; the lowest metallicities are consistent with pre-enrichment from a single supernova (see Wise et al. 2012). Using these metallicities as a constraint in fits to high-precision CMDs, we find that each of these galaxies is well-matched by a population of ancient stars, with no indication of a delayed onset to star formation (cf. Noeske et al. 2007). In the best-fit models for 5 galaxies (Table 2), a majority (75%) of the stars formed prior to (13.3 Gyr ago), when the epoch of reionization began (Hinshaw et al. 2013). Within the uncertainties (Figure 8), all 6 of the galaxies formed at least 80% of their stars by , although this fraction might be as low as 40% for UMa I and 60% for Hercules and Leo IV. A two-burst model reproduces the data well, but we cannot rule out a single ancient burst of star formation in each galaxy. We stress that the absolute age scale is uncertain at the level of 1 Gyr, given the systematics associated with distance and abundances. For example, if we were to adopt a longer distance for M92, the age of M92 and the UFDs would all shift younger, and if we were to adopt lower [O/Fe] values, the ages would shift older. In the coming decade, more accurate distances from the Gaia mission will reduce such systematic errors considerably (Perryman et al. 2001). In the next few years, we should also have an accurate HST parallax to a metal-poor globular cluster (NGC 6397; program GO-13817), which can then replace M92 as a population template for this kind of work.
The populations of these galaxies are very similar to each other (Figures 1 and 2), as one might expect if they were all influenced by an event that synchronized the truncation of star formation in each. These faint satellites stand in contrast to the brighter dwarf spheroidals, all of which host stars younger than 10 Gyr (Orban et al. 2008). It is worth noting that the UFD SFHs may be even more abrupt and synchronized than we report here. Although our relative ages are robust, the distance uncertainties for each galaxy, and the scatter in [O/Fe] (both galaxy to galaxy and within a given galaxy) may manifest as an age spread in our fits.
The discovery of additional faint satellites around the Milky Way and Andromeda have narrowed the gap between observations and CDM predictions of substructure. To close that gap, simulations of galaxy formation assume that reionization suppressed the star formation in the smallest DM sub-halos (e.g., Bullock et al. 2001; Ricotti & Gnedin 2005; Muoz et al. 2009; Bovill & Ricotti 2009, 2011a, 2011b; Tumlinson 2010; Koposov et al. 2009; Li et al. 2010; Salvadori & Ferrara 2009; Salvadori et al. 2014). Specifically, such models assume that reionization heated the gas in small DM halos to 104 K, and the resulting thermal pressure boiled the gas out of the halos and into the intergalactic medium (IGM). Gravity is too weak in these sub-halos to retain the gas or reacquire it from the reionized IGM. The stellar populations of the UFDs, which are extremely similar to each other and dominated by ancient metal-poor stars, support the premise of an early synchronizing event in their SFHs. Although galaxy formation models tune the suppression threshold in terms of DM mass, the outcome is manifested in terms of luminous matter, with post-reionization star formation plummeting in satellites fainter than mag. Outside of simulations, the threshold is likely not as clean as this, with multiple parameters affecting the outcome, including the details of the star formation history, the DM accretion history, local dynamics, metallicity, location within the parent halo, and distance from major sources of reionization. It is difficult to disentangle such effects with the small sample here. For example, Boo I and Com Ber have almost exclusively old populations, and fell into the Milky Way earlier than the other galaxies in our sample (Rocha et al. 2012), giving them an earlier exposure to the dominant source of ionization. While UMa I is dominated by old metal-poor stars, it appears to be systematically younger than the other galaxies in our sample. UMa I may be distorted, and Okamoto et al. (2008) argue that it appears to be undergoing disruption; elongation along our sightline could be broadening the CMD, producing an apparent age spread. Hercules is the brightest galaxy in our sample ( mag; Martin et al. 2008b); it may have retained more gas during the reionization era, leading to a non-negligible population of younger stars. Besides the galaxies in our sample, there are others that demonstrate these complexities. For example, Leo T is a gas-rich irregular hosting recent star formation, despite having a luminosity similar to those of the ancient UFDs (Irwin et al. 2007; de Jong et al. 2008a; Ryan-Weber et al. 2008); at 409 kpc, its isolation from the Milky Way could have enabled its evolution as a “rejuvenated fossil,” with late gas accretion and associated star formation (Ricotti 2009).
With the current facilities, measuring SFHs with cosmologically-interesting constraints can only be done for stellar populations within the Local Group. Unfortunately, we only know of a few Milky Way satellites near mag, where we might better understand the conditions that lead to a reionization-induced suppression of star formation. Increasingly faint dwarfs are also being discovered at (e.g., Atek et al. 2014; Alavi et al. 2014), but these have stellar masses that are several orders of magnitude larger than the UFD satellites of the Milky Way. Because these intermediate-redshift galaxies are well above the filtering mass, they should not experience the quenching effects of reionization, and in fact exhibit significant star formation beyond . In the near future, the best hope for further progress in this area comes from additional wide-field surveys that should reveal additional faint satellites (Willman 2010), such as the Panoramic Survey Telescope And Rapid Response System, the Dark Energy Survey, the Large Synoptic Survey Telescope, and the Wide Field Infrared Survey Telescope. Satellites found in these surveys would be prime targets for both HST and the James Webb Space Telescope.
References
- (1)
- (2) Adén, D., et al. 2009, A&A, 506, 1147
- (3)
- (4) Ahn, C.P., et al. 2012, ApJS, 203, 21
- (5)
- (6) Ahn, C.P., et al. 2014, ApJS, 211, 17
- (7)
- (8) Alavi, A., et al. 2014, ApJ, 780, 143
- (9)
- (10) Anderson, J., & Bedin, L.R. 2010, PASP, 122, 1035
- (11)
- (12) Asplund, M., Grevesse, N., Sauval, A.J., & Scott, P. 2009, ARAA, 47, 481
- (13)
- (14) Atek, H., et al. 2014, ApJ, 789, 96
- (15)
- (16) Babul, A., & Rees, M.J. 1992, MNRAS, 255, 346
- (17)
- (18) Baumgardt, H., Côté, P., Hilker, M., Rejkuba, M., Mieske, S., Djorgovski, S.G., & Stetson, P. 2009, MNRAS, 396, 2051
- (19)
- (20) Belokurov, V., et al. 2006, ApJ, 647, L111
- (21)
- (22) Belokurov, V., et al. 2007, ApJ, 654, 897
- (23)
- (24) Belokurov, V., et al. 2009, MNRAS, 397, 1748
- (25)
- (26) Belokurov, V., et al. 2010, ApJ, 712, L103
- (27)
- (28) Bergbusch, P.A., & VandenBerg, D.A. 1992, ApJS, 81, 163
- (29)
- (30) Bovill, M.S., & Ricotti, M. 2009, ApJ, 693, 1859
- (31)
- (32) Bovill, M.S., & Ricotti, M. 2011a, ApJ, 741, 17
- (33)
- (34) Bovill, M.S., & Ricotti, M. 2011b, ApJ, 741, 18
- (35)
- (36) Bradford, J.D., Geha, M., Muñoz, R.R., Santana, F.A., Simon, J.D., Côte, P., Stetson, P.B., Kirby, E., & Djorgovski, S.G. 2011, ApJ, 743, 167
- (37)
- (38) Brown, T.M., et al. 2005, AJ, 130, 1693
- (39)
- (40) Brown, T.M., et al. 2012, ApJ, 753, L21
- (41)
- (42) Bullock, J.S., Kravtsov, A.V., & Weinberg, D.H. 2001, ApJ, 548, 33
- (43)
- (44) Clem, J.L. 2006, Ph.D. Thesis
- (45)
- (46) Cooper, M.C., Newman, J.A., Davis, M., Finkbeiner, D.P., & Gerke, B.F. 2012, Astrophysics Source Code Library, 3003
- (47)
- (48) de Jong, J.T.A., et al. 2008a, ApJ, 680, 1112
- (49)
- (50) de Jong, J.T.A., Rix, H.-W., Martin, N.F., Zucker, D.B., Dolphin, A.E., Bell, E.F., Belokurov, V., & Evans, N.W. 2008b, AJ, 135, 1361
- (51)
- (52) Del Principe, M., Piersimoni, A.M., Bono, G., Di Paola, A., Dolci, M., Marconi, M. 2005, AJ, 129, 2714
- (53)
- (54) Dolphin, A.E. 2002, MNRAS, 332, 91
- (55)
- (56) Dotter, A., Chaboyer, B., Jevremović, D., et al. 2008, ApJS, 178, 89
- (57)
- (58) Duquennoy, A., & Mayor, M. 1991, A&A, 248, 485
- (59)
- (60) Ferraro, F.R., Lanzoni, B., Dalessandro, E., Mucciarelli, A., & Lovisi, L. 2014, in Ecology of Blue Straggler Stars, eds. H.M.J. Boffin, G. Carraro & G. Beccari, Springer, in press (arxiv:1406.3471)
- (61)
- (62) Frebel, A. 2010, AN, 331, 474
- (63)
- (64) Frebel, A., Simon, J.D., Geha, M., & Willman, B. 2010, ApJ, 708, 560
- (65)
- (66) Fruchter, A.S., & Hook, R.N. 2002, PASP, 114, 144
- (67)
- (68) Garofalo, A., Cusano, F., Clementini, G., Ripepi, V., Dall’Ora, M., Moretti, M.I., Coppola, G., Musella, I., & Marconi, M. 2013, ApJ, 767, 62
- (69)
- (70) Geha, M., et al. 2009, ApJ, 692, 1464
- (71)
- (72) Geha, M., et al. 2013, 771, 29
- (73)
- (74) Gonzaga, S., 2014, ACS Data Handbook, Version 7.2 (Baltimore: STScI).
- (75)
- (76) Greco, C., et al. 2008, ApJ, 675, L73
- (77)
- (78) Grundahl, F., Catelan, M., Landsman, W.B., Stetson, P.B., & Andersen, M.I. 1999, ApJ, 524, 242
- (79)
- (80) Gustafsson, B., Edvardsson, B., Eriksson, K., Jorgensen, U.G., Nordlund, Å, & Plez, B. 2008, A&A, 486, 951
- (81)
- (82) Harris, J., & Zaritsky, D. 2001, ApJS, 136, 25
- (83)
- (84) Harris, W.E. 1996, AJ, 112, 1487 (2010 edition)
- (85)
- (86) Hinshaw, G., et al. 2013, ApJS, 208, 19
- (87)
- (88) Hughes, J., Wallerstein, G., & Bossi, A. 2008, AJ, 136, 2321
- (89)
- (90) Iben, I., & Renzini, A. 1984, PhRep, 105, 329
- (91)
- (92) Irwin, M.J., et al. 2007, ApJ, 656, L13
- (93)
- (94) Irwin, M.J., Ferguson, A.M.N., Huxor, A.P., Tanvir, N.R., Ibata, R.A., & Lewis, G.F. 2008, ApJ, 676, L17
- (95)
- (96) Ivanova, N., Belczynski, K., Freqeau, J.M., & Rasio, F.A. 2005, MNRAS, 358, 572
- (97)
- (98) Jordi, K., Grebel, E.K., & Ammon, K. 2006, A&A, 460, 339
- (99)
- (100) Kauffmann, G., White, S.D.M., & Guiderdoni, B. 1993, MNRAS, 264, 201
- (101)
- (102) Kirby, E.N. 2011, PASP, 123, 531
- (103)
- (104) Kirby, E.N., Cohen, J.G., Guhathakurta, P., et al. 2013, ApJ, 779, 102
- (105)
- (106) Kirby, E.N., et al. 2010, ApJS, 191, 352
- (107)
- (108) Kirby, E.N., Lanfranchi, G.A., Simon, J.D., Cohen, J.G., & Guhathakurta, P. 2011, ApJ, 727, 78
- (109)
- (110) Kirby, E.N., Simon, J.D., Geha, M., Guhathakurta, P., & Frebel, A. 2008, ApJ, 685, L43
- (111)
- (112) Kleyna, J.T., Wilkinson, M.I., Wyn Evans, N., & Gilmore, G. 2005, ApJ, 630, L141
- (113)
- (114) Klypin, A., Kravtsov, A.V., Valenzuela, O., & Prada, F. 1999, ApJ, 522, 82
- (115)
- (116) Koch, A., McWilliam, A., Grebel, E.K., Zucker, D.B., & Belokurov, V. 2008, ApJ, 688, L13
- (117)
- (118) Koposov, S.E., Gilmore, G., Walker, M.G., et al. 2011, ApJ, 736, 146
- (119)
- (120) Koposov, S.E., Yoo, J., Rix, H.-W., Weinberg, D.H., Macció, A.V., & Escudé, J.M. 2009, ApJ, 696, 2179
- (121)
- (122) Li, Y.-S., De Lucia, G., & Helmi, A. 2010, MNRAS, 401, 2036
- (123)
- (124) Majewski, S.R., et al. 2007, ApJ, 670, L9
- (125)
- (126) Martin, N.F., de Jong, J.T.A., & Rix, H.-W. 2008b, ApJ, 684, 1075
- (127)
- (128) Martin, N.F., et al. 2008a, ApJ, 672, L13
- (129)
- (130) Martin, N.F., et al. 2009, ApJ, 705, 758
- (131)
- (132) Martin, N.F., Ibata, R.A., Chapman, S.C., Irwin, M., & Lewis, G.F. 2007, MNRAS, 380, 281
- (133)
- (134) McConnachie, A.W., et al. 2009, Nature, 461, 66
- (135)
- (136) Milone, A.P., et al. 2012, A&A, 540, A16
- (137)
- (138) Minor, Q.E. 2013, ApJ, 779, 116
- (139)
- (140) Momany, Y., Held, E.V., Saviane, I., Zaggia, S., Rizzi, L., & Gullieuszik, M. 2007, A&A, 468, 973
- (141)
- (142) Moore, B., Ghigna, S., Governato, F., Lake, G., Quinn, T., Stadel, J., & Tozzi, P. 1999, ApJ, 524, L19
- (143)
- (144) Moretti, M.I., et al. 2009, ApJ, 699, L125
- (145)
- (146) Muñoz, J.A., Madau, P., Loeb, A., & Diemand, J. 2009, MNRAS, 400, 1593
- (147)
- (148) Muñoz, R.R., Carlin, J.L., Frichaboy, P.M., Nidever, D.L., Majewski, S.R., & Patterson, R.J. 2006, ApJ, 650, L51
- (149)
- (150) Muñoz, R.R., Geha, M., & Willman, B. 2010, AJ, 140, 138
- (151)
- (152) Musella, I., et al. 2009, ApJ, 695, L83
- (153)
- (154) Musella, I., et al. 2012, ApJ, 756, 121
- (155)
- (156) Noeske, K.G., et al. 2007, ApJ, 660, L47
- (157)
- (158) Norris, J.E., et al. 2010, ApJ, 723, 1632
- (159)
- (160) Okamoto, S. 2010, PhD thesis
- (161)
- (162) Okamoto, S., Arimoto, N., Yamada, Y., & Onodera, M. 2008, A&A, 487, 103
- (163)
- (164) Okamoto, S., Arimoto, N., Yamada, Y., & Onodera, M. 2012, ApJ, 744, 96
- (165)
- (166) Orban, C., Gnedin, O.Y., Weisz, D.R., Skillman, E.D., Dolphin, A.E., & Holtzman, J.A. 2008, ApJ, 686, 1030
- (167)
- (168) Paust, N.E.Q., Chaboyer, B., & Sarajedini, A.. 2007, AJ, 133, 2787
- (169)
- (170) Perryman, M.A.C., et al. 2001, A&A, 369, 339
- (171)
- (172) Piotto, G., et al. 2004, ApJ, 604, L109
- (173)
- (174) Preston, G.W., & Sneden, C. 2000, AJ, 120, 1014
- (175)
- (176) Ricotti, M. 2009, MNRAS, 392, L45
- (177)
- (178) Ricotti, M., & Gnedin, N.Y. 2005, ApJ, 629, 259
- (179)
- (180) Robin, A.C., Reylé, C., Derriére, S., & Picaud, S. 2003, 409, 523
- (181)
- (182) Rocha, M., Peter, A.H.G., & Bullock, J. 2012, MNRAS, 425, 231
- (183)
- (184) Ryan-Weber, E.V., Begum, A., Oosterloo, T., Pal, S., Irwin, M.J., Belokurov, V., Evans, N.W. & Zucker, D.B. 2008, MNRAS, 384, 535
- (185)
- (186) Salvadori, S., & Ferrara, A. 2009, MNRAS, 395, L6
- (187)
- (188) Salvadori, S., Tolstoy, E., Ferrara, A., & Zaroubi, S. 2014, MNRAS, 437, L26
- (189)
- (190) Sand, D.J., Olszewski, E.W., Willmanm, B., Zaritsky, D., Seth, A., Harris, J., Piatek, S., & Saha, A. 2009, ApJ, 704, 898
- (191)
- (192) Sand, D.J., Seth, A., Olszewski, E.W., et al. 2010, ApJ, 718, 530
- (193)
- (194) Sand, D.J., Strader, J., Willman, B., et al. 2012, ApJ, 756, 79
- (195)
- (196) Santana, F.A., Muñoz, R.R., Geha, M., Côte, P., Stetson, P., Simon, J.D., & Djorgovski, S.G. 2013, ApJ, 774, 106
- (197)
- (198) Schlegel, D.J., Finkbeiner, D.P., & Davis, M. 1998, ApJ, 500, 525
- (199)
- (200) Simon, J.D., & Geha, M. 2007, ApJ, 670, 313
- (201)
- (202) Simon, J.D., Geha, M., Minor, Q.E., et al. 2011, ApJ, 733, 46
- (203)
- (204) Sirianni, M., et al. 2005, PASP, 117, 1049
- (205)
- (206) Sollima, A., Cacciari, C., & Valenti, E. 2006, MNRAS, 372, 1675.
- (207)
- (208) Stetson, P.B. 1987, 99, 191
- (209)
- (210) Tumlinson, J. 2010, ApJ, 708, 1398
- (211)
- (212) van de Ven, G., van den Bosch, R.C.E., Verolme, E.K., & de Zeeuw, P.T. 2006, A&A, 445, 513
- (213)
- (214) VandenBerg, D.A., Bergbusch, P.A., Dotter, A., Ferguson, J.W., Michaud, G., Richer, J., & Proffitt, C.R. 2012, ApJ, 755, 15
- (215)
- (216) VandenBerg, D.A., Bergbusch, P.A., & Dowler, P.D. 2006, ApJS, 162, 375
- (217)
- (218) VandenBerg, D.A., Bergbusch, P.A., Ferguson, J.W., & Edvardsson, B. 2014a, ApJ, in press, arXiv:1409.1283
- (219)
- (220) VandenBerg, D.A., Bolte, M., & Stetson, P.B. 1990, AJ, 100, 445
- (221)
- (222) VandenBerg, D.A., Bond, H.E., Nelan, E.P., Nissen, P.E., Schaefer, G.H., & Harmer, D. 2014b, ApJ, 792, 110
- (223)
- (224) VandenBerg, D.A., Swenson, F.J., Rogers, F.J., Iglesias, C.A., & Alexander, D.R. 2000, ApJ, 532, 430
- (225)
- (226) Vargas, L.C., Geha, M., Kirby, E.N., & Simon, J.D. 2013, ApJ, 767, 134
- (227)
- (228) Weisz, D.R., Dolphin, A.E., Skillman, E.D., Holtzman, J., Gilbert, K.M., Dalcanton, J.J., & Williams, B.F. 2014a, ApJ, 789, 147
- (229)
- (230) Weisz, D.R., Dolphin, A.E., Skillman, E.D., Holtzman, J., Gilbert, K.M., Dalcanton, J.J., & Williams, B.F. 2014b, ApJ, 789, 148
- (231)
- (232) Willman, B. 2010, Adv. Astron., 2010, 285454
- (233)
- (234) Willman, B., Blanton, M.R., West, A.A., Dalcanton, J.J., Hogg, D.W., Schneider, D.P., Wherry, N., Yanny, B., & Brinkmann, J. 2005, AJ, 129, 2692
- (235)
- (236) Wise, J.H., Turk, M.J., Norman, M.L., & Abel, T. 2012, ApJ, 745, 50
- (237)
- (238) Zucker, D.B., et al. 2004, ApJ, 612, L121
- (239)
- (240) Zucker, D.B., et al. 2006, ApJ, 650, L41
- (241)
- (242) Zucker, D.B., et al. 2007, ApJ, 659, L21
- (243)