R. A. Burns et al.Distance to IRAS 20056+3350: MSFR on the Solar circle
Masers - Stars; individual (IRAS 20056+3350) - Galaxy: structure and dynamics
Trigonometric Distance and Proper Motion of IRAS 20056+3350: Massive Star Forming Region on the Solar Circle
Abstract
We report our measurement of the trigonometric distance and proper motion of IRAS 20056+3350, obtained from the annual parallax of H2O masers. Our distance of kpc, which is 2.8 times larger than the near kinematic distance adopted in the literature, places IRAS 20056+3350 at the leading tip of the Local arm and proximal to the Solar circle. Using our distance we re-evaluate past observations to reveal IRAS 20056+3350 as a site of massive star formation at a young stage of evolution. This result is consistent with the spectral energy distribution of the source evaluated with published photometric data from UKIDSS, WISE, AKARI, IRAS and sub-millimetre continuum. Both analytical approaches reveal the luminosity of the region to be , and suggest that IRAS 20056+3350 is forming an embedded star of M⊙. We estimated the proper motion of IRAS 20056+3350 to be (, ) = (, ) mas yr-1 from the group motion of H2O masers, and use our results to estimate the angular velocity of Galactic rotation at the Galactocentric distance of the Sun, km s-1 kpc-1, which is consistent with the values obtained for other tangent point and Solar circle objects.
1 Introduction
The morphology of a galaxy is determined visually and is highly influenced by the distribution of massive stars which are bright and typically confined to the spiral arms (Urquhart et al., 2014; Reid et al., 2014). Although the exclusivity of massive star formation to the spiral arms is not yet understood it does bring to light a strong interplay between the spiral pattern itself and the conditions required to trigger massive star formation. Thus, neither phenomena can be understood independently; we cannot explain massive star formation without explaining the role of the spiral pattern and we require the by-products of massive star formation to understand the morphology of galaxies by tracing the arms.
From our viewpoint within the Galactic disk, perhaps the most important parameter common to both fields of investigation is distance. In addition to the clear necessity of accurate distances for mapping the Galactic arms, the interpretation of the physical properties of a massive star forming region (MSFR) is greatly influenced by the distance estimate adopted - since many of these parameters have a non-linear relationship with distance.
For convenience, many investigators make use of the kinematic distances of Galactic star forming regions (SFRs). However, kinematic distance calculations require pre-calibration of the Galactic rotation curve and suffer from distance ambiguities ( and ) for objects in the inner Galaxy. Moreover, they are unreliable when the source has a large peculiar velocity with respect to purely circular rotation in the Galactic disk. Consequently, the kinematic distance can be poorly determined for objects in some particular locations such as in the direction of the Galactic center and anticenter, and Local Arm.
Measurements of trigonometric parallaxes to Galactic MSFRs directly improves the reliability of their distances. Such experiments involve measurement of the annual parallax of MSFRs typically via astrometric monitoring of maser spots using VLBI networks such as the VLBI Exploration of Radio Astrometry (VERA), the Very Long Baseline Array (VLBA), and the European VLBI Network (EVN). In addition to distance measurement, masers are also extremely useful for understanding the processes of star formation itself since masers emitted by different molecular species and transitions are known to be associated with different physical environments (Bartkiewicz & van Langevelde, 2012). As a result, masers are often seen to trace structures such as expanding shells and shock fronts (Trinidad et al., 2013), and bipolar outflows (Imai et al. 2007; Nagayama et al. 2008; Moscadelli et al. 2011; Torrelles et al. 2014 and G236.81+1.98 in Choi et al. 2014). Masers thus allow the internal motions of star formation mechanisms to be seen even though the structures themselves may not be directly unobservable due to the embedded nature of such systems.
Finally, combining the proper motions and line of sight motions of masers sometimes allows estimation of the three-dimensional secular motions of a star forming region in the plane of the Galaxy. This is one of the unique advantages of VLBI maser investigations and is a dominant approach to understanding the kinematics and structure of the Milky Way Galaxy (MWG) via the evaluation of the Galactic constants, , and (Honma et al., 2012; Reid et al., 2014). These parameters can be evaluated more reliably for SFRs that reside at special locations in the MWG such as the tangent points (Nagayama et al., 2011; Burns et al., 2014) and Solar circle (Ando et al., 2011).
All VLBI observations discussed in this paper were carried out using VERA (Kobayashi et al., 2003) which is a Japanese VLBI array dedicated to measuring the annual parallax of maser sources in the MWG. IRAS 20056+3350 was chosen for this investigation for its bright and stable maser emission at 22 GHz - first seen in Jenness et al. (1995) - and its presumed proximity to the Solar circle. IRAS 20056+3350 is listed in the IRAS catalogue of point sources (Beichman et al., 1988).
In this work we aim to make a contribution to each of the aforementioned topics. This paper continues as follows: Observations and data reduction are discussed in §2. Results are reported in §3, including analyses of the astrometric accuracy achieved in parallax fitting of maser spots. The physical nature of the IRAS 20056+3350 MSFR is explored in §4 in the context of archive and publicly available data, and its location is discussed with respect to other MSFRs who’s distances have also been measured with VLBI annual parallax. Finally in this section we evaluate using the results obtained from our observations with VERA. Conclusions are reported in §5.
2 Observations and data reduction
Data were obtained using VERA in dual-beam mode. By observing H2O masers in IRAS 20056+3350 and the J2010+3322 reference continuum source simultaneously we calibrated tropospheric phase fluctuations using the reference source and applied solutions directly to the maser data in real-time without interpolation. The scan integration time of the pair was about 9 minutes. Intermittent observations of BL Lac or 3C454.3 were made every 1.5 hours for bandpass calibration. A typical observation session lasted roughly 8 hours, providing 3.3 hours on-source integration and good coverage in the uv plane. Phase tracking centers for the maser and continuum source were set to , +33∘59’41”.491) and , +33∘22’13”.810), respectively. The positional reference J2010+3322 is listed in the VLBA calibrator search catalogue Fomalont et al. (2003).
Left-handed circular polarisation signals were sampled with 2-bit quantisation, and filtered with the VERA digital filter unit (Iguchi et al., 2005). The total available bandwidth of 256 MHz was divided into 16 intermittent frequency (IF) channels, each with a bandwidth of 16 MHz. One IF was centered on the maser emission, assuming a rest frequency of 22.235080 GHz, and the other 15 IFs, in adjoining frequency, were allocated to the continuum reference source.
Seven epochs of observations were carried out over a period slightly short of two years with epochs typically spaced 3-6 months apart. A summary of the observing calendar is given in Table 1. Maser spots were readily identifiable from one epoch to another due to the stability of emission and the low number of maser features (see Section 3.1).
| Observation | Detected | |
|---|---|---|
| Epoch | Date | spots |
| 1 | 2012 Feb 05 | 2 |
| 2 | 2012 Apr 30 | 2 |
| 3 | 2012 Aug 09 | 2 |
| 4 | 2013 Feb 16 | 3 |
| 5 | 2013 Apr 22 | 3 |
| 6 | 2013 May 05 | 2 |
| 7 | 2013 Dec 24 | 2 |
[c]
| Spot | Detected | |||||||
|---|---|---|---|---|---|---|---|---|
| ID | (km s-1) | epochs | (mas) | (mas) | (mas) | (mas yr-1) | (mas yr-1) | |
| A | 1234567 | |||||||
| B | 12345** | |||||||
| C | ****456* | |||||||
| D | *******7 | +804.61 | +3.47 | |||||
| Group fitting | ||||||||
| Average |
-
•
Column (3): Epoch numbers assigned in column(1) of Table 1, while asterisk represents non-detection.
Interferrometric correlation was carried out using the Mitaka FX correlator (Chikada et al., 1991). A frequency resolution of 15.625 kHz, corresponding to a velocity resolution of 0.21 km s-1, was used for the maser data, and for the continuum source a frequency resolution of 250 kHz was used. We did not use the central IF of the continuum source data during data reduction since the frequency resolution of this IF channel did not match that of the other 14 IFs. This is an affect of the correlation process whereby the frequency resolution of this IF reflects that of the maser data. The small loss of bandwidth does not effect our goals adversely since the continuum source is readily detected with a signal to noise ratio of without the inclusion of the central IF channel.
GPS measurements of the atmospheric water vapour content at each station were used to refine an a-priori model of tropospheric delay expected during the rise and fall of source elevation (Honma et al., 2008). Model solutions were applied post-correlation. In the 6th epoch, GPS data were not available at VERA’s Ogasawara station. For this epoch we instead used water vapour measurements from the Japan meteorological association (JMA) to the same effect, though at a lower time resolution. The reliability of these procedures is explored in detail in Nagayama (2014, in preparation).
All data were reduced using Astronomical Image Processing System (AIPS) developed by the National Radio Astronomy Observatory (NRAO). Amplitude and bandpass calibration for both beams was carried out using the standard procedures of reduction of astrometric VLBI data in AIPS. During the first round of data reduction we created phase referenced images of the maser emission by calibrating maser data using phase solutions obtained for J2010+3322 in the AIPS task FRING. The positions of masers were determined by the peaks of 2D Gaussian fits applied to the final images. Using this procedure we found the two brightest maser spots (spot ID:A and spot ID:B; see Table 2 ). The other spots (spot ID:C and spot ID:D) were only seen in self-calibrated images created in the second round of data reduction. In this reduction procedure we made single-beam images by self-calibration using the AIPS task pair IMAGR and CALIB on the brightest maser spot (spot ID:A). Subsequent maser positions were determined relative to the astrometric position of the bright reference maser, which was determined from the phase-referenced map.
3 Results
3.1 Distribution of H2O masers in IRAS 20056+3350
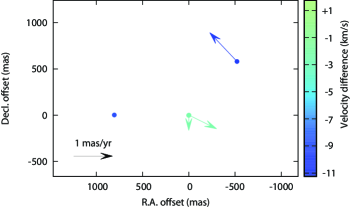
A modest total of 4 individual maser spots were detected in our observations. Maser spot detections are summarised in Table 2 where position offsets are given relative to the reference maser (Spot ID:A) for which we measure first epoch absolute co-ordinates of , +33∘59’41”.477). The LSR velocity domain of masers, ascertained from Doppler shifts, ranges from to km s-1. Thus, all detected masers are blueshifted with respect to the parent cloud - whose velocity from molecular line observations is known to be km s-1 (see section 4.2.1). The spatial distribution and velocities of maser spots detected in IRAS 20056+3350 are presented in Fig. 4 with arrows indicating proper motion vectors (see section 3.4).
3.2 Annual parallax
Parallax and proper motion fitting was performed simultaneously on the two maser spots which were identifiable in multiple observations, spanning more than one year. Astrometric motions of these spots were deconstructed into linear and sinusoidal components arising from the sky-plane proper motion and annual parallax, respectively. In the fitting procedure, nominal fitting errors in the R.A. and Dec. directions were applied and reduced itteratively until a value of unity was reached. These error floors were 0.227 mas in R.A. and 0.050 mas in Dec.
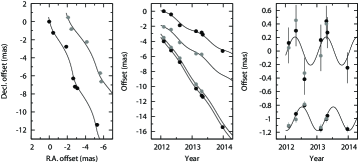
When data were fit using the two most stable and brightest maser spots (Spot ID:A and ID:B) together we derived an annual parallax of mas (uncertainty of ), corresponding to a distance of kpc. Results of the fitting procedure are illustrated in Fig. 1. When repeating the fitting procedure for these spots individually we arrived at consistent values for both the distance and error floors (see Table 2). It is clearly seen in Fig. 1 that the data were fit well in the Dec. direction and poorly in the R.A. direction. The cause of this situation in the context of astrometric accuracy is revisited in the next subsection.
Molinari et al. (1996) were the first to estimate the kinematic distance to IRAS 20056+3350. Assuming that the source is at the near kinematic distance for Galactic rotation, and using the IAU recommended Galactic constants of R kpc and km s-1, they derived kpc from the radial velocity of of their NH3 line observations at km s-1. To date, this value has been adopted in all subsequent literature regarding this source. Assuming Galactic constants R0 = 8.05 kpc and = 235 km s-1 (at V⊙ = 15.3 km s-1; Honma et al. 2012) and the condition of flat Galactic rotation = = 235 km s-1, we calculate the near and far kinematic distances of IRAS 20056+3350 as = 1.2 kpc and = 3.9 kpc respectively. Our distance obtained via trigonometric parallax is close to the far kinematic distance.
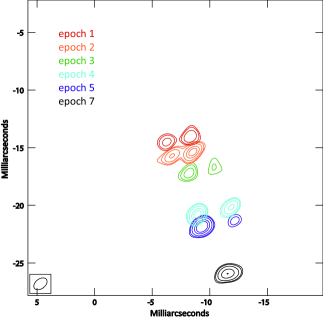
3.3 Analysis of astrometric accuracy
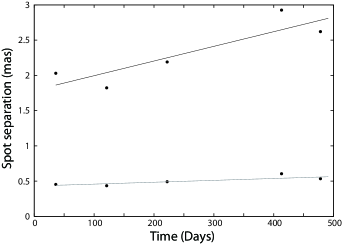
In the parallax fitting results of Fig. 1, the astrometric positions in the R.A. direction indicate a notably large degree of dispersion. Upon inspection of the brightness peaks in the emission maps, which we present in Fig. 2, emitting regions exhibit structural elongation primarily in the R.A. direction. To investigate the astrometric error contribution from the structure of masers we monitored the spatial separation between the two bright, persistent maser spots. In the absence of acceleration, relative motions should be linear, thus we can compare the astrometric accuracy in R.A. and Dec. by evaluating the deviation from linear best fit motions in each respective direction. In Fig. 3, the large deviations from linearity seen in R.A. reveal an instability in the astrometric accuracy. These deviations are likely caused by the notable elongation of maser structures, which results in an inaccurate determination of emission peaks in the interferrometric images. The perceived elongation may be real structure, or it may be an apparent effect caused by the smearing of the two spots at small separation from each other. Furthermore, the spatial separation of maser spots was often close to the first side-lobe radius in the R.A. direction (about 2.5 mas in our VERA observations). Interaction of the maser emission with side-lobes is likely to have contributed additional smearing of emission peaks in the R.A. direction.
The standard deviation values for the linear fits in R.A. and Dec. were 0.19 and 0.04 respectively. These values are similar to the error floors arrived at in the parallax fitting procedure which were required to reach a value of unity. Thus, our analysis suggests that the maser structure contributes a dominant source of astrometric error in these observations. Although this effect is detrimental for fitting the maser parallax in the R.A. direction, the astrometry in the Dec. direction is altogether unaffected, i.e this error is confined to the R.A. direction and thus supports preferential use of the Dec. direction offsets as the most suitable approach to parallax fitting.
3.4 Proper motion of H2O masers
We found a third maser spot (spot ID:C) in 3 consecutive epochs of the self-calibrated images. In order to deconvolve parallactic and secular motions a maser via fitting, a spot must be detected for around 1 year or longer in the phase-referenced images. However, we were able to estimate the proper motion of this spot via its relative motion to the bright maser spot (spot ID:A) detected in the self-calibrated images by assuming that both spots have a common annual parallax. By combining the relative maser motions with the known motion of the reference maser we obtained the sky-plane proper motion of the third spot, where the error is calculated as the quadrature sum of the standard deviation in the relative motion of masers, and the proper motion error of the reference maser from parallax fitting. A fourth maser spot (spot ID:D) was detected in the final observation epoch only and thus its motion could not be found. Maser proper motions and their errors are listed in Table 2. Absolute maser proper motions are shown in Fig. 4 where arrows represent velocity vectors.
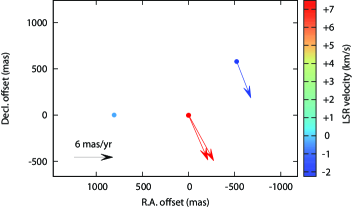
No obvious spatial nor velocity structure can be inferred from our maser vector maps alone. With the small number of maser spots it is unwise to search our images for self-contained geometric structures arising from phenomena such as bipolar outflows and spherical expansions; such analysis is powerful only if the number of maser spots is large enough to reveal structure in the velocity field in regions of star formation (for example Imai et al. 2011).
4 Discussion
4.1 The secular motion of IRAS 20056+3350
Zhang et al. (2005) presented an on-axis outflow mapped in CO which had a velocity centered at about km s-1, in agreement with other molecular line observations (see Table 3). The spectrum exhibits a triple-peak morphology with emission detected in the range of km s-1. The peaks correspond to the blue-shifted outflow, the parent cloud and redshifted outflow, in ascending velocity. Since the of our masers are all consistent with the blue limit of the CO emission we conclude that our observations are likely sampling masers associated with the blueshifted lobe of the outflow, which appears aligned to the line of sight. Although this does not allow direct interpolation of maser motions to a kinematic center, as is demonstrated in Imai et al. (2011), it does allow us to make the reasonable assumption that the sky-plane proper motions of maser spots with respect to the driving source are small, since the largest velocity components can be expected along the line of sight, in agreement with the direction of the molecular outflow. As such, the average proper motion of maser spots should give a reasonable approximation to the secular motion of the SFR.
We evaluated the group averaged proper motion for all maser spots in IRAS 20056+3350 to be (, ) = (, ) mas yr-1. Error values are the standard error of the mean, /, where is the standard deviation of the proper motion of 3 spots. After subtraction of the average group motion, residual motions reveal the internal kinematics of H2O masers in IRAS 20056+3350. We present a map of the internal maser motions in Fig. 5.
The proper motions of SFRs can be used to break the distance ambiguity associated with kinematic distance estimates because sources at near and far kinematic distances are expected to exhibit different proper motions on the sky. For IRAS 20056+3350 the near and far kinematic distances are = 1.2 kpc and = 3.9 kpc, respectively. Sources at these locations should show the proper motions of mas yr-1 and mas yr-1 respectively, if they rotate circularly around the Galactic center with km s-1 and assuming R kpc (Honma et al., 2012).
| Transition | Beam size | Ref | |||
|---|---|---|---|---|---|
| (arcsec) | |||||
| CS | +8.8 | 3.2 | 39 | Bronfman et al. (1996) | |
| CS | +9.0 | 3.2 | 21 | Jenness et al. (1995) | |
| C18O | +9.0 | 3.0 | 21 | Jenness et al. (1995) | |
| 13CO | +8.56 | 4.9 | 55 | Wu et al. (2001) | |
| NH3 | +9.4 | 2.29 | 40 | Molinari et al. (1996) | |
| NH3 | +9.0 | 1.82 | 40 | Molinari et al. (1996) |
Using our estimate of the systemic proper motion of IRAS 20056+3350, (, ) = (, ) mas yr-1, we calculated the sky-plane motion of the source with respect to the Solar LSR in the direction of Galactic longitude as mas yr-1, using the standard solar motion (U⊙,V⊙,W⊙) = (+10.3, +15.3, +7.7) km s-1 (Kerr & Lynden-Bell 1986, see also Ando et al. 2011). This proper motion value is consistent with that estimated for a source at the far kinematic distance. Furthermore, the far kinematic distance, = 3.9 kpc, is closer to our distance of kpc, measured using annual parallax compared to the near distance kpc
4.2 The physical nature of IRAS 20056+3350
Since Molinari et al. (1996), all astrophysical works regarding IRAS 20056+3350 adopt the near kinematic distance of 1.67 kpc in analysis of their data. Our trigonometric distance of kpc is 2.8 times larger, thus significantly impacting the interpretation of data collected up to now. As such, we briefly revisit these past observations to summarise the nature of IRAS 20056+3350 - re-evaluated using the trigonometric distance and include also relevant distance-independent results to provide a full account of this MSFR.
4.2.1 Interpreting archive data and using the revised distance
Wood & Churchwell (1989) developed a diagnostic tool used to identify embedded massive OB type stars using IRAS point source catalogue colour criteria. Using their method IRAS 20056+3350 is a candidate for harbouring at least one embedded massive star.
The infrared luminosity of IRAS 20056+3350 from the total IRAS fluxes was estimated as LL⊙ (Casoli et al., 1986) using an assumed distance of 1.0 kpc. At the new distance, 4.69 kpc, it is revised as L L⊙. The bolometric luminosity of IRAS 20056+3350 should be close to LIRAS, assuming that most of the emission from the embedded central star is absorbed and then re-emitted at infrared wavelengths. Using (Allen, 1976), as was done in Casoli et al. (1986), the mass of a central star is revised from to 16.5 M⊙, although the authors did not present the mass of the star. Casoli et al. (1986) also produced a map in 13CO with 4.’4 resolution using the Bordequx 2.5 m telescope and estimated a gas mass of M M⊙ assuming local thermodynamic equilibrium (LTE), a distance of D kpc and an abundance ratio of 13CO/H2 of from Dickman (1978). The molecular gas mass is revised from 56 to M M⊙ using the same assumption as that of Casoli et al. (1986) but the revised distance.
Far infrared (FIR) continuum maps of IRAS 20056+3350 at 450 and 800 from Jenness et al. (1995) clearly show dense cores, indicative of embedded star formation. Their Figures 1 and 2 show that the far infrared emission is associated with both the IRAS point source and water maser source, although the emission peak at is offset from the masers by 5” in the direction of the cluster center. Although radio continuum emission at 8 GHz was marginally detected in their VLA observation, no compact source was identified (Figure 6 in Jenness et al. 1995). This suggests that no HII region is present, although Jenness et al. (1995) do not comment explicitly on this.
To establish the radial velocity of the system we used published thermal molecular line observations since these typically trace ambient molecular gas. The systemic velocities, velocity widths, and telescope beam sizes from single-dish molecular line observations of IRAS 20056+3350 are summarised in Table. 3. From these results we nominally conclude the LSR velocity of the system to be km s-1, where the error is the standard deviation of the listed values.
| Telescope | Band | Photometry | Aperture size | Source name | Mission reference |
|---|---|---|---|---|---|
| (name or m) | (magnitude or flux) | (arcsec) | |||
| UKIDSS | J | mag | 3 | J200731.43+335937.6 | Lucas et al. (2008) |
| H | mag | 3 | J200731.38+335939.4 | ||
| Ks | mag | 3 | |||
| WISE | 3.4 | mag | 8.5 | J200731.37+335940.9 | Cutri et al. (2014) |
| 4.6 | mag | 8.5 | |||
| 12 | mag | 8.5 | |||
| 22 | mag | 16.5 | |||
| AKARI | 9 | mJy | 6 | 2007315+335940 | Ishihara et al. (2010) |
| 18 | mJy | 6 | |||
| IRAS | 60 | Jy | 120 | 20056+3350 | Beichman et al. (1988) |
| 100 | Jy | 120 | |||
| JCMT | 450 | Jy | 3 | 20056+3350 | Jenness et al. (1995) |
| 800 | Jy | 12 |
NH3 (1,1) and (2,2) line observations of IRAS 20056+3350 were carried out by Molinari et al. (1996). The measured line widths were km s-1 and km s-1, respectively. The NH3 and lines predominantly trace the less dense envelope and the dense core, respectively. The authors argue that such sources, that exhibit lower velocity dispersion in the central core compared to the outer envelope, are characteristic of the lack of an ultra compact HII (UCHII) region, and possibly precede this stage.
Zhang et al. (2005) mapped IRAS 20056+3350 in CO using the NRAO 12m telescope and reported a molecular outflow centered at the position of the IRAS source. Lobes of blueshifted and redshifted emission are concentric in the sky-plane indicating that the outflow is orientated to a pole-on geometry. Three velocity components are easily distinguishable in their spectra (panel ID 115 in Fig.2 of Zhang et al. 2005). These components are symmetric about the center in the line profile: the blueshifted component which peaks at km s-1, the parent core at km s-1, and the redshifted component which peaks at km s-1. Emission was detected over the range of 0 to km s-1. From their CO data, Zhang et al. (2005) estimated the outflow parameters of IRAS 20056+3350 using the diagnostics of Garden et al. (1991). Using the near kinematic distance, they estimated the mass, momentum and energy of the outflow as M M⊙, M⊙ km s-1 and E ergs. Our new distance gives outflow parameters M M⊙, M⊙ km s-1 and E ergs.
4.2.2 Spectral energy distribution
A practical method for investigating the physical nature and evolutionary stage of an astronomical object is to draw information from its spectral energy distribution (SED). In this effort we constructed the SED of IRAS 20056+3350 using published data.
Infrared fluxes were extracted from point source catalogues using the NASA Infrared Science Archive (IRSA), from the telescope missions of UKIDSS, WISE, AKARI, and IRAS. We also use JCMT fluxes at 450 and 800 m from Jenness et al. (1995).
The aperture sizes or angular resolutions of each of the catalogs were different. In Figure. 6 we show a three-colour image of IRAS 20056+3350 made using published data from UKIDSS in J, H, Ks bands, and whose catalogue has the the highest angular resolution of any we used. A distinctly redder region is seen in the center-western portion of the cluster. A star forming core with redder colours has more intense radiation at the longer wavelengths which is characteristic of cores which are forming more massive stars. We identify this region as the most likely site of embedded massive stars. Furthermore, a dark lane which is prominent in the -band (Varricatt et al., 2010) and the association of H2O masers support that this is a site of embedded star formation. Thus, we required that flux apertures from all point source catalogues be positionally consistent with this region. Details of the fluxes used in SED fitting are given in Table 4 and the position and sizes of apertures are overlaid onto Figure. 6.
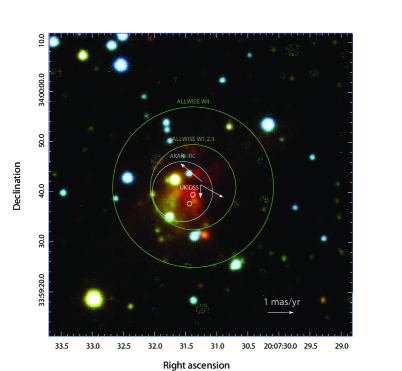
Although the beams of the larger apertures will invariably contain multiple cluster members, we made no corrections for this because our target should be the brightest in the beam; our target is the most massive and the flux from other objects should be negligible, since the luminosity is extremely sensitive to the mass of the object, by the relation L M3.6.
To test the reliability of using the IRAS 60 and 100 bands in our SED we compared the photometries of IRAS and WISE and found them to be consistent, supporting the reliability of using the IRAS fluxes. 450 and 800 fluxes, measured using the James Clarke Maxwell telescope (JCMT) by Jenness et al. (1995), were evaluated with an aperture equivalent to the extent of the FWHM of the observed emission. Inclusion of these fluxes may lead to an overestimation of the integrated SED flux since hot gas associated with the outflow will be included. However, since the core emission is compact and centered on the maser source, the flux is likely dominated by the embedded massive star. These data provide valuable confines for the longer wavelength portion of the SED.
To interpret our photometric data we use the fitting tool of Robitaille et al. (2007) which is well documented in the introductory paper referenced here. The SED of IRAS20056+3350, according to the model fitting is shown in Fig. 7.
The SED model corresponds to a 18.4 M⊙ central star of age yrs, embedded in an envelope of mass 3300 M⊙. The total luminosity of the region is . The luminosity and stellar mass derived from the SED model agrees well with the estimates made using the four IRAS bands by of Casoli et al. (1986) re-evaluated using our distance estimate as and . Furthermore, the envelope mass derived from the SED model agrees within a factor of two with the estimate of the molecular hydrogen content made by Casoli et al. (1986) re-evaluated using our distance estimate as .
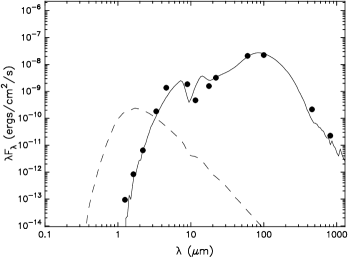
Interestingly, the inclination angle required to produce the best-fit model is 18∘ to the line of sight, which agrees with the general orientation inferred from the CO observations of Zhang et al. (2005). The ability of the SED fitting software to determine the inclination of young stellar object (YSO) systems solely from photometry data has been demonstrated for G34.4+0.23MM in Robitaille (2008) and for IRAS 04368+2557 in Robitaille et al. (2007). In these cases the system inclination had been previously established observationally from the orientation of bipolar outflows and was well matched by the SED fitting tool.
It should be pointed out that the successful fit of the SED model to the photometry data shows only that there exists a theoretical model consistent with the data and it is not proof that the model results truly reflect the nature of the source. The parameters directly determined from the data are luminosity and temperature of the emitting region, the further details (stellar mass, envelope mass, inclination, etc.) depend on the evolutionary tracks applied to the data, this is cautioned in Robitaille (2008). However, in our case the SED results are consistent with the picture drawn from an abundance of data from past observations re-evaluated at the trigonometric distance. It is this consistency rather than the pleasing appearance of the model fit to the data, that raises confidence in our results. These consistencies, along with the common proposed inclination angle, supports the basis of our argument; that the secular proper motion of IRAS 20056+3350 can be reasonably estimated from the group motions of H2O masers associated with the line of sight outflow.
We conclude that IRAS 20056+3350 is a distant site of massive star formation at a young stage in evolution. The existence of an embedded, young massive star is strongly suggested by the IRAS colours, SED, and presence a compact sub-millimeter core. With respect to youth, the evolutionary stage precedes the formation of an ultra compact HII (UCHII) region, this is suggested from the turbulence ratio of the core and envelope seen in NH3 and is corroborated by the lack of significant centimeter structure at 8GHz. Line spectra of core tracing molecular transitions such as CS reveal substantial turbulence (see Table. 3) which is suggested by Ao et al. (2004) to be characteristic of young SFRs which have not yet dissipated primordial turbulent motions inherent in the core. An active bipolar molecular outflow, seen in spectral wings and emission map, appears aligned to the line of sight - which we believe to be associated with the H2O masers we observed with VERA due to the consistency of velocities. The overall picture ascertained from past observations is corroborated by the SED of IRAS20056+3350, which resembles a YSO in the Class I evolutionary phase.
4.3 Structure of the Local Arm
Full-scale studies of the structures of the spiral arms have recently been made available from analysis of the joint results of VLBI annual parallax measurements of MSFRs. Recent cases are; the Local Arm by Xu et al. (2013), the Perseus Arm by (Zhang et al., 2013; Choi et al., 2014), the Saggitarius Arm by Wu et al. (2014) and the general structure is discussed in Reid et al. (2014). IRAS 20056+3350 is the most distant MSFR in the Local arm for which a trigonometric distance has been determined. Therefore, although we cannot justify a large-scale re-evaluation of the Local arm, we can provide an important contribution to the picture recently provided by the aforementioned authors. The nature of the Local arm is discussed particularly in the work of Xu et al. (2013) where the authors consider the three possible scenarios; 1. That the Local Arm is a branch of the Perseus Arm. 2. That the Local Arm may be part of a major arm and connects to the Carina Arm. 3. That it is an independent arm segment - a ‘spur’.
In Fig. 8 we show the position of IRAS 20056+3350 in the context of the Galactic spiral structure, which was recently compiled by Reid et al. (2014) (References for individual SFRs therein). In drawing logarithmic spiral arms they used the Galactocentric distance of the Sun, R kpc.
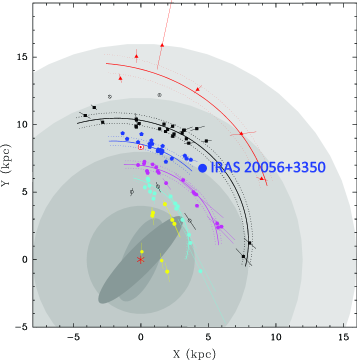
As seen in Fig. 8, the Galactic location of IRAS 20056+3350 diverges somewhat from the logarithmic curve determined for the Local arm by Reid et al. (2014). Deviation is in the direction of the Perseus arm and follows the example of three other MSFRs at the leading tip of the arm; G075.76+00.33 (Xu et al., 2013), G075.78+00.34 (Ando et al., 2011; Xu et al., 2013) and AFGL 2591 (Rygl et al., 2012). The location of IRAS 20056+3350 is generally consistent with what would be expected in the scenario where the Local Arm joins onto the Perseus arm further down into the spiral pattern - scenario 1. of Xu et al. (2013). However, the alternative scenarios cannot be ruled out until this region of the Galaxy is mapped in more detail.
4.4 Evaluation of the Galactic constant
From our trigonometric distance we calculated the Galactocentric distance of IRAS 20056+3350 to be kpc, when using R0 = 8.05 kpc from Honma et al. (2012). Since , and from the low value of km s-1, it is evident that IRAS 20056+3350 resides spatially and kinematically near to the Solar circle.
Nagayama et al. (2011) demonstrated that the angular velocity of Galactic rotation at the Galactocentric distance of the Sun, , can be estimated for objects near the Solar circle and tangent points, with relaxed assumptions on the adopted value of . For objects with negligible peculiar motion, the angular velocity of Galactic rotation at the Sun is given by
| (1) |
where is the distance to the source from the Sun, is the LSR velocity, is the systemic sky-plane proper motion in the direction of Galactic longitude, and km s-1 kpc-1 (mas yr-1)-1 is a unit conversion factor.
In order to make use of Equation (1) we first convert our systematic proper motion estimate into the proper motion with respect to the LSR in the Galactic coordinate system. To correct for the motion of the Sun with respect to the LSR we use the following values: (U⊙,V⊙,W⊙) = (+10.3, +15.3, +7.7) km s-1 (Kerr & Lynden-Bell 1986, see also Ando et al. 2011).
The relevant parameters, determined in this paper, for IRAS 20056+3350 are:
kpc and mas yr-1. We use km s-1 determined from molecular line observations (see section 4.2.1). Applying the above parameters to Equation (1), and using R0 = 8.05 kpc, gives
km s-1 kpc-1
We demonstrate the invariability of this approach on the adopted value of R0 for Solar circle objects by recalculating for a range of values of kpc. This difference produces only a small deviation of km s-1 kpc-1. The value of is consistent with other Solar circle and tangent point sources as discussed in detail in Burns et al. (2014). All such objects produce a value that is higher than that obtained from the ratio of the Galactic constants recommended by the IAU of km s-1 kpc-1 (Kerr & Lynden-Bell, 1986).
5 Conclusions
We measured the trigonometric distance of IRAS 20056+3350 to be kpc, which is 2.8 times larger than the near often adopted in the literature. In measuring the annual parallax the astrometric accuracy in the R.A. and Dec. directions were investigated and the former was found to be significantly influenced by the elongation of maser structure, although the latter was affected negligibly. The astrometric errors evaluated in this analysis were well matched by the error floors required to produce a value of unity in the parallax fitting procedure.
We determined the systematic proper motion of the source to be (, ) = (, ) mas yr-1 under the assumption that the H2O masers used in our observations are associated with a line of sight bipolar outflow. This assumption is justified by the spatial and kinematic proximity of masers to the blue lobe of the bipolar outflow as revealed from archive maps, velocity spectra and an SED model compiled using infrared photometry data interpreted using the fitting tool of Robitaille et al. (2007).
From the accumulation, re-evaluation and summary of various archive data we find IRAS 20056+3350 to be a young MSFR which is forming a central object of considerable mass (16). It is at an evolutionary stage resembling a Class I YSO and appears to precede the formation of an UCHII region.
IRAS 20056+3350 is at the leading tip of the Local arm, near the Solar circle, and its position in relation to the spiral arms tentatively supports that the Local arm may be a branch of the Perseus arm.
Using our results obtained with VERA, and the special geometry applicable to Solar circle objects, we evaluated the angular velocity of Galactic rotation at the Sun, km s-1 kpc-1, which is consistent with other Solar circle and tangent point sources estimated using the same procedure. IRAS 20056+3350 included, all such estimates are higher than the value derived from the ratio of the Galactic constants recommended by the IAU of km s-1 kpc-1.
This research made extensive use of NASA’s Astrophysics Data System (ADS), the SIMBAD database and VizieR catalogue access tool, operated at CDS, Strasbourg, France, and the NASA/IPAC Infrared Science Archive, which is operated by the Jet Propulsion Laboratory, California Institute of Technology, under contract with the National Aeronautics and Space Administration
R.B. would like to thank Andrej Sobolev for stimulating and encouraging discussion on this SFR.
R.B. would like to acknowledge the Ministry of Education, Culture, Sports, Science and Technology (MEXT), Japan for financial support under the Monbukagakusho scholarship.
References
- Allen (1976) Allen, C. W. 1976, in Astrophysical Quantities, 3rd edition (The Athlone Press, University of London)
- Ando et al. (2011) Ando, K., Nagayama, T., Omodaka, T., et al. 2011, PASJ, 63, 45
- Ao et al. (2004) Ao, Y., Yang, J., & Sunada, K. 2004, AJ, 128, 1716
- Bartkiewicz & van Langevelde (2012) Bartkiewicz, A., & van Langevelde, H. J. 2012, in IAU Symposium, Vol. 287, IAU Symposium, ed. R. S. Booth, W. H. T. Vlemmings, & E. M. L. Humphreys, 117–126
- Beichman et al. (1988) Beichman, C. A., Neugebauer, G., Habing, H. J., Clegg, P. E., & Chester, T. J., eds. 1988, Infrared astronomical satellite (IRAS) catalogs and atlases. Volume 1: Explanatory supplement, Vol. 1
- Bronfman et al. (1996) Bronfman, L., Nyman, L.-A., & May, J. 1996, A&AS, 115, 81
- Burns et al. (2014) Burns, R. A., et al. 2014, PASJ, (in press) arXiv:1404.5506
- Casoli et al. (1986) Casoli, F., Combes, F., Dupraz, C., Gerin, M., & Boulanger, F. 1986, A&A, 169, 281
- Chikada et al. (1991) Chikada, Y., Kawaguchi, N., Inoue, M., et al. 1991, in Frontiers of VLBI, ed. H. Hirabayashi, M. Inoue, & H. Kobayashi, 79
- Choi et al. (2014) Choi, Y. K., Hachisuka, K., Reid, M. J., et al. 2014, ArXiv e-prints, arXiv:1407.1609
- Cutri et al. (2014) Cutri, R. M., et al. 2014, VizieR Online Data Catalog, 2328, 0
- Dickman (1978) Dickman, R. L. 1978, ApJS, 37, 407
- Fomalont et al. (2003) Fomalont, E. B., Petrov, L., MacMillan, D. S., Gordon, D., & Ma, C. 2003, AJ, 126, 2562
- Garden et al. (1991) Garden, R. P., Hayashi, M., Hasegawa, T., Gatley, I., & Kaifu, N. 1991, ApJ, 374, 540
- Honma et al. (2008) Honma, M., Tamura, Y., & Reid, M. J. 2008, PASJ, 60, 951
- Honma et al. (2012) Honma, M., Nagayama, T., Ando, K., et al. 2012, PASJ, 64, 136
- Iguchi et al. (2005) Iguchi, S., Kkurayama, T., Kawaguchi, N., & Kawakami, K. 2005, PASJ, 57, 259
- Imai et al. (2011) Imai, H., Omi, R., Kurayama, T., et al. 2011, PASJ, 63, 1293
- Imai et al. (2007) Imai, H., Nakashima, K., Bushimata, T., et al. 2007, PASJ, 59, 1107
- Ishihara et al. (2010) Ishihara, D., Onaka, T., Kataza, H., et al. 2010, A&A, 514, A1
- Jenness et al. (1995) Jenness, T., Scott, P. F., & Padman, R. 1995, MNRAS, 276, 1024
- Kerr & Lynden-Bell (1986) Kerr, F. J., & Lynden-Bell, D. 1986, MNRAS, 221, 1023
- Kobayashi et al. (2003) Kobayashi, H., Sasao, T., Kawaguchi, N., et al. 2003, in Astronomical Society of the Pacific Conference Series, Vol. 306, New technologies in VLBI, ed. Y. C. Minh, 48P
- Lucas et al. (2008) Lucas, P. W., Hoare, M. G., Longmore, A., et al. 2008, MNRAS, 391, 136
- Molinari et al. (1996) Molinari, S., Brand, J., Cesaroni, R., & Palla, F. 1996, A&A, 308, 573
- Moscadelli et al. (2011) Moscadelli, L., Cesaroni, R., Rioja, M. J., Dodson, R., & Reid, M. J. 2011, A&A, 526, A66
- Nagayama et al. (2008) Nagayama, T., Nakagawa, A., Imai, H., Omodaka, T., & Sofue, Y. 2008, PASJ, 60, 183
- Nagayama et al. (2011) Nagayama, T., Omodaka, T., Nakagawa, A., et al. 2011, PASJ, 63, 23
- Reid et al. (2014) Reid, M. J., Menten, K. M., Brunthaler, A., et al. 2014, ApJ, 783, 130
- Robitaille (2008) Robitaille, T. P. 2008, in Astronomical Society of the Pacific Conference Series, Vol. 387, Massive Star Formation: Observations Confront Theory, ed. H. Beuther, H. Linz, & T. Henning, 290
- Robitaille et al. (2007) Robitaille, T. P., Whitney, B. A., Indebetouw, R., & Wood, K. 2007, ApJS, 169, 328
- Rygl et al. (2012) Rygl, K. L. J., Brunthaler, A., Sanna, A., et al. 2012, A&A, 539, A79
- Torrelles et al. (2014) Torrelles, J. M., Curiel, S., Estalella, R., et al. 2014, MNRAS, 442, 148
- Trinidad et al. (2013) Trinidad, M. A., Curiel, S., Estalella, R., et al. 2013, MNRAS, 430, 1309
- Urquhart et al. (2014) Urquhart, J. S., Figura, C. C., Moore, T. J. T., et al. 2014, MNRAS, 437, 1791
- Varricatt et al. (2010) Varricatt, W. P., Davis, C. J., Ramsay, S., & Todd, S. P. 2010, MNRAS, 404, 661
- Wood & Churchwell (1989) Wood, D. O. S., & Churchwell, E. 1989, ApJ, 340, 265
- Wu et al. (2001) Wu, Y., Wu, J., & Wang, J. 2001, A&A, 380, 665
- Wu et al. (2014) Wu, Y. W., Sato, M., Reid, M. J., et al. 2014, A&A, 566, A17
- Xu et al. (2013) Xu, Y., Li, J. J., Reid, M. J., et al. 2013, ApJ, 769, 15
- Zhang et al. (2013) Zhang, B., Reid, M. J., Menten, K. M., et al. 2013, ApJ, 775, 79
- Zhang et al. (2005) Zhang, Q., Hunter, T. R., Brand, J., et al. 2005, ApJ, 625, 864