On the surface density of dark matter haloes
Abstract
In this article, we test the conclusion of Donato et al. (2009) concerning the universality of the DM halo surface density . According to our study, the dispersion of values of is twice higher than that found by Donato et al. (2009). We conclude, in contrast with Donato et al. (2009), that the DM surface density and its Newtonian acceleration are not constant but correlate with the luminosity, morphological type, colour index, and the content of neutral hydrogen. These DM parameters are higher for more luminous systems of early types with red colour and low gas content. We also found that the correlation of DM parameters with colour index appears to be the manifestation of a stronger relation between DM halo mass and the colour of a galaxy. This finding is in agreement with cosmological simulations (Guo et al, 2011). These results leave little room for the recently claimed universality of DM column density. We also found that isolated galaxies in our sample (contained in the Analysis of the interstellar Medium of Isolated GAlaxies (AMIGA) catalogue) do not differ significantly in their value of from the entire sample. Thus, since the AMIGA catalogue gives a sample of galaxies that have not interacted with a significant mass neighbour in the past 3 Gyr, the difference between the systems with low and high values of is not related to the merging events during this period of time.
keywords:
galaxies: formation – galaxies: haloes.1 Introduction
Although the CDM model has been shown in the last decade to predict with high accuracy observations on cosmological 111 However, even at these scales the CDM paradigm is affected by the cosmological constant problem (Weinberg, 1989; Astashenok & del Popolo, 2012), and the “cosmic coincidence problem and the total ignorance on the origin of the accelerated expansion of the Universe (Del Popolo et al. 2013a, b, Del Popolo et al. 2013)., and intermediate scales (Spergel et al. 2003; Kowalski et al. 2008; Percival et al. 2010; Komatsu et al. 2011; Del Popolo 2007; Del Popolo 2013; Del Popolo 2014), the quoted paradigm is not successful to the same extent in explaining observations on smaller scales, from tens of pc to some kpc. A well-known problem of the CDM model on small scales is the discrepancy in the predicted cuspy density profiles of galaxies in N-body simulations (Navarro et al. 1996; Navarro et al. 1997; Navarro et al. 2010), and the observed cored profiles in dwarf spirals, dwarf spheroidals (dSphs) and low-surface-brightness galaxies (Burkert 1995; de Blok et al. 2003; Swaters et al. 2003; Del Popolo 2009 (DP09), Del Popolo & Kroupa 2009; Del Popolo 2010, Del Popolo 2012a Del Popolo 2012b (DP12a, DP12b); Del Popolo & Hiotelis 2014; Oh et al. 2011; Oh et al. 2011; Kuzio de Naray & Kaufmann 2011). This problem, known as the cusp/core problem (Moore 1994; Flores & Primack 1994) is flanked by the “missing satellite problem” dealing with the discrepancy between the number of subhaloes predicted in N-body simulations (Klypin et al. 1999; Moore et al. 1999) and that observed. The subhaloes predicted in simulations are not only more numerous than satellites of galaxies like the Milky Way (MW), but also more dense than expected (Boylan-Kolchin et al. 2011; Boylan-Kolchin et al. 2012). Smooth Particle Hydrodynamics (SPH) simulations of a galaxy with not enough large resolution, and not taking properly account of feedback mechanisms, like, for example, supernovae explosions, produce discs too small with respect to the discs of spiral galaxies (van den Bosch et al. 2001; Mayer et al. 2008). The angular momentum distributions produced are not in agreement with those observed, since angular momentum is lost during repeated collisions through dynamical friction. Additional concerns come from the flatness at the low-mass end of the luminosity function (e.g., Montero-Dorta & Prada 2009), the galactic stellar mass function (Baldry et al. 2008; Li & White 2009), and the HI mass function (Martin et al. 2010, as well as the “void phenomenon” (Peebles 2001; Tinker & Conroy 2009), and the discrepancy in the sizes of mini-voids obtained in CDM simulations and those observed (Tikhonov & Klypin 2009).
Several solutions have been proposed to the previous problems, based on modifying the particles constituting dark matter (DM) (Colín et al. 2000; Sommer-Larsen & Dolgov 2001; Goodman 2000; Peebles 2000), modifying the power spectrum (e.g. Zentner & Bullock 2003), modifying the theory of gravity (Buchdahl 1970; Starobinsky 1980; Milgrom 1983b; Milgrom 1983a; Ferraro 2012), or astrophysical solutions based on mechanisms that “heat” DM222 The two main mechanisms are a) supernovae feedback (Navarro et al. 1996; Gelato & Sommer-Larsen 1999; Read & Gilmore 2005; Mashchenko et al. 2006, Mashchenko et al. 2008; Governato et al. 2010; Zolotov et al. 2012), and b) transfer of energy and angular momentum from baryons to dark matter through dynamical friction (El-Zant et al. 2001, 2004; Romano-Díaz et al. 2008, Romano-Díaz et al. 2009; Del Popolo 2009; Cole et al. 2011; Del Popolo & Hiotelis 2014; Del Popolo et al. 2014) .
Delegating the solutions of the previous problems to the poorly understood and complex phenomena happening in dense plasma and to baryonic physics in general is more natural, but not easy.
Often in astrophysics, scaling relations are of noteworthy help in understanding complex phenomena and in constraining DM properties and formation scenarios.
In this context, Kormendy & Freeman (2004) found several interesting relations among DM halo parameters, obtained through mass modelling of the rotation curves of 55 galaxies using a pseudo-isothermal profile as a fitting profile. Of particular interest is the quantity , where is the core radius of the pseudo-isothermal profile, and its central density. They found that the previous quantity, the surface density of DM haloes, is independent of galaxy luminosity in the case of late-type galaxies and has a value of . The previous result was extended by Donato et al. (2009) (hereafter D09) using spiral galaxies, and dwarfs rotation curves and the weak lensing of spirals and ellipticals; they claimed a quasi-universality of the central surface density of DM haloes.
Prompted by the previous claim, Milgrom (2009) showed that modified Newtonian dynamics (MOND) predicts, in the Newtonian regime, a quasi-universal value of for every different kind of internal structure and for all masses. The quoted quasi-universality was extended by Gentile et al. (2009) (G09) to luminous matter surface density. Namely, they claimed that the ratio of luminous to dark matter is constant within one halo scalelength.
The D09 and G09 results are based on the assumption that all galaxies, from dwarfs to ellipticals, are fitted by a Burkert DM halo density profile:
| (1) |
The Burkert profile usually gives a good fit to the rotation curves of dwarfs and LSBs (Gentile et al. 2004, Gentile et al. 2007; Del Popolo 2009), but exceptions exist (Simon et al. 2005; de Blok et al. 2008; Del Popolo 2012b). For example Simon et al. (2005) showed that in the case of NGC 2976, 4605, 5949, 5693 and 6689, the inner slope of the density profile spans a range (NGC 2976) to (NGC 5963). de Blok et al. (2008) found that brighter, larger galaxies with have density profiles well fitted by both cuspy profiles and cored ones, while less massive galaxies with are best fitted by cored profiles. Even the MW dSphs could have cuspy profiles. According to Strigari et al. (2010), and Breddels & Helmi (2013), Fornax has a cuspy profile, while it is cored according to other authors (Jardel & Gebhardt 2012; Jardel et al. 2013; Jardel & Gebhardt 2013; Breddels et al. 2013; Walker & Peñarrubia 2011; Amorisco & Evans 2012; Battaglia et al. 2008; Agnello & Evans 2012).
Concerning elliptical galaxies, the analysis is more complex than in the case of spirals. Several methods are used to study the content and distribution of DM, for example the virial theorem (see Del Popolo 2014), the X-ray properties of the emitting hot gas (see Buote & Humphrey 2012 for a review, Nagino & Matsushita 2009), the dispersion velocities of kinematical tracers and stellar dynamics (see Gerhard 2010 for a review; Napolitano et al. 2011) and combining weak and strong lensing data (see Ellis 2010 and Treu 2010 for a review).
Nowadays we know from X-ray, lensing observations and stellar dynamics studies that elliptical galaxies are surrounded by large DM haloes, even if studies of some years ago, based on Jeans analysis, concluded that the quantity of DM in ellipticals was meagre (Romanowsky et al. 2003)333Romanowky’s conclusion that ellipticals contained a dearth of DM, based on a falling velocity dispersion, was later revised by Dekel et al. (2005) through simulations of merging spiral galaxies, which again showed a falling velocity dispersion, even if the galaxies contained plenty of DM.
In the present day, Chandra, XMM, and Suzaku have measured the temperature profiles of many galaxies accurately, leading to precise constraints on the ratios of those galaxies (see Buote & Humphrey 2012 and references therein). The increase of with radius, the dynamics of satellite galaxies (Prada et al. 2003) and weak lensing (Hoekstra et al. 2005; Kleinheinrich et al. 2006; Mandelbaum et al. 2006; Heymans et al. 2006) show that the DM halo mass is much larger than the stellar mass. However, doubts remain as to the functional form of the best-fitting DM profile (e.g. Navarro-Frenk-White (NFW), consistent with X-ray data, and the Sersic-Einasto profile (Merritt et al. 2006; Graham 2013) consistent with dissipationless simulations).
The previous discussion puts obvious doubts on the conclusions of D09 and G09, based on the assumption that all the galaxies in their sample are well fitted by cored profiles, namely the Burkert profile.
Several authors have studied the surface density of galaxies, reaching opposite results to those of D09 and G09, namely that the surface density is not universal. Napolitano et al. (2010) showed that the projected density of local early-type galaxies within the effective radius is larger than that of dwarfs and spirals. This systematic increase with the mass of the halo was also noticed by Boyarsky et al. (2009). The Boyarsky et al. (2009) sample was larger than those of D09 and G09, including groups and clusters. The dark matter column density, , defined by Boyarsky et al. (2009) as
| (2) |
is proportional to the mean surface density in (i.e., is equal to for the Burkert density profile). Here is the characteristic scale at which the inner slope of the DM density profile changes towards its outer asymptotic value, with an average density within this radius. The dark matter column density, , is given in Boyarsky et al. (2009) by
| (3) |
with S in . Cardone & Tortora (2010), based on central velocity dispersion of local galaxies and strong lensing at intermediate redshift, have shown that the Newtonian acceleration and column density correlate with different quantities: the visual luminosity , the effective radius , the stellar mass and the halo mass in agreement with Boyarsky et al. (2009) and in disagreement with the results of D09 and G09.
Napolitano et al. (2010) calculated , which is proportional to the column density , for a large sample of elliptical galaxies. They found that early-type galaxies violate the constant-density scenario.
Del Popolo et al. (2013) found a correlation of the surface density with , in agreement with Napolitano et al. (2010), Cardone & Tortora (2010), and Boyarsky et al. (2009), but with a smaller scatter, and they also found a correlation between baryon column density and mass.
The results of Cardone & Del Popolo (2012) followed as close as possible the analysis of D09 end G09, but improving the way the halo models were estimated444D09 and G09 evaluated the haloes parameters adjusting previous results published in literature, while Cardone & Del Popolo (2012) estimated the halo model parameters by fitting the rotation curves. and doubling the D09, G09 sample, allowing for an investigation of selection effects. They found a correlation between the Newtonian acceleration and the virial mass , testifying against the universality claimed in the D09 and G09 articles.
In the present article, we extend the sample used in Cardone & Del Popolo (2012) to study whether new data change the Cardone & Del Popolo (2012) and Del Popolo et al. (2013) conclusions. Moreover, we expand the previous analysis, studying whether the surface density and Newtonian acceleration correlate with luminosity, morphological type, colour index and neutral hydrogen content.
The article is organized as follows. In Section 2, we discuss the methods utilized to obtain the parameters of DM haloes in the current article. In Section 3, we discuss the uncertainties in the DM parameter estimates, including the possible effect of non-universality of the initial mass function (IMF); results are given in Section 4, while Section 5 is devoted to a discussion and conclusions.
2 On the methods of DM halo parameters estimation
As previously reported, it was claimed by D09 that the surface density of DM haloes is constant for galaxies of different types and luminosities. The universality of the surface density of DM haloes is intriguing, because according to D09 it persists for dark halo parameters obtained using different methods. In fact, different approaches could give significantly different results even when applied to the same systems. For disc galaxies, one can perform the decomposition of the rotation curve into the contributions of bulge, gaseous and stellar disc and DM halo:
| (4) |
2.1 Best-fitting model of the rotation curve
Using the so-called best-fitting model, based on minimizing the deviation of the model rotation curve from the observed one, could give rise to different parameters of the dark matter halo for the same object. This problem can have several solutions, due to the uncertainty of the baryonic contribution to the total mass of a galaxy. To avoid this degeneracy, one should introduce additional information when performing mass modelling of disc galaxies. To do this, one can fix the surface density of the baryonic matter and consequently the contributions to the rotation curve of the bulge and the disc:
| (5) |
where , , and are modified Bessel functions and and are the central surface density and exponential scalelength of an exponential disc. The bulge contribution is modelled in the same way as for the disc: when the density distribution is known (it is usually accepted to be proportional to the surface brightness, e.g. King s or Sersic s law), one can obtain the gravitational potential using Poisson s equation:
| (6) |
After that, one can calculate the contribution to the circular velocity:
| (7) |
When the contributions of bulge and disc to the rotation curve are known, the model of the rotation curve is constructed by choosing the parameters of the DM halo minimizing the remaining difference between the baryonic and observed rotation curves. To fix the baryonic density, one uses additional observational data. In the absence of additional information on the baryonic density, one can use the maximum disc model, in which one adopts the highest possible contribution of baryonic matter to the rotation curve.
2.2 Photometric approach
To obtain the surface density of the stellar disc and bulge, one can use stellar population synthesis models together with surface photometry (see e.g. de Blok et al. 2008). In this approach, the stellar surface density radial profile is calculated from the profile of surface brightness multiplied by the mass-to-light ratio, which is obtained from the observed colour index and stellar population synthesis model – colour relation (see e.g. Bell & de Jong 2001):
| (8) |
The density of the gaseous disc could be found from radio observations.
One can also perform a more detailed analysis to put constraints on the stellar density distribution, as was done in Kasparova et al. (2014), where the density of the stellar bulge and disc were determined from modelling of long-slit stellar spectra, together with the spectral energy distribution.
2.3 Method based on spiral-arm density-wave theory
Another way to fix the baryonic density in mass decomposition is to take into account the presence of spiral structure (see e.g. Athanassoula et al. 1987, Fuchs 2003). Density wave theory allows us to make a prediction of the number of spiral arms. The circumferential wavelength of the spiral density waves is connected to the critical wavelength, which in turn is related to the density of the disc:
| (9) |
where is the surface density of the disc, is gravitational constant and is the epicyclical frequency, determined by the angular velocity . The number of spiral arms is connected to the critical wavelength through the equation , where is the coefficient depending on the slope of the rotation curve. Thus knowing the number of spiral arms allows one to determine the density of the disc, which can be fixed in rotation curve decomposition. This in turn allows one to narrow the range of possible parameters of the DM halo.
2.4 The approach based on the disc marginal gravitational stability
In another approach, one can use the marginal gravitational stability criterion (see Bottema 1993; Zasov et al. 2011; Saburova 2011; Saburova & Zasov 2012) to obtain the density of the disc. For a thin disc with parameters slowly varying with , the local critical value of the radial velocity dispersion of stars is defined by the Toomre criterion:
| (10) |
where and parameter depends on the radius and lies in the range (see Khoperskov et al. 2003). Thus, if the radial stellar velocity dispersion is known, one can assume that the disc is in a marginally stable state, estimate the surface density of the disc independently and then use it in mass modelling.
2.5 Techniques applied to ellipticals and dwarf spheroidals
To determine the DM halo parameters of elliptical galaxies, one can use the X-ray properties of hot gas (see e.g. Humphrey et al. 2006), planetary nebulae or stellar kinematical data (see e.g. Napolitano et al. 2009 and Weijmans et al. 2009). The DM properties of dwarf spheroidal galaxies could also be obtained from kinematical data by applying Jeans analysis to the velocity dispersion profiles (see Frigerio Martins 2009). Wu (2007) performed modelling of dSph galaxies as axisymmetric stellar systems in spherical potentials, which are in dynamical equilibrium without significant external tidal forces.
3 On the uncertainty of the estimate of DM parameters
As different approaches use different assumptions, they can give different results. A good example of this could be LSBs. Based on stellar population models with standard Salpeter-like stellar IMF, LSBs are believed to be dark-matter-dominated systems. However, some independent estimations of their disc masses give evidence that LSBs may have extremely high disc mass-to-light ratios in the presence of a dark halo of moderate mass (see e.g. Saburova 2011, Fuchs 2003), which can be explained if the IMF of LSBs is not universal but rather bottom-heavy (with an excess of low mass stars, which contribute to the mass of the galaxy but have no significant contribution to the luminosity: see Lee et al. 2004). Different assumptions made for these objects lead to a different understanding of their nature and consequently to different DM parameters.
| Galaxy | Aproach | Source | ||
| kpc | ||||
| (1) | (2) | (3) | (4) | (5) |
| NGC2841 | spiral structure analysis | 0.005 | 30 | Athanassoula et al. (1987) |
| spiral structure analysis | 0.004 | 32.6 | Athanassoula et al. (1987) | |
| photometric approach, Kroupa IMF | 3.215 | 0.63 | de Blok et al. (2008) | |
| photometric approach, Salpeter IMF | 0.299 | 2.03 | de Blok et al. (2008) | |
| best fit | 0.675 | 1.36 | de Blok et al. (2008) | |
| best fit | 0.09 | 3.7 | Kasparova (2012) | |
| best fit | 0.16 | 5.91 | Cardone & Del Popolo (2012) | |
| M33 | spiral structure analysis | 0.011 | 8 | Athanassoula et al. (1987) |
| best fit | 0.011 | 13 | Corbelli (2003) | |
| gravitational stability condition | 0.009 | 7.5 | Saburova & Zasov (2012) | |
| NGC3198 | spiral structure analysis | 0.002 | 23.4 | Athanassoula et al. (1987) |
| photometric approach, Kroupa IMF | 0.047 | 2.72 | de Blok et al. (2008) | |
| photometric approach, Salpeter IMF | 0.033 | 3.22 | de Blok et al. (2008) | |
| best fit | 0.047 | 2.71 | de Blok et al. (2008) | |
| best fit | 0.064 | 3.19 | Kasparova (2012) | |
| best fit | 0.013 | 9.81 | Cardone & Del Popolo (2012) | |
| ESO186-55 | best fit | 4.3 | 0.33 | Shchelkanova et al. (2013) |
| best fit | 1.40 | 0.71 | Shchelkanova et al. (2013) | |
| gravitational stability condition | 5.90 | 0.27 | Shchelkanova et al. (2013) | |
| gravitational stability condition | 16.0 | 0.13 | Shchelkanova et al. (2013) | |
| ESO234-13 | best fit | 2.1 | 0.48 | Shchelkanova et al. (2013) |
| gravitational stability condition | 3.10 | 0.38 | Shchelkanova et al. (2013) |
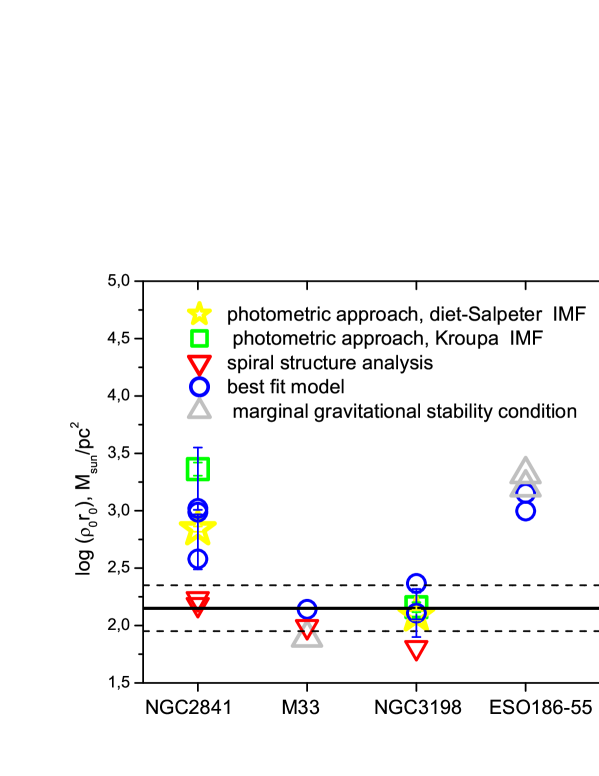
To explore how uncertain the parameters of a DM halo might be, we compared the DM surface densities obtained using different approaches for three well-studied high-surface-brightness galaxies – NGC 2841, M33 and NGC 3198 – and two LSBs – ESO 186 55 and ESO 234 13 (see Fig. 1). Different colours in Fig. 1 correspond to different methods of rotation curve decomposition, which include best-fit modelling, an approach based on spiral structure analysis, a method based on the marginal gravitational stability condition and the photometric approach. For the source of the DM parameters, see Table 1. It follows from Fig. 1 that the dispersion of DM surface density could reach 1.2 dex for the same galaxy (for NGC 2841). This is mostly due to the fact that every method has its own uncertainty. For example, the method based on the marginal gravitational stability condition gives only the upper limit of the surface density of the disc, because the disc could have a stellar velocity dispersion higher than is needed for the gravitationally stable state and hence this gives the lower limit of the DM halo density.
In best-fit modelling, due to the unknown contribution of baryonic matter to the total mass of the galaxy, one can obtain several solutions of the problem of rotation curve decomposition that reproduce the observed rotation curve equally well.
3.1 On the non-universality of the IMF and its possible effects on DM halo parameter estimates
The photometric approach is based on the assumption that the IMF is universal. However, there is evidence that the IMF could change in early-type galaxies with central stellar velocity dispersion, mass (see, e.g. La Barbera et al. 2013, Ferreras et al. 2013) and stellar mass-to-light ratio (Cappellari et al. 2012). Tortora et al. (2013) concluded that early-type galaxies with high central stellar velocity dispersion tend to have an excess of low mass stars relative to spirals and early-type galaxies with low velocity dispersions. Recently, Martín-Navarro et al. (2014) found that the IMF could also vary with radius. Systematic changes of the IMF could lead to systematic changes of stellar mass estimations and consequently to a difference in DM surface densities. The DM halo surface densities calculated from the DM halo parameters obtained by de Blok et al. (2008), taking into account transformations to the Burkert DM density distribution (see Section 4 for the equations), are systematically different for Kroupa (Kroupa 2001) and diet-Salpeter (Salpeter 1955) IMFs. The mean value of the pseudo-isothermal DM halo density for the diet-Salpeter IMF is , whereas for Kroupa IMF: . The same conclusion is valid for a cuspy NFW profile: the DM surface density is higher for models with Kroupa IMF, , than for the Salpeter IMF, . The surface density of the DM halo is higher for the Kroupa IMF, because it corresponds to 1.4 times lower stellar mass. One should mention, however, that the difference between the DM surface densities obtained for the different IMFs is quite moderate and the estimates are consistent within the errors.
Another possible effect of IMF variation could appear, due to the fact that mass models with lower stellar s are often obtained for the cuspy profiles due to the steeper mass distribution (see de Blok et al. 2008). Lower stellar could be a result of a lower amount of low mass stars and correspondingly different IMF. To evaluate the influence of this effect on DM surface densities, we calculated the values of from the DM parameters of the best-fitting models of de Blok et al. (2008) for NFW and pseudo-isothermal density distributions. In the calculation, we used transformations to the Burkert profile given in Section 4. We obtained the following values of the mean surface densities: for the pseudo-isothermal density distribution and for the NFW profile. The DM surface density is slightly higher for the NFW case in comparison with the pseudo-isothermal distribution. However, the difference is within the errors.
In the current article, for the DM parameters obtained by the photometric approach, the IMF is universal and has a diet-Salpeter form (Salpeter 1955). According to Tortora et al. (2013), one can expect that there could be a systematic change of the IMF from early to late-type galaxies. Early-type galaxies with high central velocity dispersion could possess higher stellar in comparison with spirals. Having in mind that we use the diet-Salpeter IMF, which corresponds to models that are close to the maximum disc models (see de Blok et al. 2008), we can expect that we will overpredict the stellar density for late-type galaxies. At the same time, we obtain a correct or even underestimated stellar surface density for early-type galaxies. Bearing in mind the discussion given above, this could mean the underestimation of DM surface density for spirals and overprediction for early-type galaxies. This could be the origin of the systematic effects in the relations discussed below. To avoid systematics that could be a result of the possible non-universality of the IMF, we used not only photometric but also other approaches for galaxies in the same range of luminosities, types and colours. We also calculated the averaged DM parameters for those galaxies for which values of DM parameters were obtained in different articles by different approaches. As can be seen below, all our conclusions are valid for galaxies with averaged estimates. This could mean that the non-universality of the IMF has no significant influence on our main conclusions.
4 Results
As follows from the previous section, different approaches could
lead to different DM parameters. As every method has its own weak
point, it is important to use DM parameters obtained by different
approaches in order to compensate for the uncertainties in each
particular approach. Use of different approaches allows us to make
general conclusions on the constancy of DM halo surface density.
Having that in mind, we tested the constancy of DM surface density
for the DM parameters available in the literature and obtained
using the methods described above. When several DM parameter
estimates were available for a galaxy, we averaged these parameters,
taking into account the error bars and the difference in the
adopted distances. When errors in DM parameters were absent in
the source article, we assumed that the error is 30 per cent during
averaging. The properties of the sample galaxies are given in Table LABEL:sample. We used a
sample of galaxies and some methods that differ from those utilized
in D09. Moreover, in contrast to D09, we used averaged DM
parameters for those galaxies with several estimates of the DM parameters
available in the literature, which allows us partly to avoid
the systematic effects of the methods. The sample consists of 211
galaxies of different types. We used the following approaches to the
DM parameter estimation described in Section 2:
(i) – best fit modelling of the rotation curves (Shchelkanova et al. 2013, Barnes
et al. 2004, Kasparova 2012, Chemin et al. 2006, van Eymeren et al. 2009, Weijmans
et al. 2008, Spano et al. 2008, de Blok &
Bosma 2002, van den Bosch
& Swaters 2001, Corbelli 2003, Cardone & Del
Popolo 2012
);
(ii) – maximum disc model of the rotation curve ( Swaters et al. 2003, Swaters et al. 2011);
(iii) – method based on the stellar population synthesis model
colour-mass-to-light ratio relation (de Blok et al. 2008 (THINGS), Lelli
et al. 2010555The parameters given by Lelli
et al. (2010) are made by maximizing the disc contribution to the rotation curve, however the disc mass-to-light ratios are very close to the ones that could be found from the observed colour indices and Bell & de
Jong (2001) -colour relations obtained for diet-Salpeter IMF (B-V=0.9 for Malin1 corresponds to (3.3 in Lelli
et al. 2010) for NGC7589 (Galaz et al. 2006) corresponds to (2.6 in Lelli
et al. 2010) ). , Weldrake
et al. 2003, Weijmans
et al. 2008666We used two estimates of the DM parameters given by Weijmans
et al. (2008). The first one corresponds to the maximum disc model. In this model the mass-to-light ratio of stellar population is close to that found for Salpeter IMF. However the authors argue that in this case the mass-to-light ratio is too high. Thus we also used their second model in which the stellar mass-to-light ratio corresponds to the Kroupa IMF and averaged these two estimates., Kuzio de Naray et al. 2008, Begum &
Chengalur 2004);
(iv) – approach based on the spectral energy distribution and longslit
spectra modelling (Kasparova et al. 2014);
(v) – method relying on the marginal gravitational stability of the
disc (Shchelkanova et al. 2013, Saburova &
Zasov 2012);
(vi) – approach taking into account the presence of spiral structure (Athanassoula et al. 1987);
(vii) – method in which the stellar mass-to-light ratio is obtained
from the colour index (the so-called ”Bottema disc” of de Blok &
McGaugh 1997);
(viii) – method based on the X-ray properties of hot gas (Humphrey
et al. 2006);
(ix) – Jeans analysis based on planetary nebulae or stellar kinematical
data (Napolitano et al. 2009, Napolitano
et al. 2011, Weijmans et al. 2009, Frigerio
Martins 2009);
(x) – modelling reproducing the observed velocity dispersion profiles
and number density profiles (Wu 2007).
In all sources specified above, the authors used four types of DM density profile.
(i) Pseudo-isothermal profile:
| (11) |
This type of distribution was used in the following articles: Barnes et al. (2004), Kasparova (2012), Kasparova et al. (2014), van Eymeren et al. (2009), Weijmans et al. (2008), de Blok & Bosma (2002), Saburova & Zasov (2012), de Blok & McGaugh (1997), Begum & Chengalur (2004), Lelli et al. (2010), Weldrake et al. 2003, Swaters et al. (2003), Swaters et al. (2011).
(ii) Burkert profile:
This (see eq. 1) was utilized by Corbelli (2003), Shchelkanova et al. (2013), Cardone & Del
Popolo (2012), and Frigerio
Martins (2009).
(iii) Isothermal DM density distribution:
| (12) |
(Athanassoula et al. 1987, Chemin et al. 2006, Spano et al. 2008).
(iv) NFW profile:
| (13) |
was adopted by Humphrey et al. (2006), Napolitano et al. (2009), Napolitano et al. (2011), Wu (2007), Weijmans et al. (2009),van den Bosch & Swaters (2001).
To make our analysis more general, we transformed the DM surface densities to the Burkert profile . When the parameters of the DM halo were given for pseudo-isothermal or NFW density distributions, we translated them to the values of a Burkert DM halo using the formulae from Boyarsky et al. (2009):
| (14) |
| (15) |
For the case of an isothermal distribution, we used the transformation from D09:
| (16) |
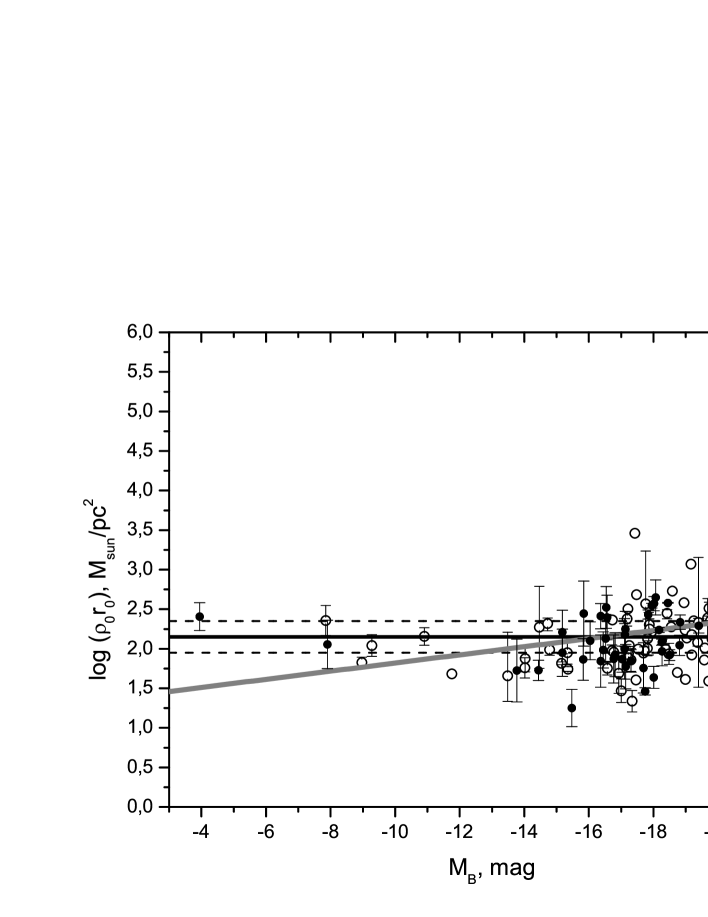
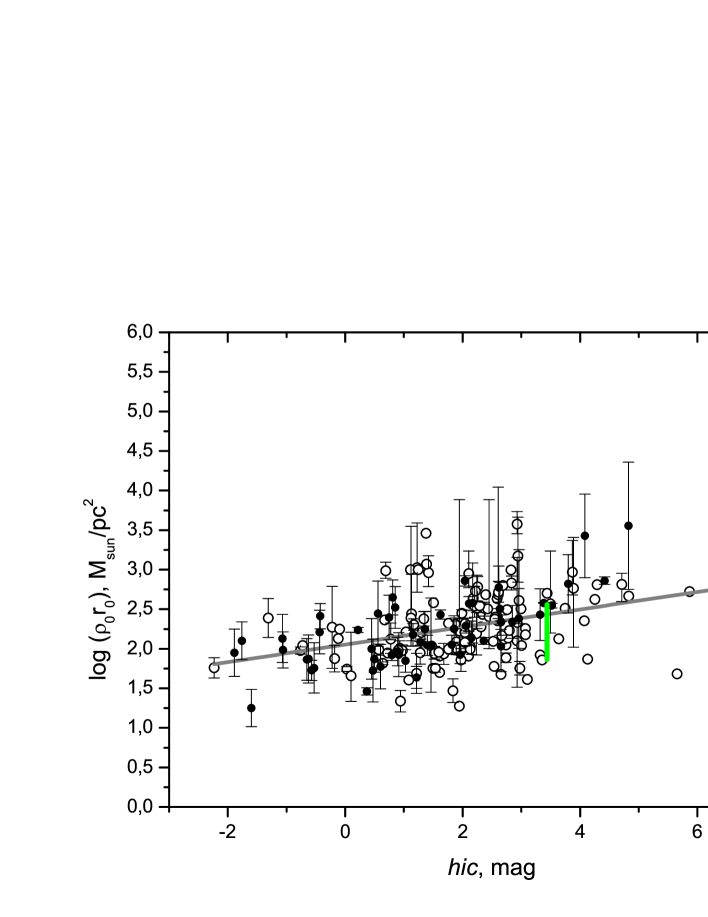
We compared the dark halo surface density with the absolute B magnitude, as was done by D09 (see Fig. 2). Circles correspond to the DM surface densities obtained for the sample. Galaxies for which DM parameters were obtained in more than one source and averaged estimates of the DM parameters obtained are marked by filled symbols. The error bars in Fig. 2 are calculated from the error values of the DM halo parameters given in the source article, according to the formula
| (17) |
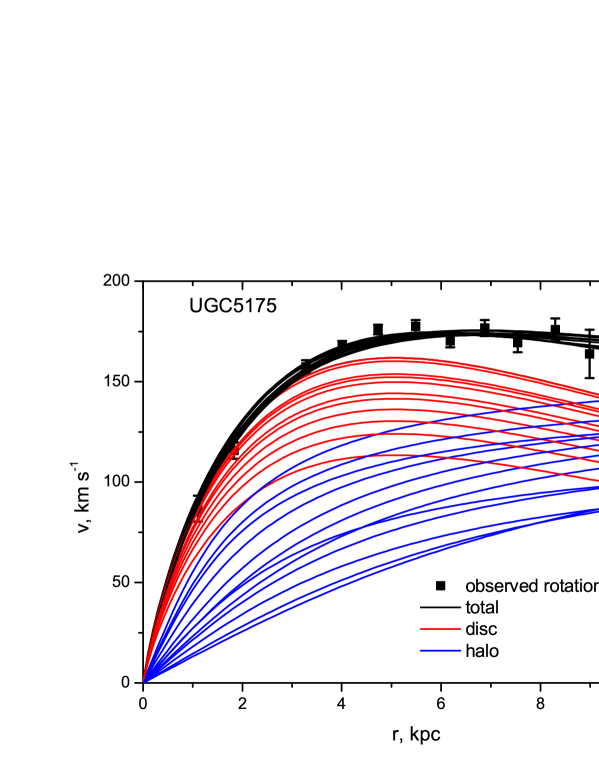
To define the typical error bar that occurs due to the uncertainty in the rotation curve decomposition, we constructed different models of the rotation curve of UGC 5175 (as an example), using a fixed scalelength of baryonic matter kpc (Spano et al. 2008). We used a pseudo-isothermal density distribution of the DM halo. The rotation curve was taken from Spano et al. (2008). The parameters obtained for the DM halo and stellar disc of the galaxy are given in Table 2, while the corresponding rotation curve models are shown in Fig. 3. Blue, red, and black lines in Fig. 3 correspond to the contributions of the DM halo and the disc to the rotation curve and the total model rotation curve.
| Number | |||||
|---|---|---|---|---|---|
| kpc | |||||
| (1) | (2) | (3) | (4) | (5) | (6) |
| 1 | 2.00 | 98.28 | 2.35 | 747 | 1.65 |
| 2 | 3.54 | 31.32 | 2.10 | 904 | 1.89 |
| 3 | 6.91 | 9.58 | 1.88 | 1055 | 1.87 |
| 4 | 5.37 | 11.94 | 1.86 | 1055 | 1.70 |
| 5 | 3.78 | 18.89 | 1.91 | 1034 | 1.59 |
| 6 | 3.06 | 43.41 | 2.18 | 837 | 2.36 |
| 7 | 1.49 | 213.31 | 2.56 | 518 | 3.13 |
| 8 | 1.59 | 164.60 | 2.47 | 620 | 2.56 |
| 9 | 1.60 | 146.84 | 2.43 | 684 | 2.11 |
| 10 | 2.46 | 44.90 | 2.10 | 934 | 1.47 |
| 11 | 3.45 | 26.77 | 2.02 | 952 | 1.73 |
| 12 | 2.60 | 60.49 | 2.25 | 807 | 1.80 |
The range of different dark halo parameters for UGC 5175 is shown by the green line in Fig. 2 and below; this line could be interpreted as the typical error bar for objects with absent error values.
From Fig. 2, it can be seen that the scatter of the dark matter halo parameters is twice as high as that found by D09. The mean value is . A very slight trend can also be seen towards higher values of for more luminous (and consequently more massive) systems, in agreement with what was previously found by Boyarsky et al. (2009). Boyarsky et al. (2009) claimed that this trend is in good agreement with cosmological simulations of dark matter by Macciò et al. (2008). The linear regression line is shown in Fig. 2 by gray line777Here and below we calculated a simple linear regression.. The linear regression equation can be found in Table 3. The correlation coefficient of the trend is quite low; however, it is still statistically significant. Table 3 gives also the twice standard error of correlation coefficient , where N is the number of objects. The correlation is also significant if we consider only those galaxies for which several DM parameter estimations were available and averaged (see Table 3). The averaged estimates are more reliable, since the systematic effects of the various approaches to DM parameter evaluation have less influence.
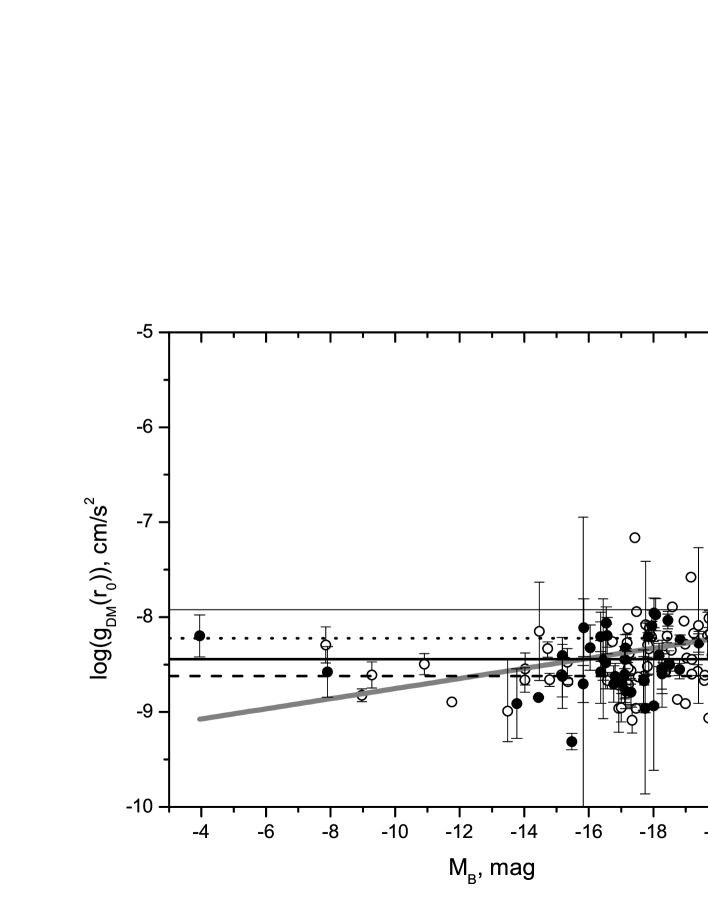
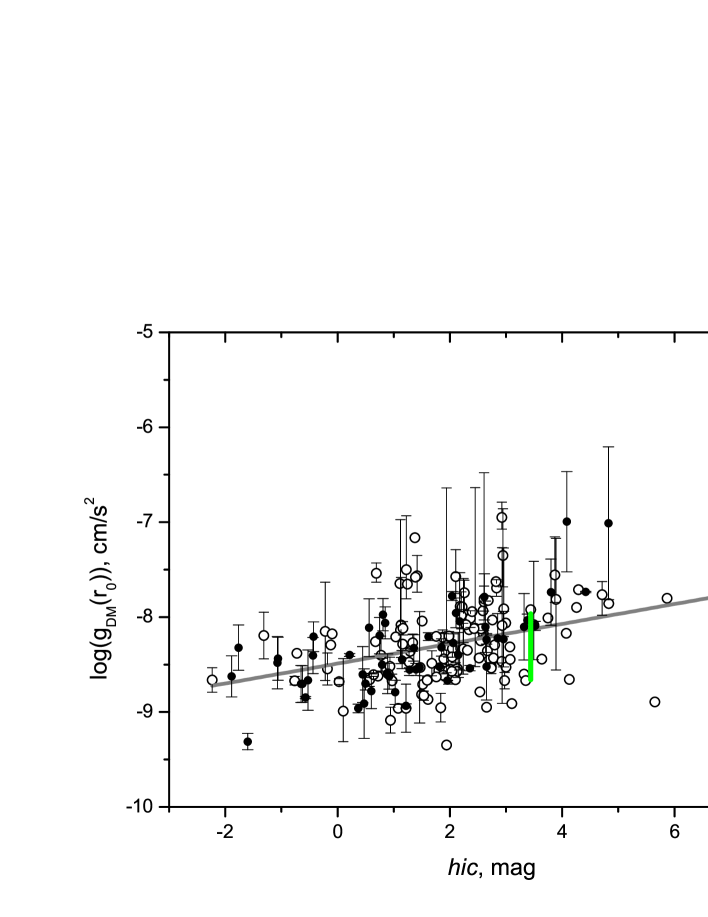
Besides the – diagram, we also compared the DM Newtonian acceleration within , namely , with the absolute B-band magnitude (see Fig. 4).
From Fig. 4, it follows that there is a slight trend towards higher accelerations for higher luminosities, in good agreement with the findings of Cardone & Del Popolo (2012). Our sample includes the sample of Cardone & Del Popolo (2012) and is larger than it. Additionally, we utilize different techniques of DM parameter evaluation, while Cardone & Del Popolo (2012) used only best-fit modelling. The gray line in Fig. 4 denotes the linear regression line. The equation and correlation coefficient with twice its standard error are given in Table 3 for both the entire sample and only those galaxies with averaged estimates.
From Figs. 2 and 4, it can be seen that the behaviour of high and low-luminosity systems in the diagrams is different. Dwarf galaxies with mag seem to have lower variation of DM surface density and acceleration with absolute magnitude, in contrast to high-luminosity systems, which show a stronger linear trend of these DM parameters with luminosity. To study this dichotomy, we divided the data into bins by the absolute B-band magnitude. Each bin had a width of 0.5 mag. After that, we calculated the median values of DM surface densities and accelerations for each bin and found a linear regression equation for the relation between the median values of DM parameters and absolute magnitudes. This approach allowed us to give more weight to the less numerous dwarf galaxies. The correlations become much weaker for the median fit: ; () and ; (). However, if we don’t take the dwarf galaxies ( mag) into account, the situation changes and the correlations become more significant: ; () and ; (). This analysis confirms the dichotomy of low- and high-luminosity galaxies in the diagrams; however, to make further conclusions one needs more data on dwarf galaxies. A similar dichotomy was previously found by Napolitano et al. (2010), who compared the projected density of DM in the central regions of galaxies with stellar masses for a large sample of galaxies. According to this comparison, galaxies with low stellar masses have almost universal projected DM density, while for other objects there is a trend of DM surface density with stellar mass.
Since the universality of DM surface density is in good agreement with MOND (see Milgrom 2009), we decided to study how our results correspond to MOND. Milgrom (2009) concluded that MOND predicts a quasi-universal value of , which is very close to the value obtained by D09, shown in Fig. 2 by a thick black line. According to Milgrom (2009), the quasi-universal value is not shared by objects with low surface densities, so the DM surface density could be lower. Thus, we should expect the DM surface density to be around 2.14 or lower. As can be seen from Fig. 2 this prediction is not confirmed by our data for high-luminosity systems.
Milgrom & Sanders (2005) have shown that MOND predicts the existence of the maximum possible halo acceleration, which spans a range of , where is the MOND constant. We have overplotted in Fig. 4 the values of (dashed black line), (thick black line), (dotted black line), and (thin black line). From Fig. 4 it can be seen that our data do not confirm this prediction of MOND. Some of the galaxies have values of which are higher than not only but even .
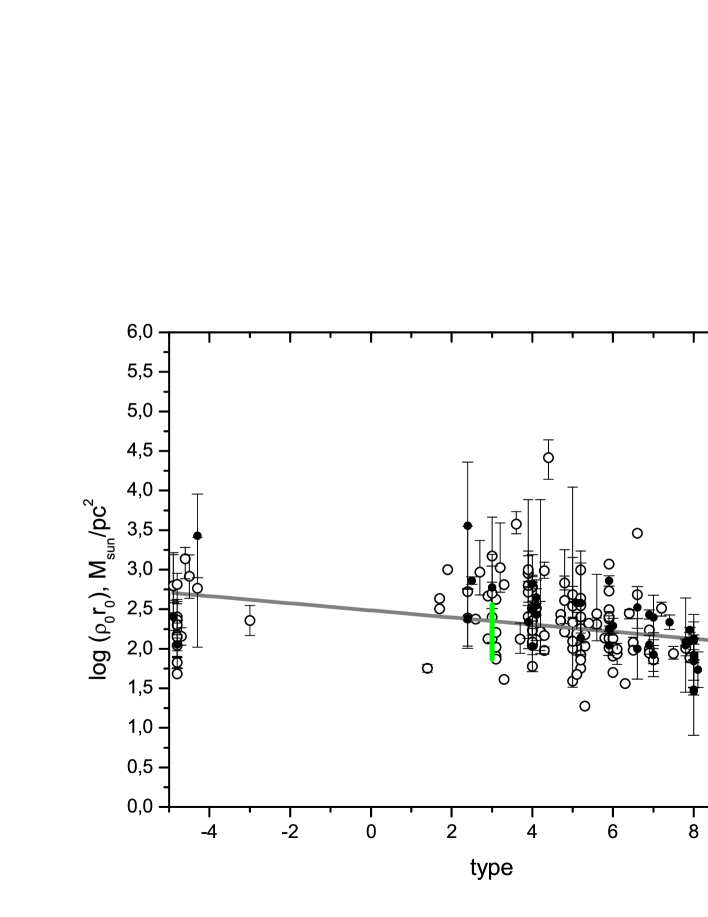
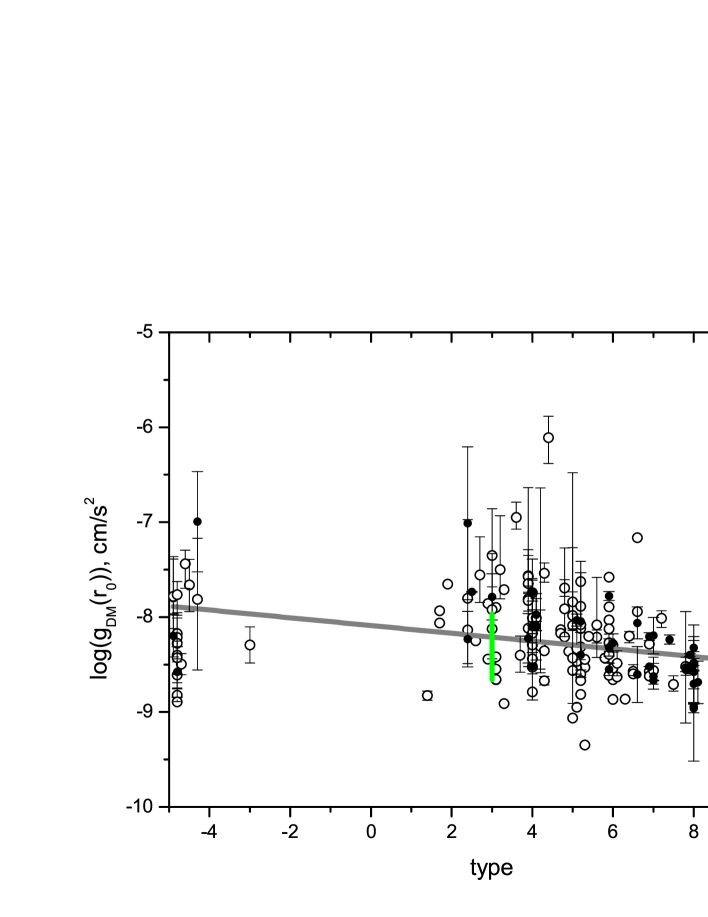
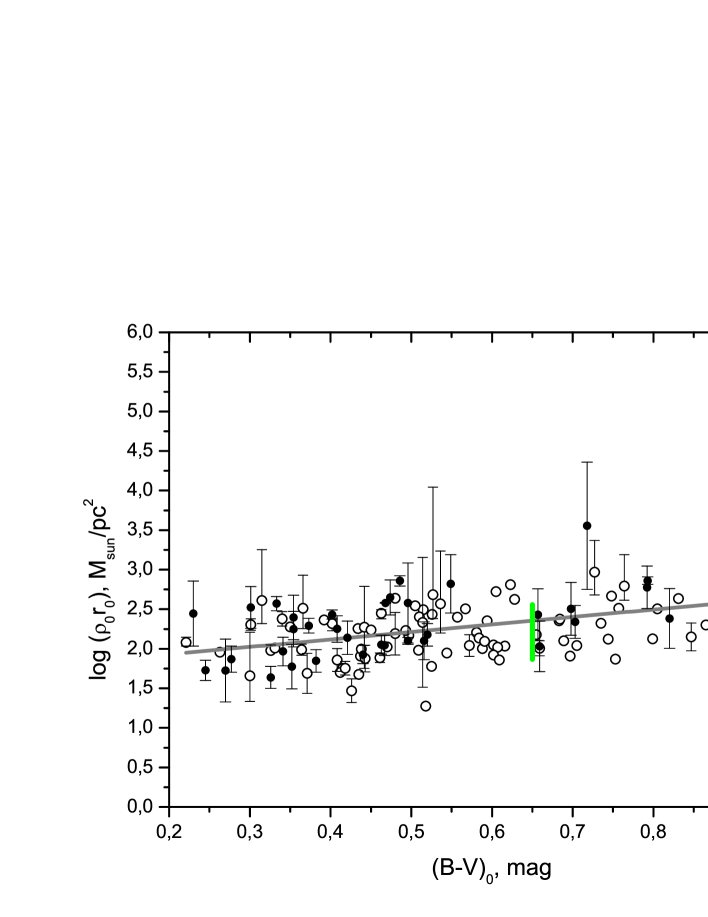
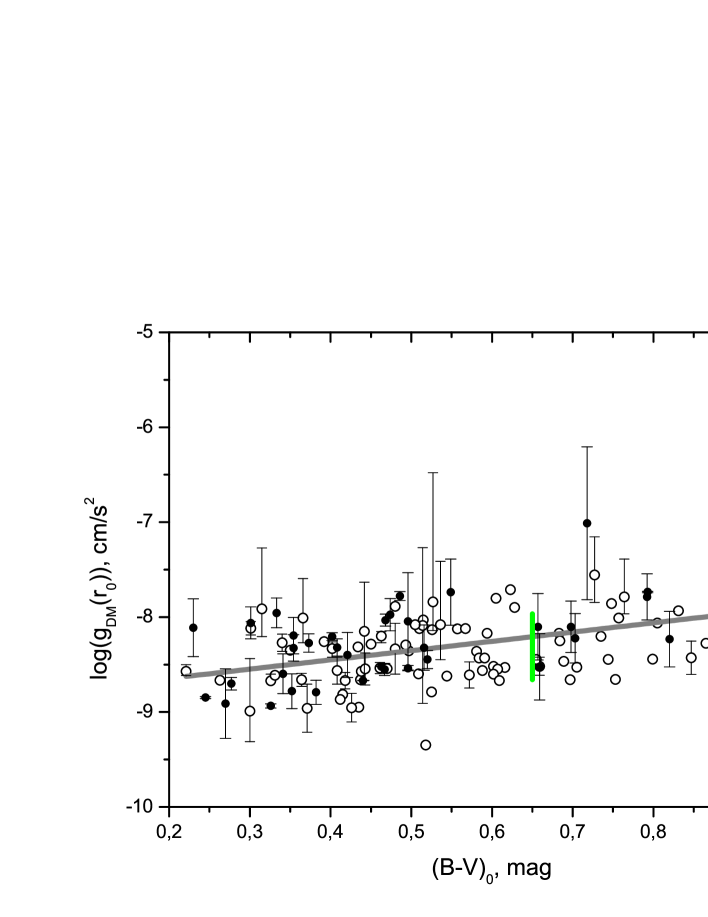
The relation between the parameters of the DM halo and the total B-band luminosities of the galaxies indicates that DM haloes could play a significant role in the processes of formation and evolution of galaxies. In order to make further progress, we decided to compare the surface density of the DM halo and its Newtonian acceleration with the observational properties of galaxies, such as morphological type, colour index and content of neutral hydrogen. All these quantities were found in the Hyperleda catalogue 888http://leda.univ-lyon1.fr/ (Paturel et al. 2003) for most galaxies of the sample. In Figs. 5, 6 we compare the surface density and Newtonian acceleration of DM haloes with the morphological types of galaxies. From these figures, it is evident that the parameters of DM haloes correlate with galaxy type. The correlation coefficients with their standard errors and the linear regression equation can be found in Table 3, both for the entire sample and for only those galaxies with mean DM parameters. From Figs 5 and 6, it follows that galaxies with earlier morphological types, possessing a higher contribution of the bulge to the luminosity, tend to have higher values of DM halo surface densities and accelerations in comparison with late-type galaxies. Weak but statistically significant correlations are also found between DM halo surface density and acceleration and the colour indices corrected for dust extinction (see Figs. 7 and 8). We also found a very slight but significant correlation between the DM halo parameters and the hydrogen content per unit of B-band flux, (Figs. 9, 10). Galaxies with higher contents of hydrogen possess lower values of . The correlation coefficients and the linear regression coefficients for the relations are given in Table 3. As can be seen from Table 3, the correlation coefficients are higher for galaxies with averaged DM parameter estimates.
The correlations found could mean that early-type galaxies with passive star formation and low content of gas have denser DM haloes than late-type ones. If these correlations are real, then one can conclude that the properties of the DM halo could determine the evolution of the visible galaxy. Galaxies with denser DM haloes could form their stars more effectively and lose their gas faster than those with less massive haloes. Also, one cannot exclude the possibility that the interaction between DM and baryons had an influence on the DM density distribution (see, e.g. Wu et al. 2014).
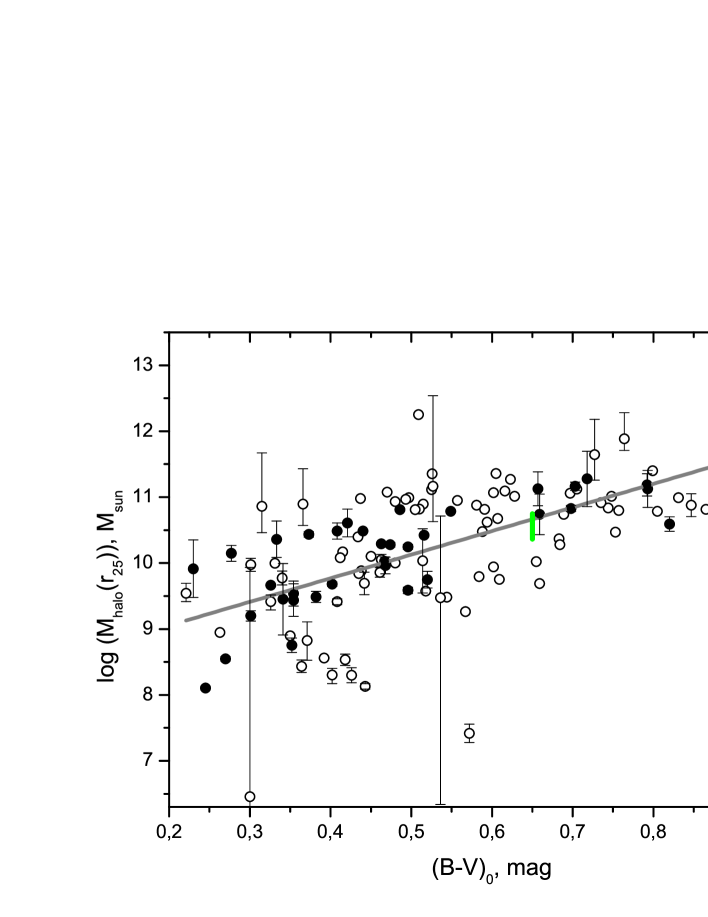
The correlations between DM halo central surface density and acceleration and could be the result of the relation between DM halo mass and the colour of a galaxy. According to cosmological simulations, red galaxies reside in more massive DM haloes in comparison with blue ones (see e.g. Wang & White 2012, Guo et al. 2011). To test whether our results agree with this conclusion, we compared the DM halo masses inside optical radius and the colour indices (see Fig. 11). For high-surface-brightness galaxies, we used the radius of the B-band 25 isophote as the optical radius, while for LSBs we utilized four exponential disc scalelengths instead (the scalelengths were taken from the source articles). From Fig. 11, it follows that the correlation between DM halo mass and colour is stronger than that for DM surface density and acceleration (see Table 3 for the correlation coefficients). This could mean that the relation between the surface density and Newtonian acceleration of the DM halo and the colour index is the manifestation of a stronger link between DM halo mass and the evolutionary state of a galaxy.
Another thing that could follow from the correlations is that red galaxies could undergo more merging events in comparison with blue ones. We tested whether isolated galaxies differ from other galaxies of the sample in their values of . To do this, we selected the galaxies of our sample presented in the Analysis of the interstellar Medium of Isolated GAlaxies (AMIGA) catalogue of isolated systems999http://amiga.iaa.es/p/1-amiga-home.htm. The catalogue provides a list of galaxies that have not interacted with a significant mass neighbour in the past 3 Gyr. The mean value of the DM surface density of isolated galaxies does not differ from that for the entire sample (see above). According to the Kolmogorov-Smirnov test at 0.05 level, these galaxies are not significantly different from the whole sample.
| Equation | ||
|---|---|---|
| (1) | (2) | (3) |
| The entire sample | ||
| 0.32 | 0.13 | |
| 0.33 | 0.13 | |
| Galaxies with the averaged estimates | ||
| 0.28 | 0.26 | |
| 0.30 | 0.26 | |
| The entire sample | ||
| 0.37 | 0.13 | |
| 0.34 | 0.13 | |
| Galaxies with the averaged estimates | ||
| 0.56 | 0.22 | |
| 0.56 | 0.22 | |
| The entire sample | ||
| 0.46 | 0.16 | |
| 0.46 | 0.16 | |
| Galaxies with the averaged estimates | ||
| 0.60 | 0.27 | |
| 0.61 | 0.27 | |
| The entire sample | ||
| 0.38 | 0.14 | |
| 0.36 | 0.14 | |
| Galaxies with the averaged estimates | ||
| 0.68 | 0.22 | |
| 0.67 | 0.21 | |
| The entire sample | ||
| 0.65 | 0.14 | |
| Galaxies with the averaged estimates | ||
| 0.73 | 0.23 |
5 Discussion and Conclusions
The galaxy formation process is a complex topic not completely understood to date. Scaling relations can help us to extend our knowledge on this topic. When certain parameters of galaxies turn out to be universal, they have great importance, since universality implies the existence of some important physical mechanism driving the process studied. In our case, the universality of DM surface density described in D09 and G09 has a strong meaning. It strongly couples DM and baryon evolution in galaxies (see G09): a large central luminous density hints at a large core, which means a small quantity of DM in the central part of the galaxy. This low quantity of DM in the centre of dwarfs has been related by G09 to the “mass discrepancy-acceleration relation” (McGaugh 2004; Milgrom 1983b), and MOND. In more standard scenarios, which are based on the idea that the CDM model is able to explain the universe on small scales when baryon physics is taken appropriately into account, the low DM density in dwarf cores has been explained as a by-product of supernova explosions (Navarro et al. 1996; Gelato & Sommer-Larsen 1999; Read & Gilmore 2005; Mashchenko et al. 2006; Governato et al. 2010) or resulting from the transfer of energy and angular momentum from baryons to DM through dynamical friction (El-Zant et al. 2004; El-Zant et al. 2001; Romano-Díaz et al. 2008; Del Popolo 2009; Cole et al. 2011).
Motivated by the results of D09 and G09, in the present article we revisited the constancy (universality) of the DM halo surface density and its Newtonian acceleration within the core radius for galaxies of different luminosities found by D09. The adopted sample is different from that of D09 and we used DM parameters obtained using some methods different from that used in D09. According to our study, the dispersion of values of surface density is twice as high as that of D09 and G09. Also, we found that both and correlate with luminosity, in good agreement with the previous findings of Cardone & Del Popolo (2012) and Boyarsky et al. (2009). We also found that galaxies with high and low luminosities behave differently in and versus diagrams. Faint objects (with mag) have low variation of DM surface densities and accelerations with absolute B-band magnitude, in contrast to luminous systems, which tend to have a strong relation between these DM properties and luminosity.
We also revealed weak but statistically meaningful correlations between these parameters and the morphological type, colour index and content of neutral hydrogen per B-band flux. Galaxies of early types and with low content of gas tend to have higher values of and . A relation between DM halo surface density and acceleration and colour index seems to be a manifestation of a stronger correlation with DM halo mass. This conclusion is in agreement with the results of cosmological simulations, where red galaxies reside in more massive DM haloes in comparison with blue ones (see e.g. Wang & White 2012, Guo et al. 2011). The correlations are statistically significant for both the entire sample of galaxies and the most reliable averaged DM parameter estimates for galaxies with several evaluations of the DM parameters. This could indicate that intrinsic systematic effects of the methods of evaluation of the DM density distribution may have insignificant influence on our results.
We also found that the difference between galaxies with high and low values of is not due to merging events in the past 3 Gyr, since the DM surface densities of isolated AMIGA galaxies of our sample are not significantly different from those of the entire sample.
Our results contradict the universality of DM density and acceleration found by D09 and G09. The quoted constancy of surface density and Newtonian acceleration in is one of MOND’s prediction. Rephrasing Milgrom (2009), the surface density is constant for objects of any internal structure and mass, if they are in the Newtonian regime (see Milgrom 2009). This MOND prediction is not confirmed by our data. Our result is also at odds with the MOND prediction of maximal halo acceleration (see Milgrom & Sanders 2005).
Thus, our results seem to contradict the conclusions of D09 and G09. At the same time, they do not confirm the MOND predictions related to the inner structure of galaxies.
Acknowledgments We thank the anonymous referee for the important remarks which allowed us to improve the paper. A.S. thanks Kirill Zaslavskiy for helpful comments and the support. A.D.P. would like to thank the International Institute of Physics in Natal for the facilities and hospitality. We thank Charles Downing from Exeter University for a critical reading of the paper. We are grateful to Anatoly Zasov for fruitful discussion. We wish to thank Anastasia Kasparova for providing us the DM parameters for the sample of galaxies from Kasparova 2012. This publication makes use of the AMIGA VO-archive, supported by Grant AYA2008-06181-C02 and AYA2011-30491-C02-01, co-financed by MICINN and FEDER funds, and the Junta de Andaluc a (Spain) grant P08-FQM-4205. We acknowledge the usage of the HyperLeda database (http://leda.univ-lyon1.fr). This work was partly supported by the Russian Foundation for Basic Research (RFBR), grants no. 14-22-03006 and 12-02-00685-a.
References
- Agnello & Evans (2012) Agnello A., Evans N. W., 2012, ApJ, 754, L39
- Amorisco & Evans (2012) Amorisco N. C., Evans N. W., 2012, MNRAS, 419, 184
- Astashenok & del Popolo (2012) Astashenok A. V., del Popolo A., 2012, Classical and Quantum Gravity, 29, 085014
- Athanassoula et al. (1987) Athanassoula E., Bosma A., Papaioannou S., 1987, A&A, 179, 23
- Baldry et al. (2008) Baldry I. K., Glazebrook K., Driver S. P., 2008, MNRAS, 388, 945
- Barnes et al. (2004) Barnes E. I., Sellwood J. A., Kosowsky A., 2004, AJ, 128, 2724
- Battaglia et al. (2008) Battaglia G., Helmi A., Tolstoy E., Irwin M., Hill V., Jablonka P., 2008, ApJ, 681, L13
- Begum & Chengalur (2004) Begum A., Chengalur J. N., 2004, A&A, 424, 509
- Bell & de Jong (2001) Bell E. F., de Jong R. S., 2001, ApJ, 550, 212
- Bottema (1993) Bottema R., 1993, A&A, 275, 16
- Boyarsky et al. (2009) Boyarsky A., Ruchayskiy O., Iakubovskyi D., Maccio’ A. V., Malyshev D., 2009, ArXiv e-prints
- Boylan-Kolchin et al. (2011) Boylan-Kolchin M., Bullock J. S., Kaplinghat M., 2011, MNRAS, 415, L40
- Boylan-Kolchin et al. (2012) Boylan-Kolchin M., Bullock J. S., Kaplinghat M., 2012, MNRAS, 422, 1203
- Breddels & Helmi (2013) Breddels M. A., Helmi A., 2013, A&A, 558, A35
- Breddels et al. (2013) Breddels M. A., Helmi A., van den Bosch R. C. E., van de Ven G., Battaglia G., 2013, MNRAS, 433, 3173
- Buchdahl (1970) Buchdahl H. A., 1970, MNRAS, 150, 1
- Buote & Humphrey (2012) Buote D. A., Humphrey P. J., 2012, 378, 235
- Burkert (1995) Burkert A., 1995, ApJ, 447, L25
- Cappellari et al. (2012) Cappellari M., McDermid R. M., Alatalo K., Blitz L., Bois M., Bournaud F., Bureau M., Crocker A. F., Davies R. L., Davis T. A., de Zeeuw P. T. e. a., 2012, Nature, 484, 485
- Cardone & Del Popolo (2012) Cardone V. F., Del Popolo A., 2012, MNRAS, 427, 3176
- Cardone & Tortora (2010) Cardone V. F., Tortora C., 2010, MNRAS, 409, 1570
- Chemin et al. (2006) Chemin L., Carignan C., Drouin N., Freeman K. C., 2006, AJ, 132, 2527
- Cole et al. (2011) Cole D. R., Dehnen W., Wilkinson M. I., 2011, MNRAS, 416, 1118
- Colín et al. (2000) Colín P., Avila-Reese V., Valenzuela O., 2000, ApJ, 542, 622
- Corbelli (2003) Corbelli E., 2003, MNRAS, 342, 199
- de Blok & Bosma (2002) de Blok W. J. G., Bosma A., 2002, A&A, 385, 816
- de Blok et al. (2003) de Blok W. J. G., Bosma A., McGaugh S., 2003, MNRAS, 340, 657
- de Blok & McGaugh (1997) de Blok W. J. G., McGaugh S. S., 1997, MNRAS, 290, 533
- de Blok et al. (2008) de Blok W. J. G., Walter F., Brinks E., Trachternach C., Oh S.-H., Kennicutt Jr. R. C., 2008, AJ, 136, 2648
- Dekel et al. (2005) Dekel A., Stoehr F., Mamon G. A., Cox T. J., Novak G. S., Primack J. R., 2005, Nature, 437, 707
- Del Popolo (2007) Del Popolo A., 2007, Astronomy Reports, 51, 169
- Del Popolo (2009) Del Popolo A., 2009, ApJ, 698, 2093
- Del Popolo (2010) Del Popolo A., 2010, MNRAS, 408, 1808
- Del Popolo (2012a) Del Popolo A., 2012a, MNRAS, 419, 971
- Del Popolo (2012b) Del Popolo A., 2012b, MNRAS, 424, 38
- Del Popolo (2013) Del Popolo A., 2013, 1548, 2
- Del Popolo (2014) Del Popolo A., 2014, International Journal of Modern Physics D, 23, 30005
- Del Popolo et al. (2013) Del Popolo A., Cardone V. F., Belvedere G., 2013, MNRAS, 429, 1080
- Del Popolo & Hiotelis (2014) Del Popolo A., Hiotelis N., 2014, J. Cosmology Astropart. Phys., 1, 47
- Del Popolo & Kroupa (2009) Del Popolo A., Kroupa P., 2009, A&A, 502, 733
- Del Popolo et al. (2014) Del Popolo A., Lima J. A. S., Fabris J. C., Rodrigues D. C., 2014, J. Cosmology Astropart. Phys., 4, 21
- Del Popolo et al. (2013a) Del Popolo A., Pace F., Lima J. A. S., 2013a, International Journal of Modern Physics D, 22, 50038
- Del Popolo et al. (2013b) Del Popolo A., Pace F., Lima J. A. S., 2013b, MNRAS, 430, 628
- Del Popolo et al. (2013) Del Popolo A., Pace F., Maydanyuk S. P., Lima J. A. S., Jesus J. F., 2013, Phys. Rev. D, 87, 043527
- Donato et al. (2009) Donato F., Gentile G., Salucci P., Frigerio Martins C., Wilkinson M. I., Gilmore G., Grebel E. K., Koch A., Wyse R., 2009, MNRAS, 397, 1169
- El-Zant et al. (2001) El-Zant A., Shlosman I., Hoffman Y., 2001, ApJ, 560, 636
- El-Zant et al. (2004) El-Zant A. A., Hoffman Y., Primack J., Combes F., Shlosman I., 2004, ApJ, 607, L75
- Ellis (2010) Ellis R. S., 2010, Royal Society of London Philosophical Transactions Series A, 368, 967
- Ferraro (2012) Ferraro R., 2012, 1471, 103
- Ferreras et al. (2013) Ferreras I., La Barbera F., de la Rosa I. G., Vazdekis A., de Carvalho R. R., Falcón-Barroso J., Ricciardelli E., 2013, MNRAS, 429, L15
- Flores & Primack (1994) Flores R. A., Primack J. R., 1994, ApJ, 427, L1
- Frigerio Martins (2009) Frigerio Martins C., 2009, PhD thesis, PhD Thesis, 2009
- Fuchs (2003) Fuchs B., 2003, Ap&SS, 284, 719
- Galaz et al. (2006) Galaz G., Villalobos A., Infante L., Donzelli C., 2006, AJ, 131, 2035
- Gelato & Sommer-Larsen (1999) Gelato S., Sommer-Larsen J., 1999, MNRAS, 303, 321
- Gentile et al. (2009) Gentile G., Famaey B., Zhao H., Salucci P., 2009, Nature, 461, 627
- Gentile et al. (2007) Gentile G., Salucci P., Klein U., Granato G. L., 2007, MNRAS, 375, 199
- Gentile et al. (2004) Gentile G., Salucci P., Klein U., Vergani D., Kalberla P., 2004, MNRAS, 351, 903
- Gerhard (2010) Gerhard O., 2010, Highlights of Astronomy, 15, 65
- Goodman (2000) Goodman J., 2000, New A, 5, 103
- Governato et al. (2010) Governato F., Brook C., Mayer L., Brooks A., Rhee G., Wadsley J., Jonsson P., Willman B., Stinson G., Quinn T., Madau P., 2010, Nature, 463, 203
- Graham (2013) Graham A. W., 2013, Elliptical and Disk Galaxy Structure and Modern Scaling Laws. p. 91
- Guo et al. (2011) Guo Q., White S., Boylan-Kolchin M., De Lucia G., Kauffmann G., Lemson G., Li C., Springel V., Weinmann S., 2011, MNRAS, 413, 101
- Heymans et al. (2006) Heymans C., Bell E. F., Rix H.-W., Barden M., Borch A., Caldwell J. A. R., McIntosh D. H., Meisenheimer K., Peng C. Y., Wolf C., Beckwith S. V. W., Häußler B., Jahnke K., Jogee S., Sánchez S. F., Somerville R., Wisotzki L., 2006, MNRAS, 371, L60
- Hoekstra et al. (2005) Hoekstra H., Hsieh B. C., Yee H. K. C., Lin H., Gladders M. D., 2005, ApJ, 635, 73
- Humphrey et al. (2006) Humphrey P. J., Buote D. A., Gastaldello F., Zappacosta L., Bullock J. S., Brighenti F., Mathews W. G., 2006, ApJ, 646, 899
- Jardel & Gebhardt (2012) Jardel J. R., Gebhardt K., 2012, ApJ, 746, 89
- Jardel & Gebhardt (2013) Jardel J. R., Gebhardt K., 2013, ApJ, 775, L30
- Jardel et al. (2013) Jardel J. R., Gebhardt K., Fabricius M. H., Drory N., Williams M. J., 2013, ApJ, 763, 91
- Kasparova (2012) Kasparova A. V., 2012, Astronomy Letters, 38, 63
- Kasparova et al. (2014) Kasparova A. V., Saburova A. S., Katkov I. Y., Chilingarian I. V., Bizyaev D. V., 2014, MNRAS, 437, 3072
- Khoperskov et al. (2003) Khoperskov A. V., Zasov A. V., Tyurina N. V., 2003, Astronomy Reports, 47, 357
- Kleinheinrich et al. (2006) Kleinheinrich M., Schneider P., Rix H.-W., Erben T., Wolf C., Schirmer M., Meisenheimer K., Borch A., Dye S., Kovacs Z., Wisotzki L., 2006, A&A, 455, 441
- Klypin et al. (1999) Klypin A., Kravtsov A. V., Valenzuela O., Prada F., 1999, ApJ, 522, 82
- Komatsu et al. (2011) Komatsu E., Smith K. M., Dunkley J., Bennett C. L., Gold B., Hinshaw G., Jarosik N., Larson D., Nolta M. R., Page L. e. a., 2011, ApJS, 192, 18
- Kormendy & Freeman (2004) Kormendy J., Freeman K. C., 2004, 220, 377
- Kowalski et al. (2008) Kowalski M., Rubin D., Aldering G., Agostinho R. J., Amadon A., Amanullah R., Balland C., Barbary K., Blanc G., Challis P. J., Conley A., Connolly N. V. e. a., 2008, ApJ, 686, 749
- Kroupa (2001) Kroupa E., 2001, MNRAS, 322, 231
- Kuzio de Naray & Kaufmann (2011) Kuzio de Naray R., Kaufmann T., 2011, MNRAS, 414, 3617
- Kuzio de Naray et al. (2008) Kuzio de Naray R., McGaugh S. S., de Blok W. J. G., 2008, ApJ, 676, 920
- La Barbera et al. (2013) La Barbera F., Ferreras I., Vazdekis A., de la Rosa I. G., de Carvalho R. R., Trevisan M., Falcón-Barroso J., Ricciardelli E., 2013, MNRAS, 433, 3017
- Lee et al. (2004) Lee H.-c., Gibson B. K., Flynn C., Kawata D., Beasley M. A., 2004, MNRAS, 353, 113
- Lelli et al. (2010) Lelli F., Fraternali F., Sancisi R., 2010, A&A, 516, A11
- Li & White (2009) Li C., White S. D. M., 2009, MNRAS, 398, 2177
- Macciò et al. (2008) Macciò A. V., Dutton A. A., van den Bosch F. C., 2008, MNRAS, 391, 1940
- Mandelbaum et al. (2006) Mandelbaum R., Seljak U., Kauffmann G., Hirata C. M., Brinkmann J., 2006, MNRAS, 368, 715
- Martin et al. (2010) Martin A. M., Papastergis E., Giovanelli R., Haynes M. P., Springob C. M., Stierwalt S., 2010, ApJ, 723, 1359
- Martín-Navarro et al. (2014) Martín-Navarro I., La Barbera F., Vazdekis A., Falcón-Barroso J., Ferreras I., 2014, ArXiv e-prints
- Mashchenko et al. (2006) Mashchenko S., Couchman H. M. P., Wadsley J., 2006, Nature, 442, 539
- Mashchenko et al. (2008) Mashchenko S., Wadsley J., Couchman H. M. P., 2008, Science, 319, 174
- Mayer et al. (2008) Mayer L., Governato F., Kaufmann T., 2008, Advanced Science Letters, 1, 7
- McGaugh (2004) McGaugh S. S., 2004, ApJ, 609, 652
- Merritt et al. (2006) Merritt D., Graham A. W., Moore B., Diemand J., Terzić B., 2006, AJ, 132, 2685
- Milgrom (1983a) Milgrom M., 1983a, ApJ, 270, 371
- Milgrom (1983b) Milgrom M., 1983b, ApJ, 270, 365
- Milgrom (2009) Milgrom M., 2009, MNRAS, 398, 1023
- Milgrom & Sanders (2005) Milgrom M., Sanders R. H., 2005, MNRAS, 357, 45
- Montero-Dorta & Prada (2009) Montero-Dorta A. D., Prada F., 2009, MNRAS, 399, 1106
- Moore (1994) Moore B., 1994, Nature, 370, 629
- Moore et al. (1999) Moore B., Quinn T., Governato F., Stadel J., Lake G., 1999, MNRAS, 310, 1147
- Nagino & Matsushita (2009) Nagino R., Matsushita K., 2009, A&A, 501, 157
- Napolitano et al. (2011) Napolitano N. R., Romanowsky A. J., Capaccioli M., Douglas N. G., Arnaboldi M., Coccato L., Gerhard O., Kuijken K., Merrifield M. R., Bamford S. P., Cortesi A., Das P., Freeman K. C., 2011, MNRAS, 411, 2035
- Napolitano et al. (2009) Napolitano N. R., Romanowsky A. J., Coccato L., Capaccioli M., Douglas N. G., Noordermeer E., Gerhard O., Arnaboldi M., de Lorenzi F., Kuijken K., Merrifield M. R., O’Sullivan E., Cortesi A., Das P., Freeman K. C., 2009, MNRAS, 393, 329
- Napolitano et al. (2010) Napolitano N. R., Romanowsky A. J., Tortora C., 2010, MNRAS, 405, 2351
- Navarro et al. (1996) Navarro J. F., Eke V. R., Frenk C. S., 1996, MNRAS, 283, L72
- Navarro et al. (1996) Navarro J. F., Frenk C. S., White S. D. M., 1996, ApJ, 462, 563
- Navarro et al. (1997) Navarro J. F., Frenk C. S., White S. D. M., 1997, ApJ, 490, 493
- Navarro et al. (2010) Navarro J. F., Ludlow A., Springel V., Wang J., Vogelsberger M., White S. D. M., Jenkins A., Frenk C. S., Helmi A., 2010, MNRAS, 402, 21
- Oh et al. (2011) Oh S.-H., Brook C., Governato F., Brinks E., Mayer L., de Blok W. J. G., Brooks A., Walter F., 2011, AJ, 142, 24
- Oh et al. (2011) Oh S.-H., de Blok W. J. G., Brinks E., Walter F., Kennicutt Jr. R. C., 2011, AJ, 141, 193
- Paturel et al. (2003) Paturel G., Petit C., Prugniel P., Theureau G., Rousseau J., Brouty M., Dubois P., Cambrésy L., 2003, A&A, 412, 45
- Peebles (2000) Peebles P. J. E., 2000, ApJ, 534, L127
- Peebles (2001) Peebles P. J. E., 2001, ApJ, 557, 495
- Percival et al. (2010) Percival W. J., Reid B. A., Eisenstein D. J., Bahcall N. A., Budavari T., Frieman J. A., Fukugita M., Gunn J. E., Ivezić Ž. e. a., 2010, MNRAS, 401, 2148
- Prada et al. (2003) Prada F., Vitvitska M., Klypin A., Holtzman J. A., Schlegel D. J., Grebel E. K., Rix H.-W., Brinkmann J., McKay T. A., Csabai I., 2003, ApJ, 598, 260
- Read & Gilmore (2005) Read J. I., Gilmore G., 2005, MNRAS, 356, 107
- Romano-Díaz et al. (2009) Romano-Díaz E., Shlosman I., Heller C., Hoffman Y., 2009, ApJ, 702, 1250
- Romano-Díaz et al. (2008) Romano-Díaz E., Shlosman I., Hoffman Y., Heller C., 2008, ApJ, 685, L105
- Romanowsky et al. (2003) Romanowsky A. J., Douglas N. G., Arnaboldi M., Kuijken K., Merrifield M. R., Napolitano N. R., Capaccioli M., Freeman K. C., 2003, Science, 301, 1696
- Saburova (2011) Saburova A. S., 2011, Astronomy Reports, 55, 409
- Saburova & Zasov (2012) Saburova A. S., Zasov A. V., 2012, Astronomy Letters, 38, 139
- Salpeter (1955) Salpeter E., 1955, ApJ, 121, 161
- Shchelkanova et al. (2013) Shchelkanova G. A., Blinnikov S. I., Saburova A. S., Dolgov A. D., 2013, Astronomy Letters, 39, 665
- Simon et al. (2005) Simon J. D., Bolatto A. D., Leroy A., Blitz L., Gates E. L., 2005, ApJ, 621, 757
- Sommer-Larsen & Dolgov (2001) Sommer-Larsen J., Dolgov A., 2001, ApJ, 551, 608
- Spano et al. (2008) Spano M., Marcelin M., Amram P., Carignan C., Epinat B., Hernandez O., 2008, MNRAS, 383, 297
- Spergel et al. (2003) Spergel D. N., Verde L., Peiris H. V., Komatsu E., Nolta M. R., Bennett C. L., Halpern M., Hinshaw G., Jarosik N., Kogut A., Limon M., Meyer S. S., Page L., Tucker G. S., Weiland J. L., Wollack E., Wright E. L., 2003, ApJS, 148, 175
- Starobinsky (1980) Starobinsky A. A., 1980, Physics Letters B, 91, 99
- Strigari et al. (2010) Strigari L. E., Frenk C. S., White S. D. M., 2010, MNRAS, 408, 2364
- Swaters et al. (2003) Swaters R. A., Madore B. F., van den Bosch F. C., Balcells M., 2003, ApJ, 583, 732
- Swaters et al. (2011) Swaters R. A., Sancisi R., van Albada T. S., van der Hulst J. M., 2011, ApJ, 729, 118
- Tikhonov & Klypin (2009) Tikhonov A. V., Klypin A., 2009, MNRAS, 395, 1915
- Tinker & Conroy (2009) Tinker J. L., Conroy C., 2009, ApJ, 691, 633
- Tortora et al. (2013) Tortora C., Romanowsky A. J., Napolitano N. R., 2013, ApJ, 765, 8
- Treu (2010) Treu T., 2010, ARA&A, 48, 87
- van den Bosch et al. (2001) van den Bosch F. C., Burkert A., Swaters R. A., 2001, MNRAS, 326, 1205
- van den Bosch & Swaters (2001) van den Bosch F. C., Swaters R. A., 2001, MNRAS, 325, 1017
- van Eymeren et al. (2009) van Eymeren J., Trachternach C., Koribalski B. S., Dettmar R.-J., 2009, A&A, 505, 1
- Walker & Peñarrubia (2011) Walker M. G., Peñarrubia J., 2011, ApJ, 742, 20
- Wang & White (2012) Wang W., White S. D. M., 2012, MNRAS, 424, 2574
- Weijmans et al. (2009) Weijmans A.-M., Cappellari M., Bacon R., de Zeeuw P. T., Emsellem E., Falcón-Barroso J., Kuntschner H., McDermid R. M., van den Bosch R. C. E., van de Ven G., 2009, MNRAS, 398, 561
- Weijmans et al. (2008) Weijmans A.-M., Krajnović D., van de Ven G., Oosterloo T. A., Morganti R., de Zeeuw P. T., 2008, MNRAS, 383, 1343
- Weinberg (1989) Weinberg S., 1989, Reviews of Modern Physics, 61, 1
- Weldrake et al. (2003) Weldrake D. T. F., de Blok W. J. G., Walter F., 2003, MNRAS, 340, 12
- Wu (2007) Wu X., 2007, ArXiv Astrophysics e-prints
- Wu et al. (2014) Wu X., Gerhard O., Naab T., Oser L., Martinez-Valpuesta I., Hilz M., Churazov E., Lyskova N., 2014, MNRAS, 438, 2701
- Zasov et al. (2011) Zasov A. V., Khoperskov A. V., Saburova A. S., 2011, Astronomy Letters, 37, 374
- Zentner & Bullock (2003) Zentner A. R., Bullock J. S., 2003, ApJ, 598, 49
- Zolotov et al. (2012) Zolotov A., Brooks A. M., Willman B., Governato F., Pontzen A., Christensen C., Dekel A., Quinn T., Shen S., Wadsley J., 2012, ApJ, 761, 71
Appendix A The sample
| Galaxy | Type | ref. | method | |||||
|---|---|---|---|---|---|---|---|---|
| Mpc | mag. | |||||||
| (1) | (2) | (3) | (4) | (5) | (6) | (7) | (8) | (9) |
| ESO059-001 | 4.57 | IB | -15.33 | 1.95 | -8.47 | 8.34 | 23 | I |
| ESO186-055 | 60.10 | Sab | -19.93 | 3.00 | -7.65 | 10.16 | 17 | I, V |
| ESO206-014 | 60.50 | SABc | -19.72 | 1.59 | -9.06 | 8.43 | 17 | I, V |
| ESO206-020A | 0.10 | E | -8.97 | 1.83 | -8.82 | 7.29 | 12 | VIII |
| ESO215-009 | 5.25 | I | -14.02 | 1.76 | -8.66 | 7.32 | 23 | I |
| ESO215-039 | 61.29 | SABc | -21.36 | 2.61 | -7.91 | 10.86 | 2 | I |
| ESO234-013 | 60.90 | Sbc | -20.12 | 3.00 | -7.65 | 9.90 | 17 | I, V |
| ESO263-014 | 69.83 | SBb | -21.57 | 2.40 | -8.12 | 10.78 | 2 | I |
| ESO267-029 | 76.23 | SBab | -20.88 | 2.39 | -8.14 | 11.12 | 2 | I |
| ESO268-037 | 68.50 | Sc | – | 2.59 | -7.94 | 10.95 | 2 | I |
| ESO268-044 | 49.95 | Sb | -19.96 | 3.02 | -7.50 | 10.62 | 2 | I |
| ESO317-041 | 81.17 | SBbc | -21.09 | 4.41 | -6.11 | 10.09 | 2 | I |
| ESO322-042 | 55.99 | Sc | -20.66 | 2.13 | -8.39 | 10.80 | 2 | I |
| ESO323-025 | 59.76 | Sc | – | 3.13 | -7.39 | 11.20 | 2 | I |
| ESO323-027 | 54.90 | Sc | -20.99 | 2.69 | -7.84 | 11.16 | 2 | I |
| ESO323-039 | 69.90 | Sbc | -19.81 | 2.12 | -8.40 | 10.50 | 2 | I |
| ESO323-042 | 59.73 | Sbc | -21.08 | 2.22 | -8.31 | 10.75 | 2 | I |
| ESO356-004 | 0.14 | E | -11.76 | 1.68 | -8.89 | 7.33 | 27 | IX |
| ESO374-003 | 43.22 | SABc | -20.22 | 2.31 | -8.21 | 10.53 | 2 | I |
| ESO381-005 | 79.56 | SBbc | -20.36 | 2.99 | -7.54 | 11.22 | 2 | I |
| ESO400-037 | 37.50 | SBc | -19.16 | 3.07 | -7.58 | 8.94 | 17 | I, V |
| ESO437-004 | 48.10 | Sbc | -20.32 | 2.78 | -7.74 | 11.03 | 2 | I |
| ESO437-031 | 56.17 | Scd | -19.72 | 2.51 | -8.01 | 10.68 | 2 | I |
| ESO438-015 | 49.96 | SBbc | -20.75 | 2.22 | -8.30 | 10.99 | 2 | I |
| ESO439-018 | 122.20 | Sbc | -21.80 | 2.95 | -7.57 | 11.53 | 2 | I |
| ESO439-020 | 59.84 | SABb | -20.54 | 2.96 | -7.56 | 11.12 | 2 | I |
| ESO444-047 | 62.40 | SBc | -20.28 | 2.44 | -8.08 | 10.84 | 2 | I |
| ESO445-015 | 60.34 | Sbc | -20.45 | 2.41 | -8.12 | 10.78 | 2 | I |
| ESO446-001 | 98.34 | Sbc | -21.42 | 2.09 | -8.44 | 10.94 | 2 | I |
| ESO501-001 | 55.57 | SABc | – | 2.31 | -8.22 | 10.63 | 2 | I |
| IC0342 | 4.50 | SABc | -22.14 | 1.98 | -8.54 | 10.33 | 1 | VI |
| IC0509 | 74.00 | Sc | -20.79 | 1.28 | -9.35 | 9.58 | 18 | I |
| IC2233 | 10.50 | SBc | -19.37 | 2.08 | -8.57 | 9.54 | 7 | I |
| IC2574 | 4.00 | SABm | -18.01 | 1.64 | -8.94 | 9.66 | 21;7 | I, III |
| IC4298 | 92.86 | Sc | -21.48 | 2.83 | -7.69 | 11.48 | 2 | I |
| IC4319 | 66.05 | Sbc | -20.77 | 2.72 | -7.81 | 11.22 | 2 | I |
| IC5152 | 2.07 | IAB | -16.57 | 1.75 | -8.67 | 8.53 | 23 | I |
| NGC0024 | 6.80 | Sc | -17.86 | 2.19 | -8.33 | 10.00 | 4 | I |
| NGC0045 | 5.90 | SABd | -17.81 | 2.01 | -8.52 | 9.69 | 4 | I |
| NGC0224 | 0.69 | Sb | -20.93 | 2.12 | -8.45 | 10.84 | 1 | VI |
| NGC0247 | 2.50 | SABc | -18.38 | 2.00 | -8.57 | 9.88 | 1 | VI |
| NGC0253 | 4.20 | SABc | -21.50 | 2.10 | -8.47 | 10.74 | 1 | VI |
| NGC0300 | 1.65 | Scd | -17.69 | 1.95 | -8.62 | 9.48 | 1 | VI |
| NGC0488 | 48.80 | Sb | -22.67 | 2.13 | -8.44 | 11.40 | 1 | VI |
| NGC0598 | 0.82 | Sc | -18.81 | 2.04 | -8.55 | 10.03 | 5;16;1 | I, V, VI |
| NGC0628 | 7.30 | Sc | -19.96 | 2.64 | -7.89 | 10.93 | 10 | I |
| NGC0720 | 25.70 | E | -21.00 | 2.80 | -7.78 | 11.86 | 9 | VII |
| NGC0821 | 23.40 | E | -20.60 | 2.30 | -8.28 | 10.81 | 25 | VIII |
| NGC0891 | 15.60 | Sb | -21.27 | 1.91 | -8.66 | 11.06 | 1 | VI |
| NGC0925 | 9.20 | Scd | -20.04 | 1.93 | -8.67 | 10.49 | 21;7 | I, III |
| NGC0959 | 7.80 | Sd | -17.22 | 1.89 | -8.54 | 9.86 | 11 | III |
| NGC1087 | 30.50 | SABc | -21.44 | 2.25 | -8.31 | 10.40 | 1 | VI |
| NGC1156 | 7.80 | IB | -18.55 | 2.28 | -8.35 | 8.90 | 18 | I |
| NGC1169 | 34.40 | Sb | -21.61 | 2.37 | -8.25 | 10.28 | 18 | I |
| NGC1407 | 26.80 | E | -21.76 | 2.92 | -7.66 | 12.23 | 9 | VII |
| NGC1560 | 3.00 | Scd | -17.31 | 1.86 | -8.56 | 9.41 | 6 | I |
| NGC2336 | 48.30 | Sbc | -22.79 | 1.78 | -8.79 | 11.11 | 1 | VI |
| NGC2366 | 3.41 | IB | -17.14 | 1.77 | -8.78 | 8.75 | 6;21;7;23 | I, III |
| NGC2403 | 3.22 | SABc | -19.41 | 2.29 | -8.27 | 10.43 | 21;7;1 | I, III, VI |
| NGC2532 | 39.10 | SABc | -20.31 | 2.58 | -8.04 | 10.25 | 7;18 | I |
| NGC2537 | 6.90 | SBm | -17.21 | 2.50 | -8.12 | 9.26 | 18 | I |
| NGC2552 | 10.10 | SABm | -18.02 | 2.57 | -7.96 | 10.36 | 6;11;18;22;7 | I, III |
| NGC2649 | 58.00 | SABb | -20.57 | 2.80 | -7.82 | 10.59 | 18 | I |
| NGC2841 | 14.15 | Sb | -21.22 | 2.78 | -7.79 | 11.19 | 21;10;7;1 | I, III, VI |
| NGC2974 | 20.89 | E | -19.99 | 3.43 | -7.00 | 10.82 | 24 | II, III |
| NGC2976 | 3.60 | Sc | -17.77 | 2.57 | -8.08 | 9.47 | 7 | I |
| NGC2977 | 44.10 | Sb | -20.52 | 2.70 | -7.92 | 10.51 | 18 | I |
| NGC3026 | 21.20 | IB | -18.95 | 2.58 | -8.04 | 10.37 | 18 | I |
| NGC3031 | 3.60 | Sab | -20.71 | 2.38 | -8.23 | 10.59 | 21;7 | I, III |
| NGC3095 | 40.32 | Sc | -21.47 | 2.54 | -7.98 | 11.12 | 2 | I |
| NGC3104 | 10.00 | IAB | -16.72 | 1.98 | -8.67 | 9.41 | 7 | I |
| NGC3109 | 1.70 | SBm | -17.46 | 1.61 | -8.96 | 8.99 | 1 | VI |
| NGC3184 | 11.10 | SABc | -19.91 | 2.40 | -8.12 | 10.95 | 10 | I |
| NGC3198 | 13.88 | Sc | -20.77 | 2.14 | -8.40 | 10.61 | 21;7;10;1 | I, III, VI |
| NGC3274 | 6.60 | Scd | -16.54 | 2.52 | -8.06 | 9.20 | 6;7;18;20 | I,II |
| NGC3319 | 14.10 | SBc | -19.60 | 2.01 | -8.61 | 10.00 | 18 | I |
| NGC3346 | 15.20 | SBc | -18.59 | 2.73 | -7.89 | 10.18 | 18 | I |
| NGC3359 | 22.80 | Sc | -21.04 | 1.75 | -8.81 | 10.17 | 1 | VI |
| NGC3379 | 10.30 | E | -19.95 | 2.37 | -8.21 | 10.81 | 25 | VIII |
| NGC3453 | 57.77 | SBbc | -20.62 | 3.57 | -6.95 | 11.15 | 2 | I |
| NGC3463 | 56.91 | Sb | -20.78 | 3.17 | -7.35 | 11.06 | 2 | I |
| NGC3521 | 10.70 | SABb | -20.93 | 2.51 | -8.10 | 10.83 | 21;10;7 | I, III |
| NGC3621 | 6.60 | SBcd | -20.04 | 2.05 | -8.52 | 10.29 | 21;7 | I, III |
| NGC3627 | 9.30 | SABb | -20.76 | 2.63 | -7.90 | 11.01 | 10 | I |
| NGC3726 | 14.30 | Sc | -20.47 | 1.68 | -8.95 | 9.84 | 18 | I |
| NGC3893 | 15.50 | SABc | -20.69 | 3.00 | -7.63 | 10.68 | 18 | I |
| NGC3898 | 23.10 | Sab | -20.91 | 2.63 | -7.93 | 10.99 | 1 | VI |
| NGC3992 | 22.60 | Sbc | -21.69 | 2.04 | -8.53 | 11.12 | 1 | VI |
| NGC4062 | 11.40 | SABc | -19.19 | 2.18 | -8.44 | 10.02 | 18 | I |
| NGC4125 | 22.20 | E | -21.20 | 2.40 | -8.17 | 11.66 | 9 | VII |
| NGC4242 | 8.10 | Sd | -18.29 | 2.10 | -8.54 | 9.59 | 18;7 | I |
| NGC4244 | 5.00 | Sc | -18.74 | 1.70 | -8.87 | 10.08 | 1 | VI |
| NGC4254 | 16.10 | Sc | -20.85 | 2.40 | -8.12 | 10.82 | 10 | I |
| NGC4258 | 10.40 | SABb | -21.62 | 2.05 | -8.52 | 11.07 | 1 | VI |
| NGC4261 | 29.30 | E | -21.09 | 2.18 | -8.40 | 11.54 | 9 | VII |
| NGC4288 | 8.40 | SBcd | -16.57 | 2.40 | -8.19 | 9.44 | 19;22;7 | I,II |
| NGC4298 | 16.10 | Sc | -19.57 | 1.86 | -8.67 | 9.75 | 10 | I |
| NGC4302 | 16.10 | Sc | -19.88 | 2.32 | -8.20 | 10.92 | 10 | I |
| NGC4303 | 16.10 | Sbc | -21.03 | 2.23 | -8.29 | 10.97 | 10 | I |
| NGC4321 | 18.05 | SABb | -21.44 | 2.43 | -8.10 | 11.13 | 10;1 | I |
| NGC4374 | 16.35 | E | -21.18 | 2.77 | -7.81 | 12.01 | 15 | VIII |
| NGC4395 | 4.28 | Sm | -18.27 | 1.97 | -8.60 | 9.45 | 6;1;22;7;18 | I, VI |
| NGC4402 | 16.10 | Sb | -18.99 | 1.61 | -8.91 | 9.85 | 10 | I |
| NGC4455 | 6.80 | SBcd | -16.82 | 1.93 | -8.62 | 8.74 | 19;6;7 | I,II |
| NGC4472 | 15.10 | E | -21.73 | 2.81 | -7.76 | 12.24 | 9 | VII |
| NGC4494 | 15.80 | E | -20.42 | 2.15 | -8.43 | 10.88 | 14 | VIII |
| NGC4501 | 16.10 | Sb | -21.47 | 2.81 | -7.71 | 11.27 | 10 | I |
| NGC4519 | 16.10 | Scd | -18.98 | 2.24 | -8.29 | 10.10 | 10 | I |
| NGC4535 | 16.10 | Sc | -20.66 | 2.09 | -8.43 | 10.81 | 10 | I |
| NGC4536 | 16.10 | SABb | -20.72 | 2.17 | -8.36 | 10.99 | 10 | I |
| NGC4548 | 16.10 | Sb | -20.40 | 1.87 | -8.66 | 10.47 | 10 | I |
| NGC4567 | 16.10 | Sbc | -19.25 | 2.35 | -8.17 | 10.37 | 10 | I |
| NGC4568 | 16.10 | Sbc | -20.07 | 2.51 | -8.01 | 10.80 | 10 | I |
| NGC4569 | 16.10 | SABa | -21.61 | 2.72 | -7.80 | 11.36 | 10 | I |
| NGC4575 | 43.51 | SBbc | -20.95 | 2.51 | -8.01 | 10.90 | 2 | I |
| NGC4579 | 16.10 | SABb | -20.91 | 2.67 | -7.86 | 11.01 | 10 | I |
| NGC4605 | 5.03 | SBc | -18.45 | 2.58 | -8.03 | 9.96 | 7;1 | I,VI |
| NGC4635 | 12.80 | SABc | -17.48 | 2.68 | -7.94 | 9.90 | 18 | I |
| NGC4647 | 16.10 | SABc | -19.19 | 1.92 | -8.60 | 9.94 | 10 | I |
| NGC4649 | 15.60 | E | -21.27 | 3.14 | -7.44 | 12.22 | 9 | VII |
| NGC4651 | 20.60 | Sc | -20.61 | 2.54 | -8.08 | 10.81 | 18 | I |
| NGC4654 | 16.10 | Sc | -20.61 | 2.49 | -8.03 | 10.89 | 10 | I |
| NGC4689 | 16.10 | Sc | -19.77 | 2.35 | -8.17 | 10.62 | 10 | I |
| NGC4696A | 38.19 | SBb | – | 2.89 | -7.64 | 11.13 | 2 | I |
| NGC4698 | 20.00 | Sab | -20.49 | 2.51 | -8.06 | 10.78 | 1 | VI |
| NGC4736 | 5.15 | Sab | -20.02 | 3.56 | -7.01 | 11.28 | 21;10;7;1 | I, III, VI |
| NGC4789A | 4.30 | I | -14.44 | 1.73 | -8.85 | 8.10 | 21;7 | I, III |
| NGC5023 | 4.80 | Sc | -17.18 | 2.38 | -8.27 | 9.78 | 7 | I |
| NGC5033 | 17.90 | Sc | -21.18 | 2.02 | -8.54 | 11.08 | 1 | VI |
| NGC5055 | 10.33 | Sbc | -21.18 | 2.03 | -8.52 | 10.74 | 21;7;10;1 | I, III, VI |
| NGC5194 | 9.60 | Sbc | -21.57 | 2.82 | -7.74 | 10.79 | 10;1 | I |
| NGC5204 | 4.86 | Sm | -17.14 | 2.25 | -8.32 | 9.54 | 19;18;20;22;7 | I,II |
| NGC5236 | 6.90 | Sc | -21.69 | 2.00 | -8.56 | 10.48 | 1 | VI |
| NGC5298 | 61.59 | SBb | -20.74 | 2.97 | -7.56 | 11.64 | 2 | I |
| NGC5383 | 46.40 | Sb | -21.33 | 2.02 | -8.55 | 10.68 | 1 | VI |
| NGC5408 | 4.81 | IB | -17.01 | 1.47 | -8.95 | 8.30 | 23 | I |
| NGC5457 | 7.60 | SABc | -21.11 | 1.91 | -8.66 | 10.98 | 1 | VI |
| NGC5585 | 5.70 | SABc | -17.84 | 2.43 | -8.21 | 9.68 | 18;7 | I |
| NGC5608 | 10.20 | IB | -16.77 | 1.96 | -8.67 | 8.95 | 18 | I |
| NGC5622 | 54.90 | Sb | -20.03 | 2.21 | -8.42 | 9.86 | 18 | I |
| NGC5727 | 26.40 | SABd | -18.17 | 2.24 | -8.40 | 9.03 | 18;7 | I |
| NGC5907 | 15.60 | SABc | -21.27 | 2.03 | -8.53 | 11.09 | 1 | VI |
| NGC5949 | 10.70 | Sbc | -17.95 | 2.55 | -8.09 | 9.59 | 7;18 | I |
| NGC5963 | 15.00 | Sbc | -18.07 | 2.65 | -7.98 | 10.28 | 7;1 | I,VI |
| NGC6015 | 14.70 | Sc | -19.91 | 2.86 | -7.78 | 10.81 | 18;7 | I |
| NGC6482 | 58.80 | E | -22.11 | 2.79 | -7.79 | 11.89 | 9 | VII |
| NGC6503 | 6.10 | Sc | -19.03 | 2.14 | -8.43 | 9.79 | 1 | VI |
| NGC6689 | 11.00 | SABc | -18.42 | 2.45 | -8.20 | 10.05 | 7 | I |
| NGC6822 | 0.49 | IB | -15.16 | 1.82 | -8.61 | 8.26 | 26 | III |
| NGC6946 | 6.10 | SABc | -20.70 | 2.25 | -8.32 | 10.49 | 21;10;7;1 | I, III, VI |
| NGC7137 | 22.50 | SABc | -19.39 | 2.33 | -8.09 | 10.03 | 11 | III |
| NGC7217 | 19.75 | Sab | -20.94 | 2.86 | -7.74 | 11.13 | 1;18 | VI,I |
| NGC7331 | 17.23 | Sbc | -22.00 | 2.34 | -8.22 | 11.16 | 7;10;1 | I,VI |
| NGC7541 | 57.50 | SBc | -22.41 | 2.43 | -8.13 | 11.35 | 1 | VI |
| NGC7589 | 123.00 | SABa | -20.75 | 1.75 | -8.83 | 11.60 | 8 | III |
| NGC7664 | 74.20 | Sc | -21.60 | 2.21 | -8.36 | 10.88 | 1 | VI |
| NGC7793 | 4.00 | Scd | -18.83 | 2.34 | -8.24 | 10.00 | 21;7;1 | I, III, VI |
| PGC042102 | 322.00 | -19.68 | 2.39 | -8.19 | 12.20 | 8 | III | |
| PGC044532 | 7.50 | Sm | -17.34 | 1.34 | -9.09 | 8.96 | 23 | I |
| PGC086613 | 45.00 | Sd | -16.04 | 2.10 | -8.32 | 10.42 | 6;13 | I, X |
| PGC086619 | 85.00 | Sc | -17.82 | 2.13 | -8.29 | 10.83 | 13 | X |
| PGC086620 | 77.00 | Sd | -18.50 | 1.92 | -8.50 | 10.66 | 13;20 | X, II |
| PGC086622 | 201.00 | Scd | -21.55 | 1.98 | -8.60 | 12.25 | 28 | IV |
| PGC086633 | 48.00 | Sc | -17.94 | 2.21 | -8.21 | 11.21 | 13 | X |
| PGC086638 | 96.00 | Sd | – | 1.48 | -8.94 | 10.35 | 20;13 | II, X |
| PGC086657 | 32.00 | Sm | -16.44 | 1.98 | -8.44 | 10.20 | 13;11 | III, X |
| PGC086660 | 49.00 | Sc | – | 1.56 | -8.86 | 10.03 | 13 | X |
| PGC086666 | 61.00 | I | -17.25 | 2.04 | -8.38 | 10.22 | 13 | X |
| PGC086670 | 48.00 | I | – | 1.34 | -9.09 | 9.72 | 13 | X |
| PGC086672 | 80.00 | Sd | -16.37 | 1.85 | -8.58 | 10.44 | 20;13 | II, X |
| PGC086674 | 79.00 | Sm | – | 1.60 | -8.82 | 10.09 | 13 | X |
| PGC088608 | 0.09 | E-S0 | -7.86 | 2.36 | -8.29 | 7.65 | 12 | VIII |
| PGC166192 | 5.60 | I | -14.03 | 1.88 | -8.55 | 8.13 | 3 | III |
| UGC00128 | 60.00 | Sd | – | 1.74 | -8.69 | 10.80 | 13;11 | III, X |
| UGC00191 | 17.60 | Sm | -17.87 | 2.31 | -8.12 | 9.97 | 11 | III |
| UGC00731 | 8.00 | I | -15.18 | 2.21 | -8.40 | 9.35 | 6;22;7 | I |
| UGC01230 | 51.00 | Sm | – | 2.08 | -8.50 | 10.47 | 13;6;7 | X,I |
| UGC01281 | 5.50 | Sd | -17.23 | 1.94 | -8.71 | 9.38 | 7 | I |
| UGC01551 | 20.20 | SBc | -18.49 | 1.94 | -8.49 | 10.01 | 11 | III |
| UGC02034 | 10.10 | IAB | -16.73 | 2.36 | -8.26 | 8.56 | 18 | I |
| UGC03137 | 18.40 | Sbc | -17.72 | 1.98 | -8.67 | 10.20 | 7 | I |
| UGC03371 | 12.80 | I | -17.03 | 1.87 | -8.70 | 10.15 | 6;22;7 | I |
| UGC03876 | 14.50 | Scd | -17.43 | 3.46 | -7.16 | 9.79 | 18 | I |
| UGC03974 | 4.00 | IB | -14.46 | 2.27 | -8.15 | 9.69 | 6 | I |
| UGC04173 | 16.80 | I | -15.47 | 1.25 | -9.31 | 9.91 | 6;7 | I |
| UGC04305 | 3.40 | I | -16.92 | 1.69 | -8.96 | 8.82 | 7 | I |
| UGC04459 | 3.60 | I | -13.48 | 1.66 | -8.99 | 6.46 | 7 | I |
| UGC04499 | 13.00 | Sd | -15.83 | 1.86 | -8.70 | 9.42 | 19;22;20;7;18 | I,II |
| UGC05005 | 52.00 | I | -17.69 | 1.76 | -8.66 | 10.42 | 6;13 | I, X |
| UGC05139 | 3.80 | IAB | -14.78 | 1.99 | -8.66 | 8.43 | 7 | I |
| UGC05272 | 6.43 | IB | -15.84 | 2.45 | -8.11 | 9.91 | 11;6;18 | III,I |
| UGC05423 | 5.30 | I | -14.73 | 2.32 | -8.33 | 8.30 | 7 | I |
| UGC05470 | 0.24 | E | -10.90 | 2.16 | -8.49 | 7.54 | 12 | VIII |
| UGC05750 | 56.00 | SBd | -17.74 | 1.46 | -8.96 | 10.43 | 13;6 | X, I |
| UGC05999 | 45.00 | I | -17.88 | 2.25 | -8.18 | 10.98 | 13 | X |
| UGC06253 | 0.23 | E | -9.28 | 2.04 | -8.61 | 7.42 | 12 | VIII |
| UGC06446 | 12.00 | Scd | -17.11 | 2.00 | -8.60 | 9.15 | 19;22;7 | I,II |
| UGC07559 | 3.20 | I | -13.77 | 1.72 | -8.91 | 8.55 | 22;7 | I |
| UGC07699 | 9.30 | SBc | -17.53 | 1.99 | -8.63 | 9.54 | 18 | I |
| UGC09211 | 12.60 | I | -15.18 | 1.95 | -8.62 | 8.98 | 19;6;22;7 | I,II |
| UGC09749 | 0.07 | E | -3.95 | 2.41 | -8.20 | 7.62 | 12;27 | VIII, IX |
| UGC10310 | 14.15 | Sm | -17.31 | 1.85 | -8.79 | 9.49 | 18;7 | I |
| UGC10822 | 0.08 | E | -7.90 | 2.05 | -8.58 | 7.71 | 12;27 | VIII, IX |
| UGC11557 | 19.70 | SABd | -18.26 | 2.08 | -8.55 | 9.81 | 18;7 | I |
| UGC11583 | 5.60 | I | -15.35 | 1.74 | -8.68 | 8.54 | 3 | III |
| UGC11707 | 15.90 | Sd | -16.52 | 2.13 | -8.48 | 9.78 | 20;22;7;18 | I, II |
| UGC11820 | 13.30 | SABm | – | 1.93 | -8.49 | 10.65 | 11 | III |
| UGC11861 | 25.10 | SABd | -20.08 | 2.05 | -8.53 | 10.33 | 20;22 | I, II |
| UGC12060 | 15.70 | IB | -16.37 | 2.41 | -8.21 | 9.49 | 18;22;7 | I |
| UGC12632 | 6.90 | SABm | -17.12 | 2.18 | -8.45 | 9.75 | 22;7 | I |
| UGC12732 | 13.20 | SABm | -16.77 | 1.87 | -8.70 | 9.72 | 19;20;22;7 | I,II |