RESULTS FROM BASS, THE BANYAN ALL-SKY SURVEY
Abstract
We present results from the BANYAN All-Sky Survey (BASS), a systematic all-sky survey for brown dwarf candidates in young moving groups. We describe a cross-match of the 2MASS and AllWISE catalogs that provides a list of 98 970 potential nearby dwarfs with spectral types later than M5 with measurements of proper motion at precisions typically better than 15 , as well as the Bayesian Analysis for Nearby Young AssociatioNs II tool (BANYAN II) which we use to build the BASS catalog from this 2MASS–AllWISE cross-match, consisting of more than 300 candidate members of young moving groups. We present the first results of a spectroscopic follow-up of those candidates, which allowed us to identify several new low-mass stars and brown dwarfs displaying signs of low gravity. We use the BASS catalog to show tentative evidence for mass segregation in AB Doradus and Argus, and reveal a new 13 co-moving companion to a young low-mass star in BASS. We obtain a moderate-resolution near-infrared spectrum for the companion, which reveals typical signs of youth and a spectral type L4 .
1 Département de Physique, Université de Montréal, C.P. 6128 Succ. Centre-ville, Montréal, Qc H3C 3J7, Canada
2 IPAC Fellow
3 Department of Terrestrial Magnetism, Carnegie Institution of Washington, Washington, DC 20015, USA
4 Hubble Fellow
5 Canada-France-Hawaii Telescope, 65-1238 Mamalahoa Hwy, Kamuela, HI 96743, USA
1. INTRODUCTION
Nearby young moving groups (YMGs) such as TW Hydrae (TWA; 8 – 12 Myr; de La Reza et al., 1989; Zuckerman & Song, 2004), Pictoris (PMG; 26 – 29 Myr; Zuckerman et al., 2001; Malo et al., 2014), Tucana-Horologium (THA; 20 – 40 Myr; Torres et al., 2000; Zuckerman & Webb, 2000), Carina (20 – 40 Myr; Torres et al., 2008), Columba (20 – 40 Myr; Torres et al., 2008), Argus (ARG; 30 – 50 Myr; Makarov & Urban, 2000) and AB Doradus (ABDMG; 70 – 120 Myr; Zuckerman et al., 2004) provide a unique opportunity for the study of young, age-calibrated very low-mass stars and brown dwarfs (BDs) in the Solar neighborhood. The current census of bona fide members of those groups is still limited to early-type ( M0) stars, whereas a small fraction of the expected M0–M5 population has been only recently explored (Shkolnik et al., 2012; Malo et al., 2013; Rodriguez et al., 2013; Kraus et al., 2014). The identification of the even fainter BD members is a challenging task which requires a kinematic and spectroscopic follow-up of a large number of faint targets: only a handful of such BD candidate members have been identified so far (Mamajek, 2005; Looper et al., 2007; Rice et al., 2010; Delorme et al., 2012; Liu et al., 2013; Faherty et al., 2013; Gagné et al., 2014a; Gagné et al., 2014b).
The Banyan All-Sky Survey (BASS) was initiated to search for this missing M5 population of young low-mass stars and BDs in nearby moving groups. Completing this population will open the door to answering a number of fundamental questions on the formation process of such low-mass objects, e.g. by constraining the low-mass end of the initial mass function and studying the physical properties of these objects in coeval populations of well-defined ages. A few results from the BASS survey were already published, including the discovery of a planetary-mass companion to a M5.5 binary low-mass star in THA (Delorme et al., 2013) and the first L dwarf candidate member to TWA (Gagné et al., 2014b).
We describe here the candidate selection process that was used to build a list of several hundreds of young, late-type candidate members to moving groups (Sections 2. and 3.); the status of our spectroscopic follow-up (Sections 4. and 5.); as well as a number of preliminary results from the BASS survey (Section 6.).
2. SELECTION OF CANDIDATES
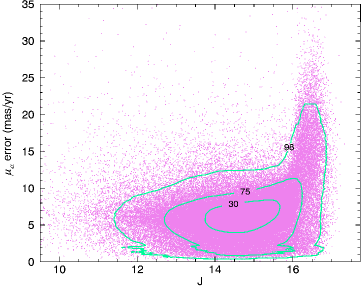
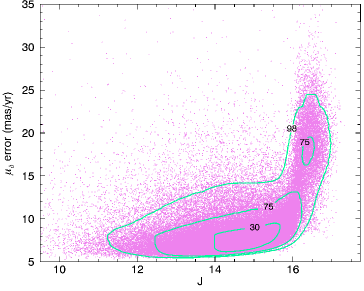
Candidate members of YMGs in the BASS survey were selected from an initial cross-match of the Two Microns All-Sky Survey (2MASS; Skrutskie et al., 2006) with the AllWISE survey (Wright et al., 2010; Kirkpatrick et al., 2014). All sources in AllWISE were already matched with their 2MASS counterpart if it is located within an angular distance of 3”. We used all unmatched sources in both catalogs to identify additional matches with angular distances up to 25”, for all 173 443 sources outside of the Galactic plane and surviving a set of various quality and color filters. We rejected spurious matches for which colors were not consistent with late-type objects (i.e., or ). We used the astrometric measurements in both catalogs to determine the proper motions with typical precisions of 5–15 for bright sources () and 5–25 for fainter sources
(Figure 1). We then selected all sources with a proper motion larger than 30 at a confidence level larger than 5. This set of 98 970 objects corresponding to potential nearby, later-than-M5 dwarfs, was used as the input sample for the identification of new candidate members of nearby, young moving groups. Cross-matching this sample with the Initial Gaia Source List (Vizier catalog I/324/igsl3) revealed that our 2MASS–AllWISE proper motions are consistent with those of UCAC4 (Zacharias et al., 2013) and PPMXL (Roeser et al., 2010), with reduced values of 1.27 and 1.03 for and , respectively.
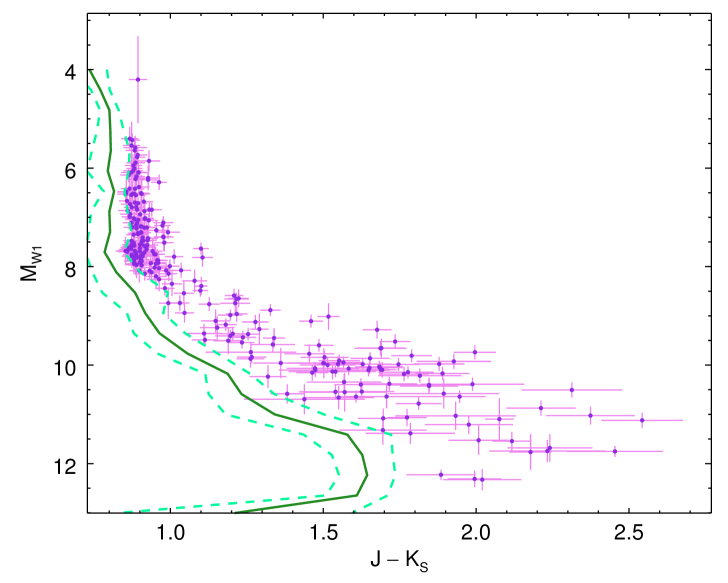
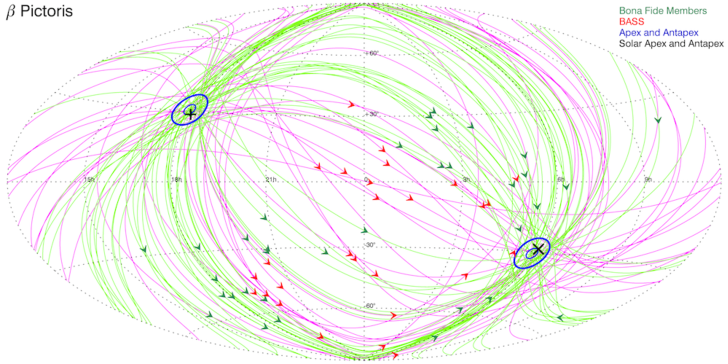
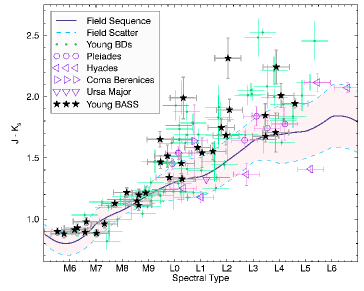
We used the Bayesian Analysis for Nearby Young AssociatioNs II tool111Publicly available at http://www.astro.umontreal.ca/~gagne/banyanII.php. (BANYAN II; Gagné et al., 2014a) to identify candidate members of YMGs considered here, amongst the input sample of potential nearby M5 dwarfs described above. This tool takes as inputs the sky position, proper motion and 2MASS , , as well as AllWISE and apparent magnitudes of a given source and compares them to spatial and kinematic models for the Galactic position and space velocity of these associations and field stars, as well as field and young dwarf sequences in two distinct color-magnitude diagrams (CMDs; versus and versus ). Young objects are expected to fall on the red side of the field sequence in these CMDs, due to their larger luminosity (a consequence of their inflated radius) and/or the enhanced presence of dust in their photosphere (in the case of L-type BDs; see Figure 2). The comparison with these models is performed using a naive Bayesian classifier, where different hypotheses consist in membership to the field or the YMGs considered here. Since radial velocity and distance are not known for the BASS catalog, those parameters are marginalized in Bayes’ theorem (i.e., a range of radial velocities and distances are tested and the output probability density functions are integrated over those two parameters). The BANYAN II tool outputs a statistical prediction for the distance and radial velocity and a probability associated to each hypothesis. For more information, we refer the reader to Gagné et al. (2014a) and J. Gagné et al. (submitted to ApJ). All sources with a Bayesian probability lower than 10% or with a predicted position on the blue side of the field sequence in any of the two CMDs described above were rejected. All 273 sources with CMD positions at least 1 redder than the field sequence were selected to define the BASS catalog (Figure 2), whereas the 275 sources with colors within the field scatter were selected to define the low-priority BASS (LP-BASS) catalog. In Figure 3, we show the sky position and proper motion of candidate members of PMG in BASS, compared to its bona fide members. It can be seen that the proper motions of both samples are consistent and point towards the apex of the moving group.
3. THE BASS CATALOG
We performed a literature search for all 548 sources in the BASS and LP-BASS catalogs to gather any relevant information, such as multiplicity, age, radial velocity, trigonometric distance, spectral types or membership to associations, to refine Bayesian membership probabilities with the BANYAN II tool. We also determined an estimated maximal hit rate of 87% and 74% in the BASS and LP-BASS catalogs, respectively, which is obtained by calculating the fraction of candidates that were rejected by any additional information in the literature, compared to the number of candidates for which additional information was consistent with suspected membership.
We retrieve a total of 60/97 of all known candidates or bona fide members to the YMGs considered here in the BASS catalog, as well as an additional three in LP-BASS. Most (22/36) of the remaining objects were missed because of quality filters that were applied in the construction of our input list, whereas the 14 others were missed because of low Bayesian probabilities.
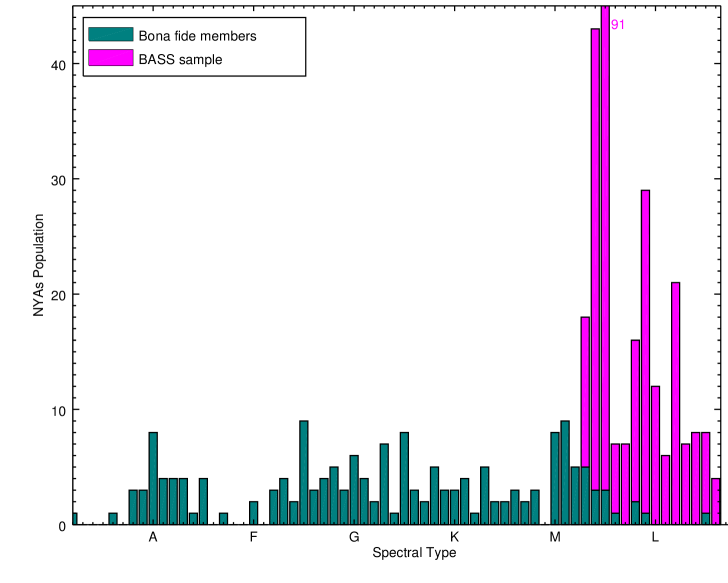
We used the BT-SETTL atmosphere models (Allard et al., 2013; Rajpurohit et al., 2013), AMES-Cond isochrones (Baraffe et al., 2003), the 2MASS and AllWISE magnitudes, as well as the most probable statistical distances of BASS candidates to estimate their spectral types (Figure 4) and masses. We find that the BASS sample potentially contains 101 previously unknown young BDs, 22 of them having estimated masses below 13 .
4. SIGNATURES OF YOUTH IN LOW-MASS STARS AND BROWN DWARFS
Young low-mass stars and BDs have a larger radius as a consequence of their gravitational contraction phase, which is still ongoing. The thermal energy released by this contraction makes them hotter than field dwarfs of the same mass: both effects conspire to make them more luminous than older objects of a similar mass. Since spectral types are mostly dependent on temperature, young dwarfs are less massive and more inflated than older objects of the same spectral type, and thus have a lower surface gravity. This in turn yields a lower pressure in their atmospheres, decreasing the effects of pressure broadening and collision-induced absorption of the H2 molecule. These effects respectively cause young objects to have a a smaller equivalent width of atomic absorption lines such as K I, Na I, FeH and CrH (Lyo et al., 2004; McGovern et al., 2004; Cruz et al., 2009), as well as a triangular-shaped continuum in the -band (Rice et al., 2010). Furthermore, atmospheric cloud thickness is enhanced in young L dwarfs, which causes stronger VO absorption and redder near-infrared (NIR) colors (Allers et al., 2007; Burgasser et al., 2008; Looper et al., 2008).
Kirkpatrick et al. (2006) suggest appending a Greek-letter suffix to the spectral type nomenclature, in order to differentiate field dwarfs with a normal surface gravity () from younger dwarfs with a mild low surface gravity () or those with a very low surface gravity (). Cruz et al. (2009) follow this nomenclature and assign a gravity classification to several new young L dwarfs, by visually comparing their optical spectra with those of various spectroscopic standards. Allers & Liu (2013) presents a quantitative method to assign a gravity classification to M5 dwarfs using various spectroscopic indices and equivalent widths suitable for NIR spectroscopy with resolutions or (depending on individual indices). They find that young dwarfs do not display uniform signs of low gravity, in the sense that young objects of the same age and spectral type can reveal their low-gravity nature through distinct properties. For this reason, a set of several low-gravity indices must be considered altogether to assign a low-gravity classification. They build several sequences of spectral types – spectroscopic indices which are each used to assign a low-gravity score associated to a particular gravity-sensitive index, then all scores are combined together to a final gravity classification of either field gravity (FLD-G), intermediate gravity (INT-G) or very low gravity (VL-G). They report that the FLD-G, INT-G and VL-G classifications are consistent with the respective , and classifications used in the optical. For this reason, we follow the suggestion of Kirkpatrick et al. (2006) and use a Greek-letter classification in the remainder of this work.
5. SPECTROSCOPIC FOLLOW-UP
We initiated a low- to mid-resolution ( to ) spectroscopic follow-up of the BASS catalog to assign spectral types and identify signs of youth in the NIR and optical, using GMOS (Hook et al., 2004) and FLAMINGOS-2 (Eikenberry et al., 2004) at the Gemini-North and Gemini-South telescopes; SpeX (Rayner et al., 2003) at the IRTF; as well as FIRE (Simcoe et al., 2013) and MAGE (Marshall et al., 2008) at the MAGELLAN telescopes. We obtained more than 255 hours of queue observing and 15 nights of classical observing that were dedicated to this project in the 2012A to 2014B semesters.
6. RESULTS FROM THE BASS SURVEY
We present in this section preliminary results from the BASS survey: this includes a number of new young BDs (Section 6.1), a new planetary companion to a low-mass star (Section 6.2) and tentative indications of mass segregation in some YMGs (Section 6.3).
6.1 New Low-Mass Stars and Brown Dwarfs with Signs of Low-Gravity
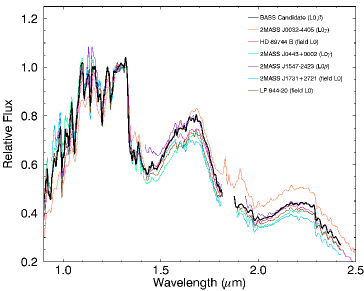
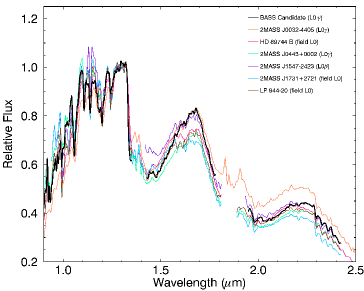
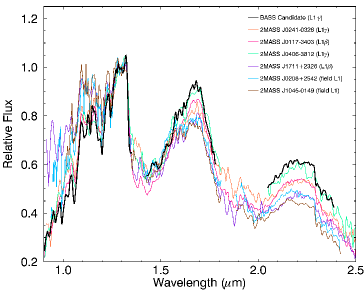
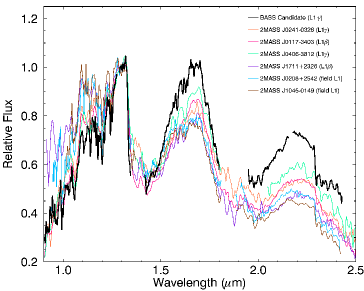
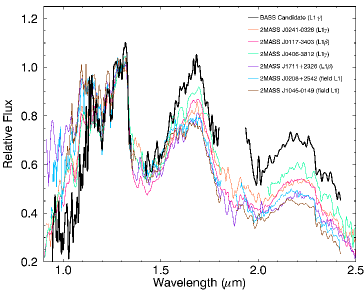
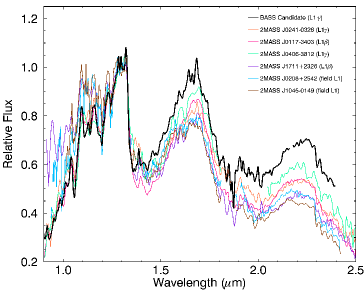
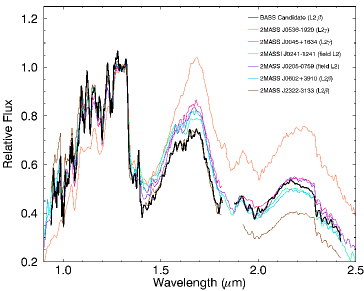
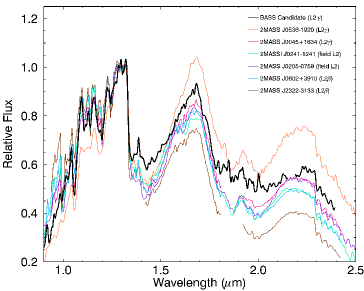
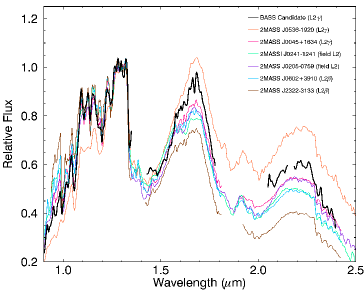
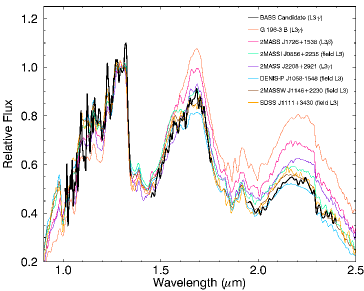
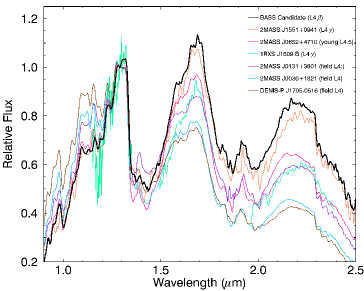
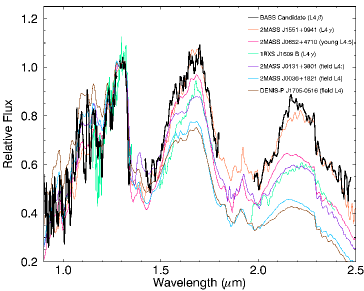
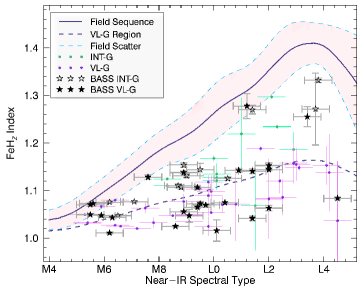
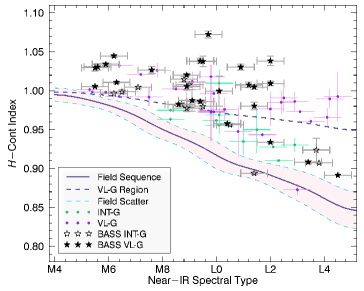
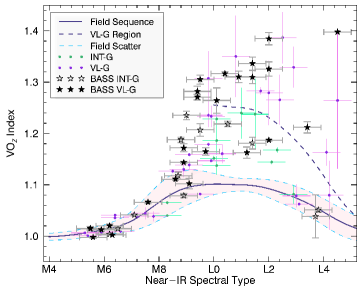
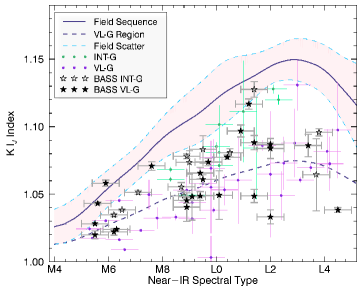
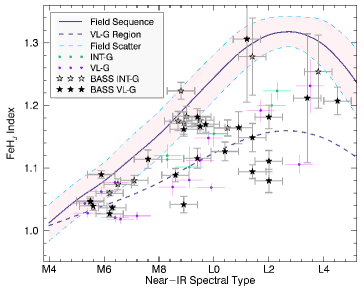
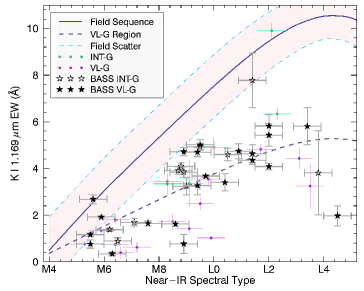
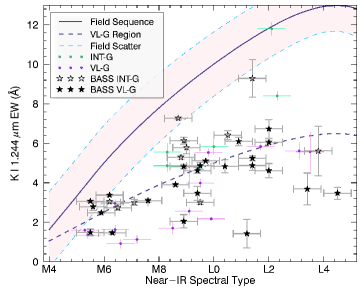
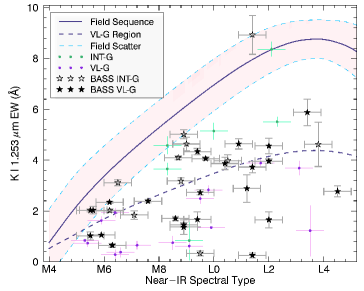
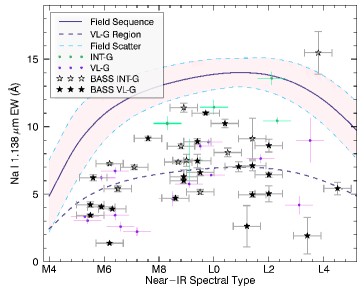
We identified more than 45 new BDs displaying signs of low gravity (youth), some of which are presented in Figures 5 and 6. We used both a visual and an index-based classification to assess signs of low-gravity. Visual comparison was done using the method of Cruz et al. (2009) in the optical and K. Cruz et al. (in preparation; see also Cruz & Núñez, 2007) in the NIR: the , and bands are normalized individually to ensure that the classification is not affected by the large spread in NIR colors of BDs. We used the NIR classification scheme of Allers & Liu (2013) to confirm the visual classifications, and found that both methods agree very well. In Figures 7 and 8, we compare the gravity-sensitive indices of young BASS candidates to sequences defined by Allers & Liu (2013). These Figures demonstrate how the BASS survey represents a significant contribution to the set of currently known young BDs. More importantly, all these new young BDs are potentially age-calibrated members of nearby moving groups, which will be of crucial importance in understanding how their properties correlate with age. Allers & Liu (2013) note that their respective gravity classes FLD-G, INT-G and VL-G seem to correspond to respective ages of 200 Myr, 50–200 Myr and 10–30 Myr, using 25 young BDs with age constraints.
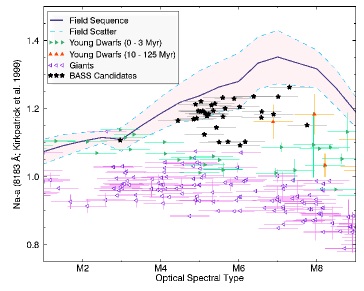
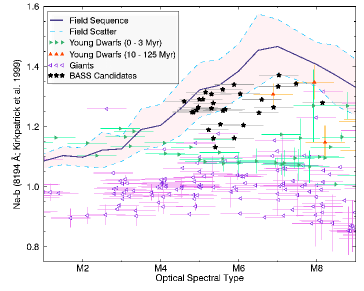
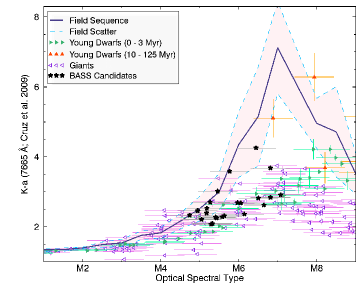
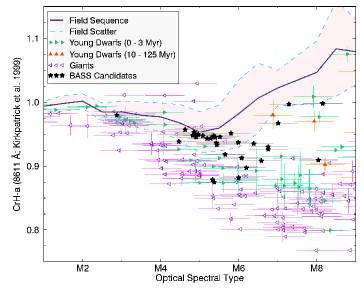
In Figure 9, we compare various optical gravity-sensitive indices of M-type dwarfs from BASS to preliminary sequences built from field, young and giant M-type stars obtained from the DwarfArchives222http://dwarfarchives.org, the Sloan Digital Sky Survey (SDSS; Abazajian et al., 2009) and the Ultracool RIZzo spectral library333http://www.astro.umontreal.ca/~gagne/rizzo.php (Kirkpatrick et al., 2000; Cruz & Reid, 2002; Cruz et al., 2003; Cruz et al., 2007; Reid et al., 2008). This allowed us to identify several candidates with signs of low-gravity in the optical, however we find that it is challenging to differentiate young and old M5 dwarfs using these spectroscopic indices.
6.2 A New Planetary-Mass Companion to a Young Moving Group Candidate Member
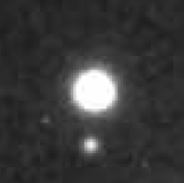
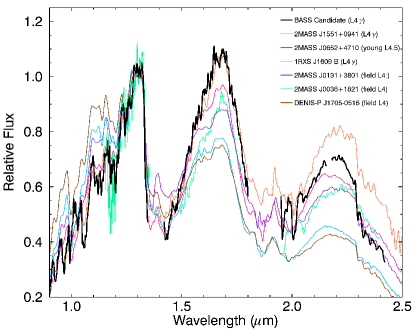
We used acquisition images from our spectroscopic follow-up to identify a large-separation co-moving companion to a young low-mass star in the BASS sample (Figure 10). A spectroscopic follow-up with the FIRE spectrometer revealed that the companion is young, with a spectral type L4 . This result will be presented in more detail in an upcoming paper (É. Artigau et al., in preparation).
6.3 Tentative Indications of mass segregation
The Virial theorem suggests that a group of isolated and gravitationally interacting stars should relax towards a state of equilibrium where every star possesses the same quantity of kinetic energy. For this reason, it is expected that the massive stars of such a group would have a smaller velocity spread compared to the less massive members. This effect has been observed in several associations of stars (Jeffries et al., 2004; Hasan & Hasan, 2011; Olczak et al., 2011; Pang et al., 2013), however it has never been demonstrated for any of the YMGs considered here.
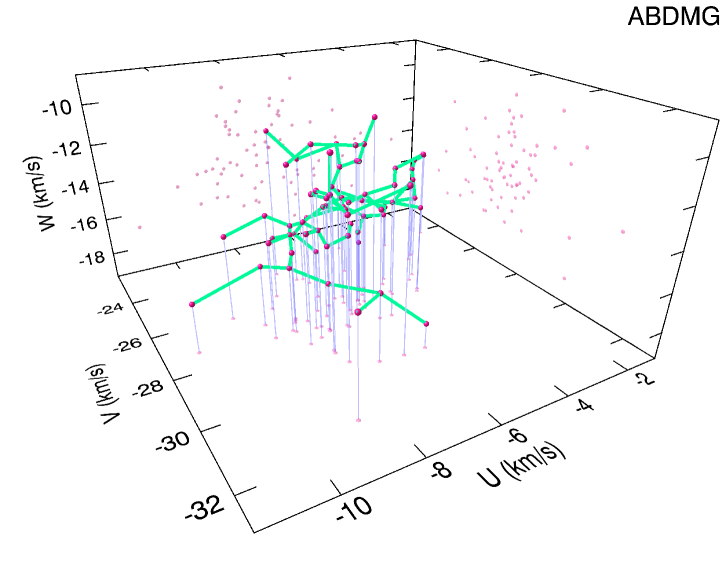
Olczak et al. (2011) introduced a quantitative method to measure mass segregation in associations of stars, based on the principle of Minimum Spanning Trees (MSTs). An MST is defined as the shortest network of lines that connects together a set of points, without creating any loop (see Figure 11 for an example). This offers the crucial advantage of measuring the typical length scale of a distribution without any prior knowledge on its geometry. For example, determining the MST of the spatial distribution of members of a YMG will yield its length scale without needing to determine its center of mass. This property is crucial in the case of YMGs, because we expect many of their members to be still missing, not to mention that the masses of those that we know are generally not well constrained.
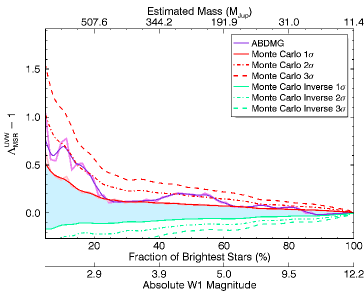
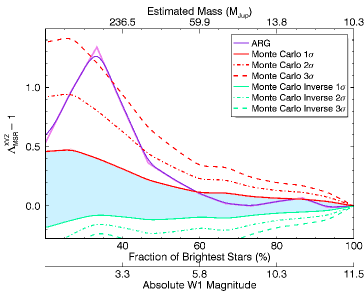
We use a metric for the measurement of mass segregation that is defined by Allison et al. (2009); the total length of the MST is determined for a subset of the most massive stars of a given association (we call this measurement ), and then this is repeated for a large number of random subsets of stars in the same association (which yields an array of lengths ). The Mass Segregation Ratio (MSR; not to be confused with MST) is then defined as :
| (1) |
where denotes the mean value of an array . The standard deviation of can be used in turn to assess the statistical signification of .
We applied this method to the spatial and kinematic distributions of bona fide members and BASS candidates of YMGs considered here, for all possible values of . Instead of selecting subsets of stars based on their estimated masses which are uncertain, we rather use their absolute magnitudes, which should vary monotonically with mass for a coeval population. We present partial results in Figure 12: we find that objects in ARG have an MSR larger than unity at a 3 significance when selecting the subset of stars more massive than 0.27 (corresponding to a positive mass segregation, i.e. more massive stars being more concentrated), whereas we find positive dynamical mass segregation in ABDMG with a 1 significance if we select stars more massive than 0.48 or 0.22 . More detail on these results will be presented in J. Gagné et al. (submitted to ApJ), but we point out that measurements of radial velocity and parallax for all BASS candidates will be needed to corroborate these tentative results.
7. CONCLUSIONS
We present a description of the candidate selection method that we used to build the BASS catalog of very low-mass candidate members of YMGs, as well as a spectroscopic follow-up to identify signs of youth in their NIR and optical spectra. We present first results from this survey, including several new low-mass stars and BDs displaying telltale signs of youth such as a triangular -band continuum or lower-than-normal atomic line equivalent widths. We adapt the method of minimum spanning trees to YMGs, and use it to identify tentative signs of spatial and dynamical mass segregation in YMGs, however we stress that a complete measurement of the kinematics of the BASS sample will be needed to verify these results.
-
Acknowledgements.
The authors would like to thank Kelle Cruz, Katelyn Allers, David Rodriguez, Philippe Delorme, Mickaël Bonnefoy, André-Nicolas Chené, Adric Riedel, Loïc Albert, Ben Oppenheimer, David Blank, Amélie Simon, Carlo Felice Manara, Jonathan Foster and Zahed Wahhaj for useful comments and discussions and/or for sharing data. We also wish to thank various telescope operators and staff scientists which were of great help through our numerous observing runs; Stuart Ryder, Rubén Diaz, Stépanie Côté, Mischa Schirmer, John Blakeslee, Sandy Leggett, Mike Connelley, Brian Cabreira, Bill Golisch, Dave Griep and Tony Matulonis. This work was supported in part through grants from the the Fond de Recherche Québécois - Nature et Technologie and the Natural Science and Engineering Research Council of Canada. This research has benefitted from the SpeX Prism Spectral Libraries, maintained by Adam Burgasser at http://pono.ucsd.edu/~adam/browndwarfs/spexprism, and the Database of Ultracool Parallaxes at http://www.cfa.harvard.edu/~tdupuy/plx/Database_of_
Ultracool_Parallaxes.html. This research made use of; the SIMBAD database and VizieR catalog access tools, operated at Centre de Données astronomiques de Strasbourg, France (Ochsenbein et al., 2000); data products from the Two Micron All Sky Survey (2MASS), which is a joint project of the University of Massachusetts and the Infrared Processing and Analysis Center (IPAC)/California Institute of Technology (Caltech), funded by the National Aeronautics and Space Administration (NASA) and the National Science Foundation (NSF; Skrutskie et al., 2006); data products from the Wide-field Infrared Survey Explorer (WISE), which is a joint project of the University of California, Los Angeles, and the Jet Propulsion Laboratory (JPL)/Caltech, funded by NASA (Wright et al., 2010); the NASA/IPAC Infrared Science Archive, which is operated by the JPL, Caltech, under contract with NASA; the M, L, and T dwarf compendium housed at http://DwarfArchives.org and maintained by Chris Gelino, Davy Kirkpatrick, and Adam Burgasser. This work is based on observations obtained at the Gemini Observatory (program numbers GS-2012B-Q-70, GN-2013A-Q-106, GS-2013A-Q-66, GS-2013B-Q-79, GN-2013B-Q-85, GS-2014A-Q-55 and GN-2014A-Q-94), which is operated by the Association of Universities for Research in Astronomy, Inc., under a cooperative agreement with the NSF on behalf of the Gemini partnership: the NSF (United States), the National Research Council (Canada), the Comisión Nacional de Investigación Científica y Tecnológica (Chile), the Australian Research Council (Australia), Ministério da Ciência, Tecnologia e Inovação (Brazil) and Ministerio de Ciencia, Tecnología e Innovación Productiva (Argentina). This work is based on observations obtained with the Flamingos 2 spectrometer, which was designed and constructed by the IR instrumentation group (PI: R. Elston) at the University of Florida, Department of Astronomy, with support from NSF grant AST97-31180 and Kitt Peak National Observatory. This paper includes data gathered with the 6.5 meter Magellan Telescopes located at Las Campanas Observatory, Chile (CNTAC program CN2013A-135). This research is based on observations from the Infrared Telescope Facility (program numbers 2012A097, 2012B015, 2013A055 and 2013B025), which is operated by the University of Hawaii under Cooperative Agreement no. NNX-08AE38A with the NASA, Science Mission Directorate, Planetary Astronomy Program. The authors recognize and acknowledge the very significant cultural role and reverence that the summit of Mauna Kea has always had within the indigenous Hawaiian community. We are most fortunate to have the opportunity to conduct observations from this mountain.Facilities: IRTF (SpeX), Magellan:Baade (FIRE), Gemini:South (Flamingos 2, GMOS), Gemini:North (GNIRS, GMOS).
References
- Abazajian et al. (2009) Abazajian, K. N., Adelman-McCarthy, J. K., Agüeros, M. A., et al. 2009, ApJS, 182, 543
- Allard et al. (2013) Allard, F., Homeier, D., Freytag, B., Schaffenberger, & Rajpurohit, A. S. 2013, Mem. Soc. Astron. Ital., 24, 128
- Allers & Liu (2013) Allers, K. N., & Liu, M. C. 2013, ApJ, 772, 79
- Allers et al. (2007) Allers, K. N., Jaffe, D. T., Luhman, K. L., et al. 2007, ApJ, 657, 511
- Allison et al. (2009) Allison, R. J., Goodwin, S. P., Parker, R. J., et al. 2009, MNRAS, 395, 1449
- Artigau et al. (2009) Artigau, É., Lafrenière, D., Doyon, R., et al. 2009, Cool Stars, 1094, 493
- Baraffe et al. (2003) Baraffe, I., Chabrier, G., Barman, T. S., Allard, F., & Hauschildt, P. H. 2003, A&A, 402, 701
- Burgasser et al. (2008) Burgasser, A. J., Cruz, K. K., Liu, M. C., Ireland, M. J., & Dupuy, T. J. 2008, ApJ, 681, 579
- Cruz et al. (2009) Cruz, K. K., Kirkpatrick, D. J., & Burgasser, A. J. 2009, AJ, 137, 3345
- Cruz et al. (2003) Cruz, K. K., Lowrance, P., Reid, N. I., Liebert, J., & Kirkpatrick, D. J. 2003, AJ, 126, 2421
- Cruz & Núñez (2007) Cruz, K. K., & Núñez, A. 2007, in Cool Stars, Department of Astrophysics, American Museum of Natural History, Central Park West at 79th Street, New York, NY 10034, USA ; Department of Physics & Astronomy, Hunter College, 695 Park Avenue, New York, NY 10065, USA, Barcelona
- Cruz & Reid (2002) Cruz, K. K., & Reid, N. I. 2002, AJ, 123, 2828
- Cruz et al. (2007) Cruz, K. K., Reid, N. I., Kirkpatrick, D. J., et al. 2007, AJ, 133, 439
- de La Reza et al. (1989) de La Reza, R., Torres, C. A. O., Quast, G., Castilho, B. V., & Vieira, G. L. 1989, ApJ, 343, L61
- Delorme et al. (2012) Delorme, P., Gagné, J., Malo, L., et al. 2012, A&A, 548, 26
- Delorme et al. (2013) Delorme, P., Gagné, J., Girard, J. H., et al. 2013, A&A, 553, L5
- Eikenberry et al. (2004) Eikenberry, S. S., Elston, R., Raines, S. N., et al. 2004, in Ground-based Instrumentation for Astronomy. Edited by Alan F. M. Moorwood and Iye Masanori. Proceedings of the SPIE, ed. A. F. M. Moorwood & M. Iye, University of Florida, USA (SPIE), 1196–1207
- Faherty et al. (2013) Faherty, J. K., Cruz, K. K., Rice, E. L., Mamajek, E. E., & Núñez, A. 2013, AJ, 145, 2
- Gagné et al. (2014a) Gagné, J., Lafrenière, D., Doyon, R., Malo, L., & Artigau, É. 2014a, ApJ, 783, 121
- Gagné et al. (2014b) Gagné, J., Faherty, J. K., Cruz, K. K., et al. 2014b, ApJL, 785, L14
- Gagné et al. (2014c) Gagné, J., Lafrenière, D, Doyon, R., et al. 2014c, ApJL, 792, L17
- Hasan & Hasan (2011) Hasan, P., & Hasan, S. N. 2011, MNRAS, 413, 2345
- Hook et al. (2004) Hook, I. M., Jørgensen, I., Allington-Smith, J. R., et al. 2004, PASP, 116, 425
- Jeffries et al. (2004) Jeffries, R. D., Naylor, T., Devey, C. R., & Totten, E. J. 2004, MNRAS, 351, 1401
- Kirkpatrick et al. (2006) Kirkpatrick, D. J., Barman, T. S., Burgasser, A. J., et al. 2006, ApJ, 639, 1120
- Kirkpatrick et al. (2000) Kirkpatrick, D. J., Gizis, J. E., Reid, N. I., et al. 2000, AJ, 120, 447
- Kirkpatrick et al. (2014) Kirkpatrick, D. J., Schneider, A. C., Fajardo-Acosta, S., et al. 2014, ApJ, 783, 122
- Kraus et al. (2014) Kraus, A. L., Shkolnik, E. L., Allers, K. N., & Liu, M. C. 2014, AJ, 147, 146
- Liu et al. (2013) Liu, M. C., Magnier, E. A., Deacon, N. R., et al. 2013, ApJL, 777, L20
- Looper et al. (2007) Looper, D. L., Burgasser, A. J., Kirkpatrick, D. J., & Swift, B. J. 2007, ApJ, 669, L97
- Looper et al. (2008) Looper, D. L., Kirkpatrick, D. J., Cutri, R. M., et al. 2008, ApJ, 686, 528
- Lyo et al. (2004) Lyo, A. R., Lawson, W. A., & Bessell, M. S. 2004, MNRAS, 355, 363
- Makarov & Urban (2000) Makarov, V. V., & Urban, S. 2000, MNRAS, 317, 289
- Malo et al. (2014) Malo, L., Doyon, R., Feiden, G. A., et al. 2014, arXiv, 6750
- Malo et al. (2013) Malo, L., Doyon, R., Lafrenière, D., et al. 2013, ApJ, 762, 88
- Mamajek (2005) Mamajek, E. E. 2005, ApJ, 634, 1385
- Marshall et al. (2008) Marshall, J. L., Burles, S., Thompson, I. B., et al. 2008, Ground-based and Airborne Instrumentation for Astronomy II. Edited by McLean, 7014, 169
- McGovern et al. (2004) McGovern, M. R., Kirkpatrick, D. J., McLean, I. S., et al. 2004, ApJ, 600, 1020
- Ochsenbein et al. (2000) Ochsenbein, F., Bauer, P., & Marcout, J. 2000, A&AS, 143, 23
- Olczak et al. (2011) Olczak, C., Spurzem, R., & Henning, T. 2011, A&A, 532, 119
- Pang et al. (2013) Pang, X., Grebel, E. K., Allison, R. J., et al. 2013, ApJ, 764, 73
- Rajpurohit et al. (2013) Rajpurohit, A. S., Reylé, C., Allard, F., et al. 2013, A&A, 556, 15
- Rayner et al. (2003) Rayner, J. T., Toomey, D. W., Onaka, P. M., et al. 2003, PASP, 115, 362
- Reid et al. (2008) Reid, N. I., Lowrance, P., Cruz, K. K., et al. 2008, AJ, 136, 1290
- Rice et al. (2010) Rice, E. L., Faherty, J. K., & Cruz, K. K. 2010, ApJL, 715, L165
- Rodriguez et al. (2013) Rodriguez, D., Zuckerman, B., Kastner, J. H., et al. 2013, ApJ, 774, 101
- Roeser et al. (2010) Roeser, S., Demleitner, M., & Schilbach, E. 2010, AJ, 139, 2440
- Shkolnik et al. (2012) Shkolnik, E. L., Anglada-Escude, G., Liu, M. C., et al. 2012, ApJ, 758, 56
- Simcoe et al. (2013) Simcoe, R. A., Burgasser, A. J., Schechter, P. L., et al. 2013, PASP, 125, 270
- Skrutskie et al. (2006) Skrutskie, M. F., Gizis, J. E., Kirkpatrick, D. J., et al. 2006, AJ, 131, 1163
- Torres et al. (2000) Torres, C. A. O., da Silva, L., Quast, G. R., de La Reza, R., & Jilinski, E. 2000, AJ, 120, 1410
- Torres et al. (2008) Torres, C. A. O., Quast, G. R., Melo, C. H. F., & Sterzik, M. F. 2008, Young Nearby Loose Associations, ed. B. Reipurth, Vol. I (ASP: The Southern Sky ASP Monograph Publications)
- Wright et al. (2010) Wright, E. L., Eisenhardt, P. R. M., Mainzer, A. K., et al. 2010, AJ, 140, 1868
- Zacharias et al. (2013) Zacharias, N., Finch, C. T., Girard, T. M., et al. 2013, AJ, 145, 44
- Zuckerman & Song (2004) Zuckerman, B., & Song, I. 2004, ARA&A, 42, 685
- Zuckerman et al. (2004) Zuckerman, B., Song, I., & Bessell, M. S. 2004, ApJ, 613, L65
- Zuckerman et al. (2001) Zuckerman, B., Song, I., Bessell, M. S., & Webb, R. A. 2001, ApJ, 562, L87
- Zuckerman & Webb (2000) Zuckerman, B., & Webb, R. A. 2000, ApJ, 535, 959