∎
22email: salvatore.pascale@uni-hamburg.de 33institutetext: V. Lucarini 44institutetext: - Department of Mathematics and Statistics, University of Reading, Reading, UK
- Walker Institute for Climate System Research, University of Reading, Reading, UK 55institutetext: X.Feng, A. Porporato 66institutetext: - Department of Civil and Environmental Engineering, Duke University, NC, USA
Projected changes of rainfall seasonality and dry spells in a high concentration pathway 21st century scenario
Abstract
In this diagnostic study we analyze changes of rainfall seasonality and dry spells by the end of the twenty-first century under the most extreme IPCC5 emission scenario (RCP8.5) as projected by twenty-four coupled climate models participating to Coupled Model Intercomparison Project 5 (CMIP5). We use estimates of the centroid of the monthly rainfall distribution as an index of the rainfall timing and a threshold-independent, information theory-based quantity such as relative entropy (RE) to quantify the concentration of annual rainfall and the number of dry months and to build a monsoon dimensionless seasonality index (DSI). The RE is projected to increase, with high inter-model agreement over Mediterranean-type regions – southern Europe, northern Africa and southern Australia – and areas of South and Central America, implying an increase in the number of dry days up to one month by the end of the twenty-first century. Positive RE changes are also projected over the monsoon regions of southern Africa and North America, South America. These trends are consistent with a shortening of the wet season associated with a more prolonged pre-monsoonal dry period. The extent of the global monsoon region, characterized by large DSI, is projected to remain substantially unaltered. Centroid analysis shows that most of CMIP5 projections suggest that the monsoonal annual rainfall distribution is expected to change from early to late in the course of the hydrological year by the end of the twenty-first century and particularly after year 2050. This trend is particularly evident over Northern Africa, Southern Africa and western Mexico, where more than of the models project a delay of the rainfall centroid from a few days up to two weeks. Over the remaining monsoonal regions, there is little inter-model agreement in terms of centroid changes.
Keywords:
Rainfall seasonality indicators CMIP5 models Representative Concentration Pathways Drought index Monsoon1 Introduction
Climate warming induced by anthropogenic greenhouse gases (GHGs) is expected to alter the global precipitation field (Meehl et al, 2007; IPCC, 2013). The reason for that is twofold. First, the thermodynamic effect of higher surface and near-to-surface atmospheric temperatures will be to increase specific humidity, thus strengthening the hydrological cycle even if the atmospheric circulation were to remain fixed (Allen and Ingram, 2002; Held and Soden, 2006; Chou et al, 2009). Second, because of the strong energetic coupling between the water cycle and the atmosphere due to surface latent heat fluxes, radiative diabatic heating and condensation diabatic heating, modifications in the atmospheric water cycle will impact, in turn, the general circulation of the atmosphere (Alessandri et al, 2012; Bony et al, 2013). This implies that changes in the hydrological cycle can take place even if specific humidity were to remain fixed due to dynamic effects (Seager et al, 2010). With both the thermodynamic and dynamic mechanisms at play under GHGs forcing, a satisfactory comprehension of the effects of global warming on precipitation at both large and small scales requires a more robust comprehension of the response of atmospheric circulation-related fields (Shepherd, 2014).
Currently, global climate models (GCMs) are our primary tools for projecting future changes in the hydrological cycle under GHGs forcing scenarios. Although they have undergone through intense development over the last thirty years, a precise representation of the hydrological cycle has not been achieved yet, particularly at the local and continental scales (Lucarini et al, 2008; Lin, 2007; Boos and Hurley, 2013; Hasson et al, 2013; Sperber et al, 2013; Hasson et al, 2014). This is due to misrepresented small-scale hydro-climatic processes (e.g. Sabeerali et al, 2014) and structural limitations as, for example, insufficient representation of complex orography (e.g. Palazzi et al, 2013; Kapnick and Delworth, 2013) and uncertainty in the representation of sub-grid scale processes (e.g. clouds, gravity-wave drag, convection and boundary-layer). In spite of this, most of GCMs are successful in capturing well some key features of the large scale precipitation field and simulate trends such as the observed northward shift of the low-level monsoonal jet (Kitoh et al, 2013; Lee and Wang, 2014) and the mean surface temperature trends (IPCC, 2013), thus providing some confidence on their projected changes.
Most of the state-of-the-art GCMs agree on simulating a precipitation reduction in the subtropical arid and semi-arid regions and increased rainfall in the equatorial and high-latitude regions by the end of the twenty-first century under medium-to-high emission scenarios (e.g. Knutti, 2013). If such changes occur, they are going to have substantial consequences for ecosystems and human activities. Wet regions may, for example, be subject to increased flooding, whereas semiarid areas placed at the borders of the subtropical subsidence regions could see further reductions of rainfall and more prolonged droughts, thus worsening their intermittent hydro-climatic regimes (Polade et al, 2014).
Apart from knowing how the mean annual rainfall amount will change in the future, a more complete description of the modifications of the hydroclimate also requires to know how other precipitation characteristics will be affected by global warming: the statistics of intense precipitation events (e.g. frequency of events above a certain intensity, Easterling, 2000; Goswami et al, 2006; Wentz et al, 2007; Coumou and Rahmstorf, 2012; Mehran et al, 2014; Lau et al, 2013; Liu et al, 2014), change in the number of dry days and inter annual variability (Polade et al, 2014) and precipitation seasonality (Huang et al, 2013; Feng et al, 2013; Kumar, 2013), particularly for monsoonal regimes (Seth et al, 2013; Kitoh et al, 2013; Lee and Wang, 2014; Turner and Annamalai, 2012). Here we will focus on these last two aspects.
Rainfall seasonality and duration of drought events are important factors for the Mediterranean-type and monsoonal rainfall regimes. In the semi-arid Mediterranean-type regions, reduced rainfall together with extended dry periods may exacerbate the risk of prolonged drought, with potentially very severe consequences for agriculture, ecosystems and human activities (e.g. Giorgi and Lionello, 2008). In the Tropics, the seasonality of rainfall is as important as the total amount of rainfall and it is the major controlling factor of the calendar of agricultural activities. Rainfed agriculture – diffusely practiced in Asia, Africa and Latin America – provides food to millions of people and depends critically on the regularity of seasonal rainfall. Ecosystems in tropical wetlands are also extremely sensitive to the timing of arrival of rain at the beginning of the wet season and to the duration itself of the wet season (Borchert, 1994; Eamus, 1999; Rohr et al, 2013; Guan et al, 2014). Substantial changes in the timing or duration of the wet season may therefore have a huge impact on economies of many countries through its influence on water resources.
New rainfall metrics have been recently introduced by Feng et al (2013), based on a probabilistic interpretation of rainfall fractions and the concept of relative entropy (RE) borrowed from information theory (e.g. Cover and Thomas, 1991). Relative entropy is used to quantify the diversity between the time series, for a given year, of the monthly fraction of the annual precipitation and the uniform precipitation sequence. The RE provides a threshold-independent metric to quantify the concentration of annual rainfall and the number of dry months. Furthermore, it exists a linkage between RE and the effective number of wet/dry days, and thus for arid subtropical and semiarid Mediterranean-type regions the RE can be used as an objective drought index. The probabilistic interpretation of the monthly rainfall fractions also allows us to estimate circular statics moments associated describing the annual distribution of rainfall and, in particular, the center of mass (centroid) of the annual precipitation, which for seasonal rainfall regimes is a measure of the timing of the wet season.
By using these metrics, Feng et al (2013) examined six decades of rainfall data in the tropical region of the globe, beginning from 1930, and found that the timing, magnitude and duration of tropical rainfall are all significantly changing. Pascale et al (2014) applied such metrics for characterizing the seasonality of precipitation regimes as represented by observational datasets and CMIP5 GCMs over the historical period 1950-2005. Here, we aim at assessing, through these novel metrics, the projected changes in the timing, magnitude and duration of wet and dry periods over the tropical and subtropical regions by the end of the twenty-first century, as simulated by twenty-four models participating to Coupled Model Intercomparison Project phase 5 (CMIP5) (Taylor et al, 2012) under the most extreme representative concentration pathway, RCP 8.5 (Van Vuuren et al, 2011). A particular focus will be on changes of rainfall seasonality of six large areas –North and South America, North and South Africa, South Asian and Australia – belonging to the global monsoon domain (Trenberth et al, 2000; Wang and Ding, 2008). The analysis we present here differs from previous ones on global and regional precipitation response to global warming in that we use a new, coherent methodology based on a probabilistic interpretation of rainfall fractions. This approach allows us to estimate circular statics moments for the rainfall timing and a threshold-independent, information theory-based quantity such as the RE to quantify the concentration of annual rainfall and the number of dry months and to build an index of monsonality (DSI).
The structure of this paper is the following. In Sect. 2 we deal with the datasets and the indexes used for our analysis. In Sect. 4 the climatology of such indicators is presented and discussed in the context of atmospheric general circulation. Results on future changes of the seasonality properties of tropical rainfall are presented in Sect. 4 and the main findings summarized in Sect. 5.
2 Data and method
2.1 Historical and twenty-first century RCP 8.5 simulations
Twenty-four CMIP5 models (Taylor et al, 2012; Guilyardi et al, 2013) are taken into account and their historical simulations (1930-2005) and twenty-first century scenario (2006-2100) are analyzed. In Table 1 the list of the models, their horizontal resolution and the names of the research institute where they were developed are shown. Further details on the CMIP5 experiment can be found online at http://www-pcmdi.llnl.gov/. Projections available in the CMIP5 intercomparison database are generated by the latest generation of coupled climate and Earth system models. Relative to the previous intercomparison phase CMIP3 (Meehl et al, 2007), CMIP5 models generally have a higher spatial horizontal resolution of the atmospheric component (nearly one-third of the models have an atmospheric resolution of about in latitude), more Earth System Models including biogeochemical processes (Taylor et al, 2012) and improved schemes for aerosol-cloud interactions (e.g. Wilcox et al, 2013). In spite of the huge efforts to include more complexity and increase computational capacity, the improvement of CMIP5 models with respect to CMIP3 is relatively modest (Knutti, 2013).
Simulations of the historical period (Hist) are forced with both anthropogenic and natural forcings while those for the twenty-first century are based on representative concentration pathways (RCPs) (Moss et al, 2010; Meinshausen et al, 2011). We analyze the representative concentration pathway RCP 8.5 (Riahi et al, 2011), in which an anthropogenic radiative forcing of W m-2 and a mean global warming of about K is reached in the year 2100 with respect to the beginning of the pre-industrial period. This corresponds to a scenario in which the use of fossil fuels will continue unabated and with no mitigation. Multiple ensemble members for each considered scenario are available for most of the CMIP5 models selected here. In this study we selected just the first ensemble member (“r1i1p1”) for each model. Furthermore, we left out GCMs with serious inconsistencies in the water cycle in their control (unforced) runs for which long-term annual means of evaporation minus precipitation is larger, in absolute value, than m3 s-1 and equivalent to an energy bias larger than W m-2 (Liepert and Previdi, 2012; Liepert and Lo, 2013). Models are compared over land with the GPCC (Schneider et al, 2013; Becker et al, 2013) and CRU (Harris et al, 2013) gridded precipitation dataset, and over the whole global surface with the GPCP dataset (Xie et al, 2003). Given the different horizontal resolutions among models themselves (Table 2) and observations (), all processed data from models and observations are linearly interpolated to a common grid when necessary.
2.2 Rainfall seasonality indicators
Rainfall properties are described through the following indicators of the magnitude, timing and duration of the wet season (Feng et al, 2013; Pascale et al, 2014):
-
1.
Annual rainfall. Given the monthly precipitation sequence (month , year ), the total annual rainfall during year is simply .
-
2.
Relative entropy. From the monthly precipitation fraction
(1) the relative entropy of the -th year is defined such as
(2) and it quantifies how different is from the monthly uniform precipitation sequence , . The relative entropy attains its maximum value when the annual rainfall is concentrated in one single month ( is taken for ) and equal to zero for a uniform precipitation sequence. As discussed in Pascale et al (2014), the RE is related to the support of the function (effective number of degrees of freedom) defined by and interpreted as the number of months of the wet season. For monsoonal hydro-climatic regimes, characterized by unimodal monthly rainfall sequences, provides a measure of the duration of the wet season. The number of dry months for each hydrological year is thus
(3) The definition of used here is different from that used in recent studies (Lau et al, 2013; Polade et al, 2014) in that it does not involve any arbitrary thresholds (e.g. mm/day in Lau et al (2013)) in order to define a dry month and wet season onsets/retreats. Although absolute thresholds for precipitation provide very stringent tests for climate models (Sperber et al, 2013), their use may lead to systematic biases due to the “dryness” or “wetness” of single models, as recently shown by Sperber and Annamalai (2014) to assess the onset and retreat of the Asian monsoon in climate models.
-
3.
Dimensionless seasonality index. The dimensionless seasonality index (DSI) is defined as (Feng et al, 2013)
(4) in which is a constant scaling factor introduced in order to make the precipitation dimensionless. We choose as the maximum of of observation gridded datasets over the whole period ( mm). According to definition (4), is zero when either (completely dry location) or ( distributed uniformly throughout the year) are zero and maximum () when is concentrated in a single month. In Pascale et al (2014) it is shown that the DSI, together with the RE, appears to be a useful indicator of the extent of the global monsoon region (GMR) (Wang and Ding, 2008; Wang et al, 2011; Lee and Wang, 2014), which generally feature large values of RE and DSI. In the following the GMR is defined as the area such that and .
-
4.
Centroid. An index of the timing of the wet season can be derived directly from the definition of in Eq. (1). From circular statistics (e.g. Jammalamadaka and Sengupta, 2001), the centroid is defined as the argument of the complex number (i imaginary unit)
(5) The centroid is an integral measure of the timing of the wet season and it is related to time of the year around which most of the annual rainfall distributed. Therefore it cannot inform us about the beginning and the end of the wet season (e.g. onset and retreat for monsoons Hasson et al, 2014; Sperber et al, 2013; Kitoh et al, 2013). It has to be noted that, although can be formally defined for any , it is not very meaningful for regions with low RE – that is for regions without a clear dry season during the year. Changes of , associated with an early-to-late or late-to-early redistribution of rainfall between 2080-2100 and 1980-2000, are obtained as the phase difference
(6) where and .
We compute , , and for each model gridpoint ( latitude, longitude) and for each hydrological year . Differences between the climatological means , , over the time periods 2100-2080 and 1980-2000 are calculated in order to analyze the effects of GHGs forcing on precipitation.
3 Indexes’ climatology
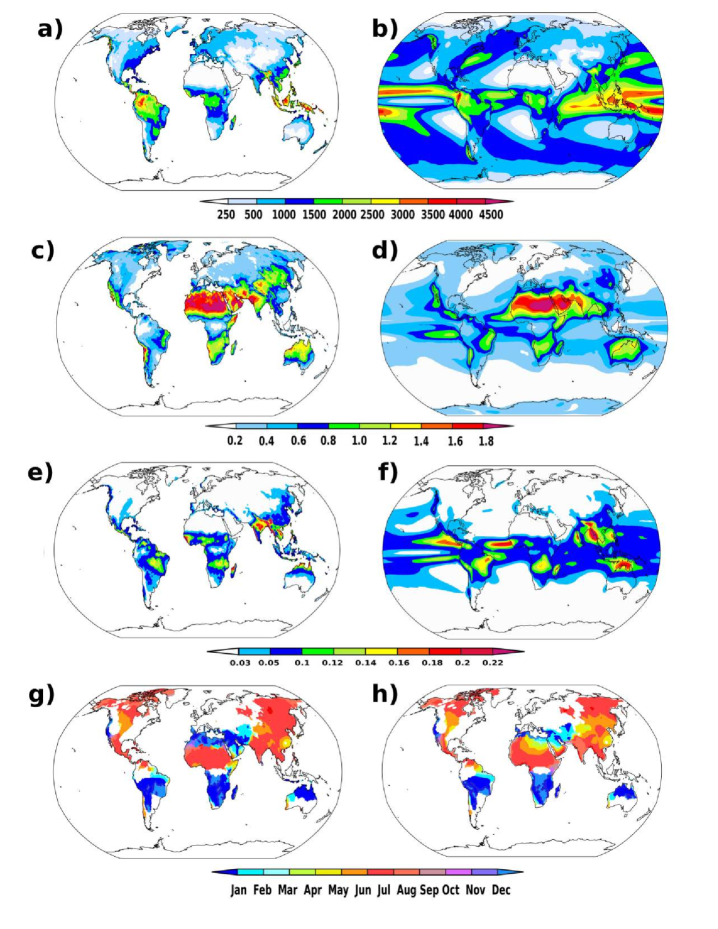
The climatological means (1950-2100) of annual precipitation, relative entropy, dimensionless seasonality index and centroid are shown in Fig. 1 for the updated GPCC land precipitation dataset (Schneider et al, 2013; Becker et al, 2013) and for the CMIP5 Multi-model Ensemble Mean (MEM)111 The MEM estimates do not necessarily give a better indication than the best performing model (Tebaldi and Knutti, 2007). Therefore we present the MEM, together with single models output, just for giving an indication about the behavior of most of the models used in this study.. Regions with the largest RE (Fig. 1(c, d)) are those placed in the arid and semi-arid subtropical subsidence belt between and N/S (southern Africa, eastern Brazil, north Australia, western India, eastern Siberia, eastern Mediterranean sea, western Americas, Middle-East and central Asia) where the little yearly rainfall is concentrated in a few months.
The DSI (Fig. 1(e, f)) has its largest values over the global monsoon region (Trenberth et al, 2000; Wang and Ding, 2008; Wang et al, 2011) – North American Monsoon region (NAM, Cook and Seager, 2013), the South American Monsoon region (SAM, Liebmann and Mechoso, 2011), the North African Monsoon region (NAF, Roehrig et al, 2013), the South African Monsoon region (SAF), the South Asian Monsoon region (SAS, Turner and Annamalai, 2012) and the Australian Monsoon region (AUS, Hendon et al, 2011). Large DSI over these areas are due to intermediate-to-high levels of annual rainfall and large relative entropy. As observed, models reproduce fairly realistic pattern of precipitation, RE and DSI but tend to show some systematic biases in RE over tropical Latin America and underestimate it in Western Africa and East Asia. Pascale et al (2014) shows that positive RE biases in a GCM are associated with simulated monthly precipitation fractions which are too large during the wet months and too small in the months preceding the wet season whereas negative biases are instead due to an excess of rainfall during the dry months.
The centroid pattern can be seen in Fig. 1 (g, h)) for both GPCC land observations and CMIP5 models (MEM). The centroid clearly shows the timing of the wet season in the monsoonal regions (e.g. July in Northern Africa or January in Northern Australia) and mediterranean climates (e.g. Middle East). Areas of transition from monsoonal summer precipitation regimes to Mediterranean-type winter precipitation regimes (e.g. Indus valley and Southwest U.S.) are characterized by a sharp transition from summer to winter months. Agreement between observation and multimodel ensemble means over land is reasonable, although some discrepancies are present. Over most of India, the simulate rainfall centroid falls in August instead of July. A delay is observed also over the South American monsoon region, where models tend to place the centroid in January instead of December. Good agreement is found over the North and South African monsoon regions, and over Australia.
The centroid MEM’s delay relatively to GPCC observations – as over India and South America – is associated with pronounced negative precipitation anomalies in the early monsoon season, as evident from the zonally-averaged annual cycle of regional monsoon precipitation (latitude-time) shown in Fig. 2 of Seth et al (2013). Fig. 1(g, h) also shows a detailed geographical view of such biases, which is inevitably lost in the zonally-averaged Hövmoller diagrams of precipitation. For example, most of the Indian region contribute to the negative May-July rainfall anomaly over India shown in Seth et al (2013), while only the northern part of South American monsoon region is interested by precipitation anomalies in the early monsoon season. Precipitation is instead underestimated over North Australia or overestimated over South Africa fairly uniformly along the whole monsoon season, resulting in no net centroid bias.
A more complicated picture emerges instead over the Southwest U.S., placed at the border between the prevalently monsoonal-type regimes of central-western Mexico and the Mediterranean-type precipitation regimes of California. Here models simulate a precipitation centroid overly shifted towards the autumn. This inconsistency, which becomes more and more serious as moving northwards toward California, arises because of two model errors: the tendencies of CMIP5 models to overestimate the late-monsoon rainfall (e.g. Geil et al, 2013; Sheffield et al, 2013) and the excessive intrusion southwards of winter midlatitude cyclones originating over the Pacific ocean, yielding a positive precipitation anomaly in December-January (Seth et al, 2013). Precipitation over transitional areas – e.g. Southwest U.S, Indus basin (Hasson et al, 2014), Sahara, East Africa – challenges GCMs and consistent biases are visible, over these regions, in Fig. 1(g, h).
4 Twenty-first century RCP8.5 projections
4.1 Magnitude: projected changes of mean annual precipitation
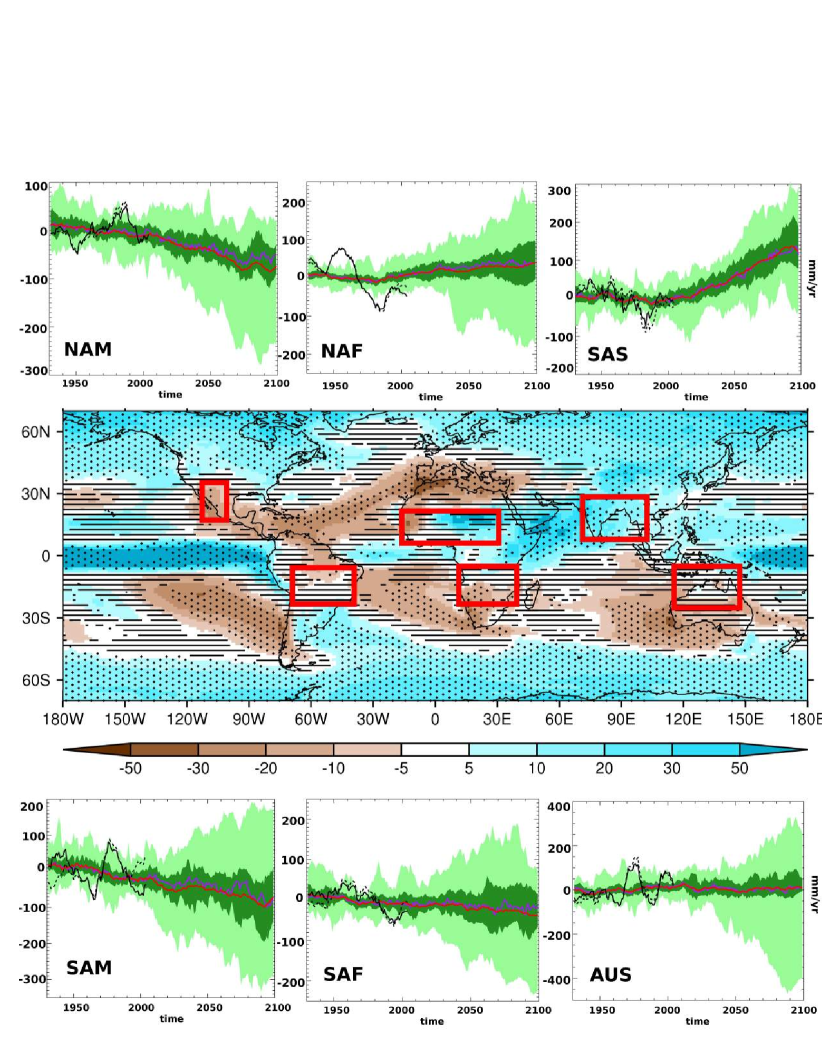
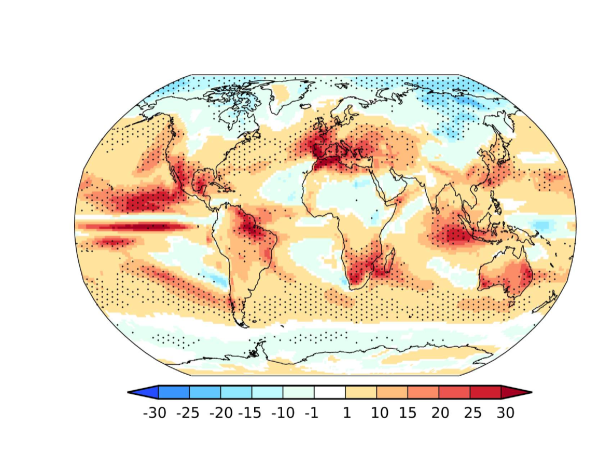
The MEM of percentage precipitation difference between the RCP8.5 and Hist (2080-2100 minus 1980-2000) is shown in Fig. 2. As reported already by several authors (Ren et al, 2013; Knutti, 2013; Chadwick et al, 2013; Kitoh et al, 2013) and by the IPCC5 Assessment Report (IPCC, 2013), CMIP5 models under the RCP8.5 scenario project an increase in the annual mean precipitation in most of the high-to-mid latitude regions and in the equatorial Pacific Ocean; subtropical subsidence zones and Mediterranean-type regions placed at the equatorward margins of the midlatitude storm tracks are instead expected to see a decrease in their mean annual precipitation. Differences with respect to the previous generation of climate models (CMIP3) have been shown to be minimal (Knutti, 2013).
Time series of the of the averaged precipitation anomalies222Note that intermodel differences in terms of precipitation can be very large (e.g. Sperber and Annamalai, 2014) and are partially hidden in showing the anomalies. relative to 1930-2000 over the six tropical monsoonal regions listed in Table 2 are shown in Fig. 2. We use the 25th and 75th percentiles and the total inter-model spread to give a statistical description of how the various model outputs are scattered. Inter-model spread is large particularly over the NAF, SAM, SAF and AUS regions (ratio of inter-model spread to signal), making hard to interpret the GCMs projections over such areas. Over the NAM and SAS regions inter-model agreement is found to be higher, with about of models agreeing on a reduction of rainfall over the NAM region and an increase over the SAS region. Comparison with observations reveals that models generally tend to underestimate natural variability, as evident from the GPCC and CRU lines often wiggling outside the total inter-model spread. This is particularly evident for the NAF region, for which the signal associated with the 1950-1980 Sahel drought (Dai et al, 2004) is well outside the total inter-model spread. As highlighted by Knutti (2013), model agreement is fairly low in the Tropics and generally better at high latitudes. In particular, changes are not robust over SAM, NAF and AUS, as reflected also by the time series in Fig. 2.
4.2 Duration and number of wet months: projected changes in relative entropy
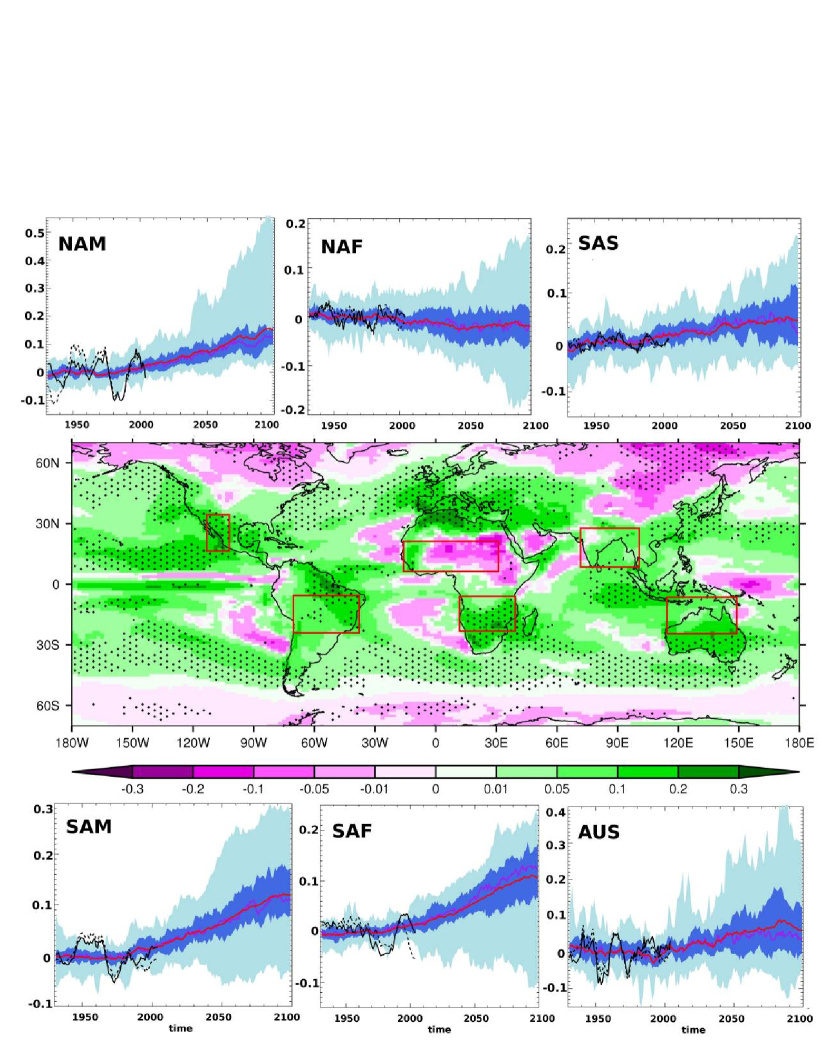
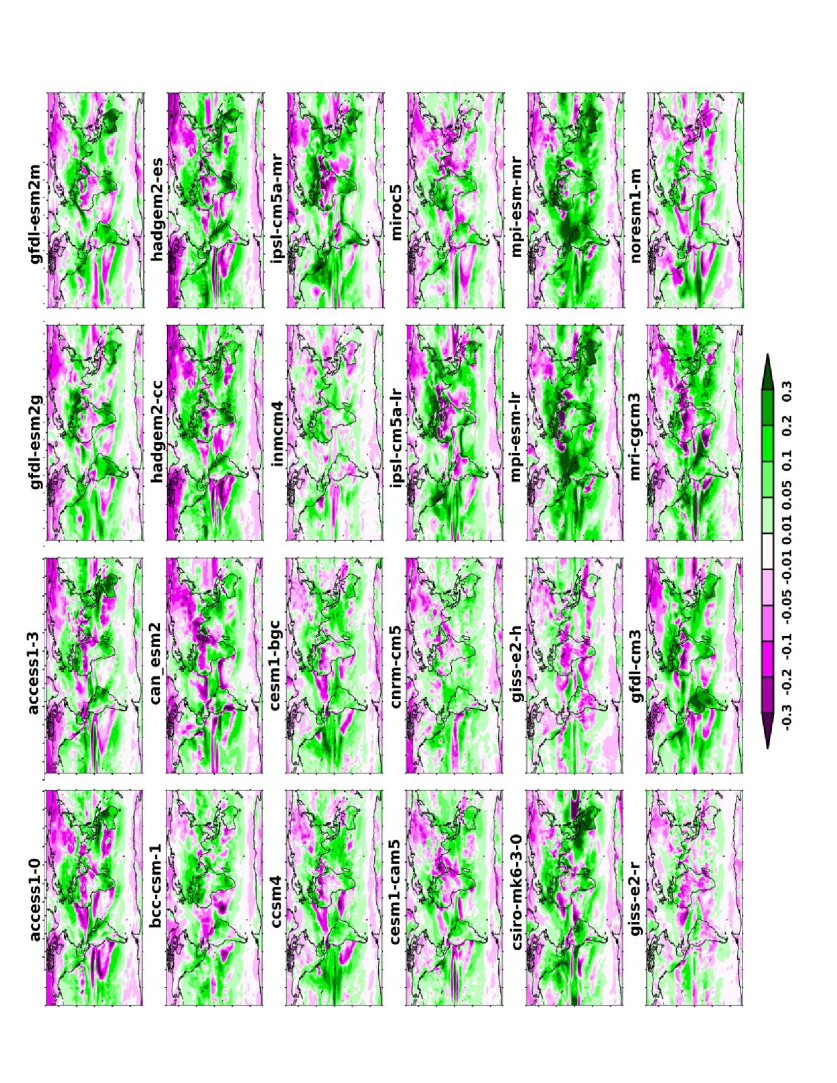
We assess here the changes in rainfall monthly fractions and number of dry months analyzing the RE metric. The MEM of the projected changes in RE is shown in Fig. 3 together with the time series of the area-averaged RE anomalies over the six monsoonal regions. Single-model projections of RE anomalies are instead shown in Fig. 4.
But what do projected RE changes practically mean in terms of precipitation regimes? Changes in RE imply changes in the number of wet and dry months, and (Eq. 3). In particular, areas where RE is projected to increase will see a reduction of and thus an increase in the number of dry months.
Over monsoonal regions (Wang and Ding, 2008), rainfall is concentrated during the (local) summer period and the dry season coincides with the (local) winter. Here a reduction of – i.e. an increase of RE – would mean a reduction of the duration of the wet season. A projected increase of RE might be associated either with an increase of the percentage of local summer rainfall over the total annual rainfall (Lee and Wang, 2014) or with a shorter duration of the wet season without any reduction of the summer rain (or with both of them). If more rainfall occurs during the middle of the monsoonal season, the associated rainfall fractions will be even larger than those associate with the pre-monsoonal and post-monsoonal months. In this sense, winter months become “drier” even if there is no reduction at all during them. Let us stress here that changes in wet season duration based on the RE do no necessarily agree with onset/retreat estimates based on absolute thresholds (Sperber et al, 2013), although a better agreement exists with relative threshold approaches such as in Sperber and Annamalai (2014).
For arid and semiarid Mediterranean-type and subtropical subsidence regions, where there is not a regular wet season and rainfall is typically erratic during the year, the RE still quantifies and , thus providing threshold-independent, objective drought index. Figure 5 shows the MEM differences in between 2080-2100 and 1980-2000 under the RCP8.5 scenario. Consistently with the RE anomalies shown in Fig. 3, more than 90 of the CMIP5 models predict a notable increase of ( up to one month) in the Mediterranean area, southern Europe, western Mexico-Southwest U.S., southern Africa, eastern Brazil and South Australia. Agreement with Fig.2 of Polade et al (2014), who used instead a threshold-dependent method to define a dry day, is remarkable.
4.2.1 RE changes in high-latitude and Mediterranean-type regions
Overall, CMIP5 RCP8.5 projections suggest a RE decrease by the end of the twenty-first century for high-latitude regions north of N and south of S. This trend is particularly strong over eastern Siberia, where moister conditions are predicted by CMIP5 models (Fig. 2). The projected increase in mean annual rainfall and decrease in RE indicates a larger number of wet days rather than by changes in precipitation intensity.
A quite coherent pattern of RE increase can be noted along the equatorward flank of the storm tracks in both hemispheres around . Such RE changes are likely to be associated with the projected poleward shift of the storm tracks (Bengtsson et al, 2006; Lucarini and Ragone, 2011) and consequent transition towards more seasonal and erratic precipitation regimes.
Most of GCMs consistently show a strong increase of the mean annual RE () by the end of the twenty-first century over the Mediterranean-type regions such as northern Africa, southern Europe, southern Australia and semi-arid regions such as northwestern Mexico. Such a large projected change in RE is related to an increase of number of dry days, (Fig. 5). In particular, southern and southeastern Mediterranean coastal regions feature a very dry June-September period with precipitation mostly concentrated between November and February (Mehta and Yang, 2008), and therefore relatively high values of RE (Fig. 1(c)). Drying of the Mediterranean region is predicted by CMIP5 models and has been documented in several studies (e.g. Kelley et al, 2012; Baker and Huang, 2014). The remarkable drop in , which is most likely associated with a lengthening of the dry spells, and conditions of reduced mean annual precipitation are expected to have a high impact on local water resources, agriculture and ecosystems. Further research is needed for a more precise explanation of the projected modifications of the rainfall seasonality and of the circulation mechanisms involved in it.
The Mediterranean pattern of positive visible in Fig. 5 extends northwards into northwestern Europe and the British Isles, for which no mean annual rainfall reduction is predicted by CMIP5 models. This gives an indications that dry period may become more prolonged, and therefore drought more severe, also in areas like northwestern Europe generally featuring relatively high annual rainfall amount and no pronounced precipitation seasonality. Let us also note that even areas of high agreement amongst models might not imply more confidence about the correctness of the projections, since common errors or deficiencies in physics parameterizations may provide false confidence in the future projections’ robustness.
4.2.2 RE changes in tropical and monsoonal regions
Tropical and subtropical regions instead show a more diverse picture. Consistent RE increases are projected over western Indonesia, eastern Brazil and southern tropical Africa. However GCMs projections over central and most of northern Africa, South Asia and a large part of Latin America are less coherent (Fig. 4). Nearly of the CMIP5 models robustly project an increase of RE over three out of the six monsoon regions selected for this study: NAM, SAF and SAM.
In particular, over the SAF area changes in annual rainfall are small and insignificant, whereas most models project consistent RE anomalies relative to the 1980-2000 period of about 0.1-0.2. Similarly, an RE increase is foreseen also over tropical Latin America and specially over its eastern area with little and insignificant changes in the mean total annual rainfall. This suggest that the (almost) same amount of annual rainfall is projected to be distributed differently, on average, by the end of the 21st century and to be more concentrated during the wet season, exacerbating the droughts of the dry winter months and increasing flood risks.
CMIP5 models suggest a reduction of precipitation over Southwest U.S. and western Mexico (Seager et al, 2013), although large differences exist in what these models predict (Fig. 2). However their agreement is much higher in terms of the sign of the RE, indicating an increase of about , (with a few models, e.g. MPI-ESM-LR or IPSL-CM5A-MR Fig. 4, up to 0.4) and corresponding to a median increase of of almost one month (Fig. 5). Such an increase in the number of dry months is coherent with with the marked rainfall reduction (up to ) between December and May (Maloney et al, 2014), leading to a much drier winter-spring period.
The positive RE projection over the SAS region is much less robust across models ( of the models), with single models showing very different responses (e.g. MRI-CGCM3 and MPI-ESM-LR featuring opposite behaviors, Fig. 4). Positive RE anomalies are consistent with an increase of monsoonal precipitation during summer, that is with the annual range of precipitation (summer minus winter) (Lee and Wang, 2014).
We have instead no confidence in the positive trends over AUS region and negative trend over the NAF region, since models show a large spread and opposite signs in their RE anomaly response during the twenty-first century. The almost zero trend over the NAF region seems to be due to a cancellation between a persistent positive trend in the western part of the NAF domain (Western Africa) and a negative trend in the eastern part. Let us finally note that model biases in some regions may decrease confidence in RE projections, including changes of the RE over the SAM region and over eastern Asia that exhibit projected RE changes in the same sense as historical biases (Pascale et al, 2014)
4.3 Global monsoon regions
Pascale et al (2014) showed that the DSI, together with the RE, is a useful indicator of the extent of the global monsoon region (GMR)(Wang and Ding, 2008; Wang et al, 2011; Kitoh et al, 2013; Lee and Wang, 2014). Rainfall in monsoonal regions is in fact concentrated in typically five-six months, from late (local) spring to early (local) autumn – with annual accumulation usually exceeding mm/yr. Therefore, the GMR usually features large values of both RE and DSI. The DSI combines intensity of rainfall and seasonality, thus excluding from the GMR dry areas with erratic rainfall regimes – e.g. Sahara – which are also characterized by high values of mean annual RE (Fig. 1 (c, e)).
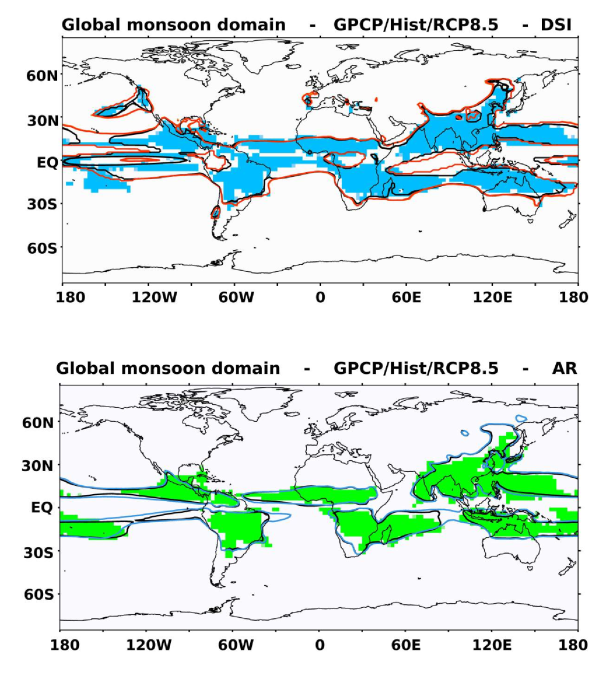
In the following the GMR is defined as the area over which we have and . In Fig. 6 we can see a comparison of the GMR as defined through the RE/DSI criterion and as defined by the Wang et al (2011)’s criterion based on the annual range of precipitation (ARP) (details in the caption). The two methods compare well over land (green and blued shading in Fig. 6), although they show some difference over oceans. Note that the DSI/RE criterion also identifies some small extratropical areas such as the West U.S. coast, southern Andes and the southwestern part of the Iberian peninsula. These areas, featuring considerable rainfall seasonality, clearly do not belong to the GMR.
Projected changes in the GMR domain by the end of the twenty-first century (2080-2100) are also shown in Fig. 6. According to the RE/DSI criterion, the limits of the GMR are not expected to change substantially over Africa, Asia, Australia and Americas, while small extensions are appreciable over the Indian and Pacific Ocean. These results thus suggest that this spatial domain is not going to have important alterations, at least on the large scale.
Our results, obtained with the novel metrics RE and DSI, thus support previous findings about the unchanged GMR under GHGs forcings based on the ARP indicator (Lee and Wang, 2014; Kitoh et al, 2013). While differences between the two criteria appear to be minor, they may still be relevant for assessing the robustness of future changes on more limited areas. Moreover, it will be important to re-focus this analysis on continental and regional scales using the output of higher resolution models to have a more refined assessment of such changes, which indeed may very relevant for local communities.
4.4 Timing: projected changes of the centroid
For regions where the annual rainfall distribution is clearly concentrated in a wet season (e.g. monsoons or Mediterranean-type), is due to a rainfall redistribution from early to late during the year while is indicative of a redistribution of rainfall from late to early in the year. This information is not necessarily equivalent, however, to a statement of delayed or moved-up monsoon onset (or retreat). Onset and retreat are in fact defined as the day (or the pentad) rainfall attains a certain absolute (Kitoh et al, 2013; Sperber et al, 2013) or relative (Hasson et al, 2014; Sperber and Annamalai, 2014) precipitation threshold and thus depend from a very localized (in time) event.
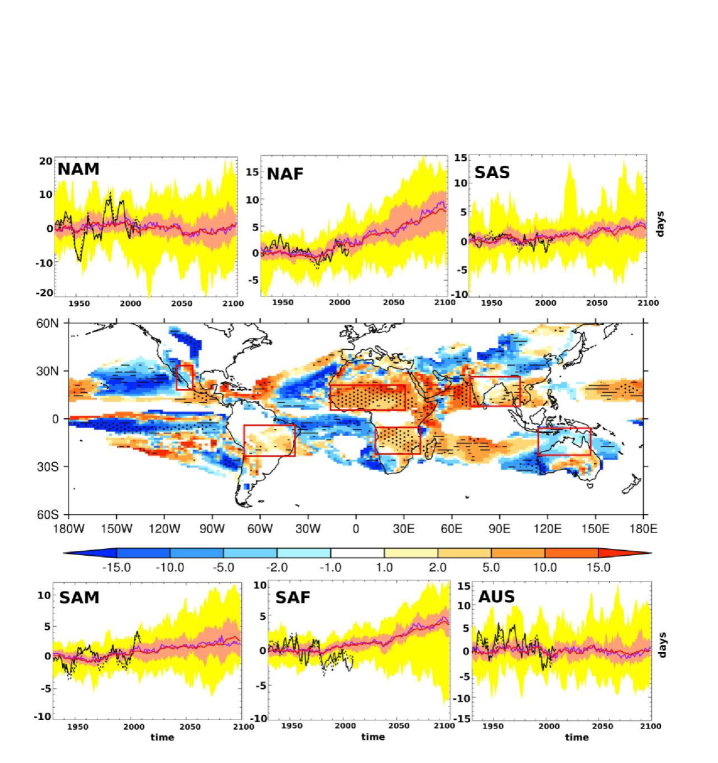
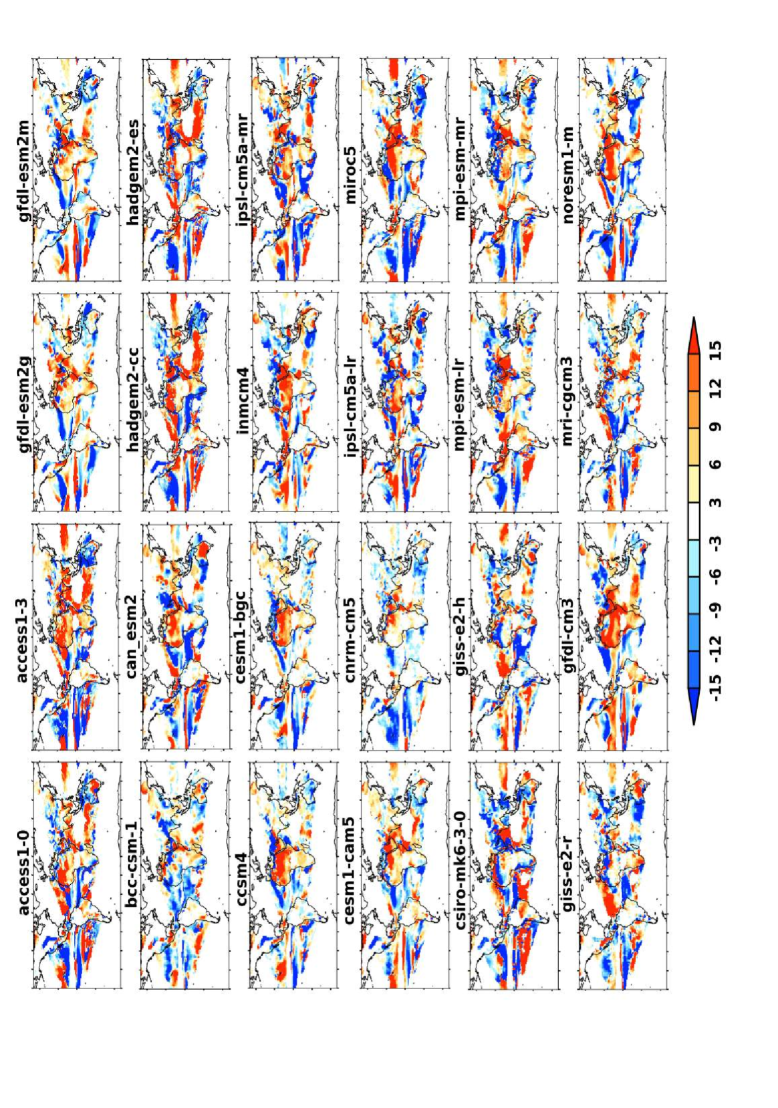
The MEM of the centroid changes (2080-2100 minus 1980-2000) are shown in Fig. 7 together with time series (1930-2100) of the centroid anomalies area-averaged over the six monsoonal regions defined in Table 2. Performances of the CMIP5 models contributing to the MEM (Table 1) are shown in Fig. 8. The pattern of projected changes is very heterogenous with large inter-model spread. However a robust signal emerges over tropical lands between and in both hemispheres, for which most of models project a positive . Patterns shown in Fig. 7 compare relatively well with that of Dwyer et al (2013), who estimated delays of the annual harmonic of the Fourier transform of rainfall data and through EOFs analysis.
In particular, more than of the GCMs indicate that the rainfall distribution associated with the African monsoons will shift from early to late during the wet season. Rainfall is projected to be redistributed from early to late in the NAF region and in East Africa, with delays ranging from three days in the southern part of its domain up to fifteen days in the Sahel (Biasutti and Sobel, 2009). A closer look at the NAF region reveals that the median of the area-averaged centroid anomalies will exceed the range of inter-model (Hist) and observational spread of days after year 2030.
The SAF monsoon season is also projected to be delayed by the end of the twenty-first century with high inter-model agreement (more than of the GCMs considered in this study), although the delay is less marked – three to six days – than its northern counterpart, with the median exceeding the inter-model range (during Hist) roughly after year 2050. Our results, indicating a delay and a shortening of the wet season in this region, are in agreement with those of Shongwe et al (2009), obtained with a different methodology and from CMIP3 models.
A moderate delay of two-three days is visible also over the SAM and SAS regions, although less significant. This late shift of the centroid is probably associated with a marked later retreat of the SAS monsoon discussed by Kitoh et al (2013). Over the SAS area, this signal is localized mostly over the east Arabian sea and west Indian coast with high inter-model agreement. Over the rest of the Indian region most of models still predict a delay, although the signal is not as robust as over west India, with a larger spread across models (Fig. 8) and with some (e.g. bcc-csm-1 or HadGEM2) predicting a late-to-early redistribution of rainfall.
A clear change over the NAM monsoonal region does not emerge from the analysis of centroid changes. There is a large disagreement among models, with about half of them indicating a delay and the other half an advance (note the multi-model median remaining unchanged) and with models projections featuring a very large spread ( days). Kitoh et al (2013)’s analysis, based instead on the determination of the monsoon onset and retreat, also found low agreement among models in the change of the onset ad retreat for the NAM monsoon, with no clear indication in a substantial delay. Nevertheless, more than of models agree on a positive change of the centroid just south of of the North American monsoon region at about N, which is an area not included in our definition of the NAM region (Table 2). This is consistent with the reduced Mexico and Caribbean precipitation in June and July and increased rainfall in September and October (Cook and Seager, 2013; Maloney et al, 2014). If this region is taken into account, RCP8.5 simulations indicate a delay for NAM wet season too, as discussed by previous authors (Grantz et al, 2007).
No substantial agreement among models is found over the AUS region, where roughly half of models suggest a delayed wet season and the other half an advanced we season, in agreement with Seth et al (2013). Kitoh et al (2013) analysis of onset and retreat dates changes suggests that this is due to an earlier onset and later retreat. As for the other seasonality indicators, models projections are difficult to interpret reliably over this region because of the large inter-model uncertainty.
5 Discussion and conclusions
We have examined the projected changes of rainfall seasonality and dry spell durations by the end of the twenty-first century under a high GHG emission scenario. The diagnostics employed in this study have been used to have observational evidence of changes of rainfall seasonality in the Tropics occurred during the last century (Feng et al, 2013) and to assess CMIP5 historical simulations (Pascale et al, 2014). This recently introduced approach relies on a probabilistic interpretation of rainfall fractions that allows us to coherently estimate circular statistics moments for the rainfall timing (e.g. the centroid) and threshold-independent, information theory-based quantities (RE and DSI) to quantify the timing and time concentration of annual rainfall and the number of dry and wet months. Here, for the first time, we have applied it to twenty-first century RCP8.5 scenario in order to assess how GHGs forcing is going to impact these major features of the large-scale precipitation.
In spite of model uncertainty and inter-model disagreement affecting the CMIP5 projections for precipitation, some coherent changes of rainfall seasonality in the Tropics have been identified with our methodology. Responses are quite different for each single monsoonal region (NAM, SAM, NAF, SAF, SAS, AUS) taken into account in our study. This indicates that the dynamical and thermodynamical mechanisms at play due to GHGs forcing are diverse for each monsoon regions (e.g. Nie et al, 2010; Cherchi et al, 2011).
Most of the examined models indicate a significant increase of RE by the end of the twenty-first century in areas featuring arid seasonal precipitation regimes such as tropical Southern Africa and Western Mexico and for wetter monsoonal regions like tropical Latin America (Fig. 3). According to models projections, these regions will also experience either a slight reduction or no significant changes in their annual rainfall amounts (Fig. 2). The implications of such projected changes in RE may be that drier and more prolonged dry seasons will be more likely in the SAF, SAM and NAM regions, with increased probability of drought as well as flood. This result agree fairly well with analysis of rainfall “monsoonality” projected changes for less extreme scenarios (RCP4.5, Lee and Wang, 2014).
Although of the examined models agree on increased annual totals of rainfall over the South Asian monsoon region (e.g. Turner and Annamalai, 2012), there is not the same inter-model agreement in projected RE changes and therefore in the projected changes of monthly rainfall fractions. Over North Australia instead, high inter-model disagreement for both RE and mean annual rainfall projections makes it impossible to have high confidence in model predictions for the twenty-first century over this region.
The extent of the global monsoon region (Wang and Ding, 2008; Wang et al, 2011), as characterized by RE and DSI, is projected to remain substantially unaltered by the end of the twenty-first century, despite the considerable projected changes in timing, duration and intensity. This result further supports previous results obtained with different criterions (Lee and Wang, 2014; Kitoh et al, 2013).
Concerning the rainfall timing, we have assessed through a centroid analysis how consistent is amongst CMIP5 models the projected time shift of the wet season in the Tropics under GHGs forcing (Seth et al, 2013; Cook and Seager, 2013; Sperber and Annamalai, 2014). We find that such a signal is particularly consistent across models over the monsoonal regions of North and South Africa with 22 out of 24 of the examined models predicting a delay and less consistent over South and North America monsoon regions, where only 17 out of 24 models agree on a forward shift. No coherent centroid delay is projected over North Australia and Asia, where models show very contradictory responses, thus making projections hard to be interpreted over these regions (Fig. 8).
The physical mechanisms behind these responses, and why they seem to occur more strongly in certain monsoonal regions than others, is not yet fully understood. While several possible links between the forward redistribution of monsoonal rainfall and global warming have been studied – spring inhibition (autumn enhancement) of convective activity due to increased (decreased) convective stability (“spring convective barrier”, Seth et al, 2011); change in the annual cycle of SSTs (Dwyer et al, 2013); poleward shift of midlatitude storm tracks (Scheff and Frierson, 2012); high-latitude SST phase delay owing to sea ice reduction impacting the tropics (Biasutti and Sobel, 2009; Dwyer et al, 2012) – the ultimate origin for such large scale changes of tropical rainfall seasonality are still unclear. Table 2 summarizes the findings of our analysis for the six monsoonal areas.
Regarding extratropical regions, projected positive changes of RE in subtropical semi-arid and Mediterranean-type regions are instead associated with an increase of the number of dry days in a year. Therefore more severe dry periods and floods may occur in these regions, according to CMIP5 projections. This tendency is particularly strong in southern Europe and along Mediterranean coasts, south Australia, south Africa, Central America and eastern Amazon (Fig. 5). Over these regions, the overall drop in mean annual precipitation, fairly robust across models, has been shown to be due the dry-day increase rather than changes in precipitation intensity (Polade et al, 2014). Interestingly, we note that in areas like Southwest U.S., southern Australia and western Europe the projected increase in dry days is consistent across models also in areas where no negative annual precipitation trend exist. This suggests a redistribution of the total annual rainfall into a smaller number of days. Therefore a greater precipitation intensity may be expected on wet days, with related enhanced flood risk and problems with water management. Our results are in good agreement with other studies that used a different threshold-base methodology in order to define a dry day or a dry month (Lau et al, 2013; Polade et al, 2014). More research is needed in the future to better characterize changes in the frequency of dry-day occurrence, their spatial patterns and time variability, particularly on the regional scale.
Acknowledgements.
The authors acknowledge the World Climate Research Programme s Working Group on Coupled Modeling, which is responsible for CMIP, and the NOAA, Boulder, Colorado, USA, for providing from their Web site the GPCC precipitation data. SP, VL and SH wish to acknowledge the financial support provided by the ERC-Starting Investigator Grant NAMASTE (Grant no. 257106) and by the CliSAP/Cluster of excellence in the Integrated Climate System Analysis and Prediction. AP gratefully acknowledges NSF Grants: NSF FESD 1338694, CBET 1033467, EAR 1331846, EAR 1316258 as well as the US DOE through the Office of Biological and Environmental Research, Terrestrial Carbon Processes program (DE-SC0006967), the Agriculture and Food Research Initiative from the USDA National Institute of Food and Agriculture (2011-67003-30222). XF acknowledges funding from the NSF Graduate Research Fellowship Program.| Number | Model name | Modelling Centre | Country | AGCM resolution (lonlat) |
| 1 | ACCESS1.0 | CAWCR | Australia | 192145/L38 |
| 2 | ACCESS1.3 | CAWCR | Australia | 192145/L38 |
| 3 | BCC-CSM1.1 | BCC | China | 12864/L26 |
| 4 | CanESM2 | CCCMA | Canada | 12864/L35 |
| 5 | CCSM4 | NCAR | USA | 288192/L26 |
| 6 | CESM1-BGC | NCAR | USA | 288192/L26 |
| 7 | CESM1-CAM5 | NCAR | USA | 288192/L30 |
| 8 | CNRM-CM5 | CNRM/CERFACS | France | 256128/L31 |
| 9 | CSIRO-Mk3.6.0 | CSIRO/QCCCE | Australia | 19296/L18 |
| 10 | GISS-E2-H | GISS | USA | 14490/L40 |
| 11 | GISS-E2-R | GISS | USA | 14490/L40 |
| 12 | GFDL-CM3 | GFDL | USA | 14490/L48 |
| 13 | GFDL-ESM2G | GFDL | USA | 14490/L24 |
| 14 | GFDL-ESM2M | GFDL | USA | 14490/L24 |
| 15 | HadGEM2-CC | MOHC | UK | 192145/L60 |
| 16 | HadGEM2-ES | MOHC | UK | 192145/L38 |
| 17 | INMCM4 | INM | Russia | 180120/L21 |
| 18 | IPSL-CM5A-LR | IPSL | France | 9695/L39 |
| 19 | IPSL-CM5A-MR | IPSL | France | 9695/L19 |
| 20 | MIROC5 | MIROC | Japan | 256128/L40 |
| 21 | MPI-ESM-MR | MPI-M | Germany | 19296/L95 |
| 22 | MPI-ESM-LR | MPI-M | Germany | 19296/L47 |
| 23 | MRI-CGCM3 | MRI | Japan | /L48 |
| 24 | NorESM1-M | NCC | Norway | 14496/L26 |
| a Centre for Australian Weather and Climate Research; b Beijing Climate Centre, China Meteorological Administration; c Canadian Centre for Climate Modelling and Analysis; d National Center for Atmospheric Research; e Centre National de Recherchers Meteorologiques/Centre Europeen de Recherche et Formation Avancees en Calcul Scientifique; f Commonwealth Scientific and Industrial Research Organization/Queensland Climate Change Centre of Excellence; g NASA Goddard Institute for Space Studies; h NOAA Geophysical Fluid Dynamics Laboratory; i Met Office Hadley Centre; j Institute for Numerical Mathematics; k Institute Pierre-Simon Laplace; l Atmosphere and Ocean Research Institute (The University of Tokyo), National Institute for Environmental Studies, and Japan Agency for Marine-Earth Science and Technology; m Max Planck Institute für Meteorologie; n Meteorological Research Institute ; o Norwegian Climate Centre | ||||
| Area | E | S | W | N | (mm/yr) | (days) | |
|---|---|---|---|---|---|---|---|
| SAF | E | S | W | S | |||
| NAF | W | S | E | N | |||
| SAS | E | N | E | N | |||
| AUS | E | S | E | N | |||
| SAM | W | S | W | S | |||
| NAM | W | N | W | N |
References
- Alessandri et al (2012) Alessandri A, Fogli PG, Vichi M, Zeng N (2012) Strengthening of the hydrological cycle in future scenarios: atmospheric energy and water balance perspective. Earth System Dynamics 3:199–212
- Allen and Ingram (2002) Allen MR, Ingram WJ (2002) Constraints on future changes in climate and the hydrological cycle. Nature 419:224–232
- Baker and Huang (2014) Baker NC, Huang HP (2014) A comparative study of precipitation and evaporation between CMIP3 and CMIP5 climate model ensembles in semiarid regions. J Climate 27:3731 – 3749
- Becker et al (2013) Becker E, Finger P, Meyer-Christoffer A, Rudolf B, Schamm K, Schneider U, Ziese M (2013) A description of the global land-surface precipitation data products of the global precipitation climatology centre with sample applications including centennial (trend) analysis from 1902-present. Earth Syst Sci Data 71:71–99
- Bengtsson et al (2006) Bengtsson L, Hodges KI, Roeckner E (2006) Storm tracks and climate change. Journal of Climate 19:3518 – 3543
- Biasutti and Sobel (2009) Biasutti M, Sobel A (2009) Delayed sahel rainfall and global seasonal cycle in a warmer climate. Geophysical research letters 36:L23,707, DOI 10.1029/2009GL041303
- Bony et al (2013) Bony S, Bellon G, Klocke D, Sherwood S, Fermepin S, Denvil S (2013) Robust direct effect of carbon dioxide on tropical circulation and regional precipitation. Nature Geoscience 6:447 – 551, DOI 10.1038/NGEO1799
- Boos and Hurley (2013) Boos WR, Hurley JV (2013) Thermodynamic bias in the multimodel mean boreal summer monsoon. J Climate 26:2279 – 2287
- Borchert (1994) Borchert R (1994) Soil and stem water storage determine phenology and distribution of tropical dry forest trees. Ecology 75:1437 – 1449
- Chadwick et al (2013) Chadwick R, Boutle I, Martin G (2013) Spatial patterns of precipitation change in CMIP5. J Climate 26:3803 – 3822
- Cherchi et al (2011) Cherchi A, Alessandri A, Masina S, Navarra A (2011) Effects of increased CO2 levels on monsoons. Climate Dynamics 37:83–101
- Chou et al (2009) Chou C, Neelin JD, Chen CA, Tu JY (2009) Evaluating the “rich-get-richer” mechanism in tropical precipitation change under global warming. J Climate 22:1982 – 2005
- Cook and Seager (2013) Cook BI, Seager R (2013) The response of the north american monsoon to increased greenhouse gas forcing. J Geophys Res 118:1690 – 1699
- Coumou and Rahmstorf (2012) Coumou D, Rahmstorf S (2012) A decade of weather extremes. Nature Climate Change 2:491–496
- Cover and Thomas (1991) Cover TM, Thomas JA (1991) Elements of Information Theory. Wiley-Interscience
- Dai et al (2004) Dai A, Lamb PJ, Trenberth KE, Hulme M, Jones P, Xie P (2004) The recent Sahel drought is real. Int J Climatology 24:1323 – 1331
- Dwyer et al (2012) Dwyer J, Biasutti M, Sobel A (2012) J Climate 25:6359 – 6374
- Dwyer et al (2013) Dwyer J, Biasutti M, Sobel A (2013) The effect of greenhouse-gas-induced changes in sst on the annual cycle of the zonal mean tropical precipitation. J Climate 27:4544–4565
- Eamus (1999) Eamus D (1999) Ecophysiological traits of deciduous and evergreen woody species in the seasonally dry tropics. Trends Ecol Evol 14:11 – 16
- Easterling (2000) Easterling DR (2000) Climate extremes: Observations, modeling, and impacts. Science 289:2068–2074
- Feng et al (2013) Feng X, Porporato A, Rodriguz-Iturbe I (2013) Changes in rainfall seasonality in the tropics. Nature Climate Change DOI 10.1038/nclimate1907
- Geil et al (2013) Geil KL, Serra YL, Zeng X (2013) Assessment of CMIP5 model simulations of the North American monsoon system. J Climate 26:8787 – 8801
- Giorgi and Lionello (2008) Giorgi F, Lionello P (2008) Climate change projections for the mediterranean region. Global and Planetary Change 63:90 – 104, DOI 10.1016/j.gloplacha.2007.09.005
- Goswami et al (2006) Goswami B, Venugopal V, Sengupta D, Madhusoodanan M, Xavier P (2006) Increasing trend of extreme rain events over india in a warming environment. Science 314:1442–1445, DOI 10.1126/science.1132027
- Grantz et al (2007) Grantz K, Rajagopalan B, Clark M, Zagona E (2007) Seasonal shifts in the north american monsoon. J Climate 20:1923 – 1935
- Guan et al (2014) Guan K, Wood EF, Medvigy D, Kimball J, Pan M, Caylor KK, Sheffield J, Xu X, Jones MO (2014) Terrestrial hydrological controls on land surface phenology of african savannas and woodlands. J Geophys Res Biogeosci 119:1652 – 1669, DOI 10.1002/2013JG002572
- Guilyardi et al (2013) Guilyardi E, Balaji V, Lawrence B, Callaghan S, Deluca C, Denvil S, Lautenschlager M, Morgan M, Murphy S, Taylor KE (2013) Documenting climate models and their simulations. Bull Amer Meteor Soc 94:623 – 627
- Harris et al (2013) Harris I, Jones PD, Osborn TJ, Lister DH (2013) Updated high-resolution grids of monthly climatic observations. Int J Climatol 34:623 642, DOI 10.1038/NGEO1744
- Hasson et al (2013) Hasson S, Lucarini V, Pascale S (2013) Hydrologycal cycle over south and southeast asian river basins as simulated by PCMDI/CMIP3 experiments. Earth System Dynamics 4:199–217
- Hasson et al (2014) Hasson S, Lucarini V, Pascale S, Böhner J (2014) Seasonality of the hydrologycal cycle in major south and southeast asian river basins as simulated by PCMDI/CMIP3 experiments. Earth System Dynamics 5:67–87, DOI 10.5194/esd-5-67-2014
- Held and Soden (2006) Held IM, Soden BJ (2006) Robust responses of the hydrological cycle to global warming. J Climate 19:5686–5699
- Hendon et al (2011) Hendon HH, Lim E, Wheeler MC (2011) Seasonal Prediction of Australian Summer Monsoon Rainfall. The Global Monsoon System: Research and Forecast (2nd Edition) edited by Chih-Pei Chang et al.
- Huang et al (2013) Huang P, Xie SP, Hu K, Huang G, Huang R (2013) Patterns of the seasonal response of tropical rainfall to global warming. Nature Geoscience 6:357 – 361
- IPCC (2013) IPCC (2013) IPCC Fifth Assessment Report: Working Group I Report ”The Physical Science Basis”. Cambridge University Press
- Jammalamadaka and Sengupta (2001) Jammalamadaka SR, Sengupta A (2001) Topics in circular statistics. World Scientific
- Kapnick and Delworth (2013) Kapnick SB, Delworth TL (2013) Controls of global snow under a changed climate. J Climate 26:5537 – 5562, DOI http://dx.doi.org/10.1175/JCLI-D-12-00528.1
- Kelley et al (2012) Kelley C, Ting M, Seager R, Kushnir Y (2012) Mediterranen precipitation climatology, seasonal cycle, and trend as simulated by CMIP5. Geophysical Research Letters 39:L21,703, DOI 10.1029/2012GL053416
- Kitoh et al (2013) Kitoh A, Endo H, Kumar KK, Cavalcanti IFA (2013) Monsoons in a changing world: a regional perspective in a global context. Journal of Geophysical Research 118:1–13
- Knutti (2013) Knutti R (2013) Robustness and uncertainties in the new CMIP5 climate model projections. Nature Climatic Change 3:369 – 373
- Kumar (2013) Kumar P (2013) Hydrology: Seasonal rain changes. Nature Climate Change 3:783 784, DOI 10.1038/nclimate1996
- Lau et al (2013) Lau WKM, Wu HT, Kim KM (2013) A canonical response of precipitation characteristics to global warming from CMIP5 models. Geophys Res Lett 40:3163 – 3169, DOI 10.1002/grl.50420
- Lee and Wang (2014) Lee JY, Wang B (2014) Future change of global monsoon in the CMIP5. Climate Dynamics 42:101 – 119
- Liebmann and Mechoso (2011) Liebmann B, Mechoso CR (2011) The South American Monsoon System. The Global Monsoon System: Research and Forecast (2nd Edition) edited by Chih-Pei Chang et al.
- Liepert and Lo (2013) Liepert BG, Lo F (2013) CMIP5 updates of “inter-model variability and biases of the global water cycle in CMIP3 coupled climete models”. Environmental Research Letters 8, DOI 10.1088/1748-9326/8/2/029401
- Liepert and Previdi (2012) Liepert BG, Previdi M (2012) Inter-model variability and biases of the global water cycle in CMIP3 coupled climete models. Environmental Research Letters 7:014,006, DOI 10.1088/1748-9326/7/1/014006
- Lin (2007) Lin JL (2007) The double-itcz problem in IPCC AR4 coupled GCMs: Ocean atmosphere feedback analysis. J Climate 20:4497 – 4525
- Liu et al (2014) Liu Z, Mehran A, Phillips TJ, AghaKouchak A (2014) Seasonal and regional biases in CMIP5 precipitation simulations. Climate Research 60:30–50, DOI 10.3354/cr01221
- Lucarini and Ragone (2011) Lucarini V, Ragone F (2011) Energetics of climate models: Net energy balance and meridional enthalpy transport. Rev Geophys 49:RG1001, DOI 10.1029/2009RG000323
- Lucarini et al (2008) Lucarini V, Danihlik R, Kriegerova I, Speranza A (2008) Hydrological cycle in the Danube basin in present-day and XXII century simulations by IPCCAR4 global climate models. J Geophys Res 113:D09,107, DOI 10.1029/2007JD009167
- Maloney et al (2014) Maloney ED, Camargo SJ, Chang E, Colle B, Fu R, Geil KL, Hu Q, Jiang X, Johnson N, Karnauskas KB, Kinter J, Kirtman B, Kumar S, Langenbrunner B, Lombardo K, Long LN, Mariotti A, Meyerson JE, Mo KC, Neelin JD, Pan Z, Seager R, Serra Y, Seth A, Sheffield J, Stroeve J, Thibeault J, Xie SP, Wang C, Wyman B, Zhao M (2014) North American climate in CMIP5 experiments: Part III: Assessment of 21st century projections. J Climate 27:2230 – 2270
- Meehl et al (2007) Meehl G, Stocker T, Collins W, Friedlingstein P, Gaye AT, Gregory JM, Kitoh A, Knutti R, Murphy JM, Noda A, Raper SCB, Watterson IG, Weaver AJ, Zhao ZC (2007) IPCC Climate Change 2007: The physical science basis. eds. S. Solomon et al., Cambridge Univ. Press, pp 747–846
- Mehran et al (2014) Mehran A, AghaKouchak A, Phillips TJ (2014) Evaluation of CMIP5 continental precipitation simulations relative to satellite-based gauge-adjusted observations. Journal of Geophysical Research 119:1695 – 1707, DOI 10.1002/2013JD021152
- Mehta and Yang (2008) Mehta AV, Yang S (2008) Precipitation climatology over Meditarranean basin from ten years of TRMM measurements. Adv Geosci 17:87 – 91
- Meinshausen et al (2011) Meinshausen M, Smith SJ, Calvin K, Daniel JS, Kainuma MLT, Lamarque JF, Matsumoto K, Montzka SA, Raper SCB, Riahi K, Thomson A, Velders GJM, van Vuuren DP (2011) The RCP greenhouse gas concentrations and their extensions from 1765 to 2300. Climatic Change 109:213–241, DOI 10.1007/s10584-011-0156-z
- Moss et al (2010) Moss R, Edmonds J, Hibbard K, Manning M, Rose S, van Vuuren D, Carter T, Emori S, Kainuma M, T TK, Meehl G, Mitchell J, Nakicenovic N, Riahi K, Smith S, RJ RS, Thomson A, Weyant J, Wilbanks T (2010) The next generation of scenarios for climate change research and assessment. Nature 463:747 – 756
- Nie et al (2010) Nie J, Boos WR, Kuang Z (2010) Observational evaluation of a convective quasi-equilibrium view of monsoons. J Climate 23:4416 – 4428
- Palazzi et al (2013) Palazzi E, von Hardenberg J, Provenzale A (2013) Precipitation in the Hindu-Kush Karakoram Himalaya: Observations and future scenarios. J Geophys Res Atmos 118:85 – 100, DOI 10.1029/2012JD018697.
- Pascale et al (2014) Pascale S, Lucarini V, Feng X, Porporato A, Hasson S (2014) Analysis of rainfall seasonality from observations and climate models. Climate Dynamics DOI 10.1007/s00382-014-2278-2
- Polade et al (2014) Polade SD, Cayan DWPDR, Gershunov A, Dettinger MD (2014) The key role of dry days in changing regional climate and precipitation regimes. Sci Rep 4:4364, DOI 10.1038/srep04364
- Ren et al (2013) Ren L, Arkin P, Smith TM, Shen S (2013) Global precipitation trends in 1900-2005 from reconstructions and coupled model simulations. Journal of Geophysical Research 118:1679–1689
- Riahi et al (2011) Riahi K, Rao S, Krey V, Cho C, Chirkov V, Fidcher G, Kindermann G, Nakicenovic N, Rafaj P (2011) RCP8.5 – a scenario of comparatively high greenhouse gas emissions. Climatic Change 109:33 – 57
- Roehrig et al (2013) Roehrig R, Bouniol D, Guichard F, Hourdin F, Redelsperger JL (2013) The present and future of the West African Monsoon: A process-oriented assessment of CMIP5 simulations along the AMMA transect. J Climate 26:6471 – 6505
- Rohr et al (2013) Rohr T, Manzoni S, Feng X, Menezes RSC, Porporato A (2013) Effect of rainfall seasonality on carbon storage in tropical dry ecosystems. J Geophys Res Biogeosci 118:1156 – 1167, DOI 10.1002/jgrg.20091
- Sabeerali et al (2014) Sabeerali CT, Suryachandra AR, Dhakate AR, Salunke K, Goswami BN (2014) Why ensemble mean projection of south Asian monsoon rainfall by CMIP5 models is not reliable? Climate Dynamics DOI 10.1007/s00382-014-2269-3
- Scheff and Frierson (2012) Scheff J, Frierson DMW (2012) Robust future precipitation declines in CMIP5 largely reflect the poleward expansion of model subtropical dry zone. Geophys Res Lett 39:L18,704, DOI 10.1029/2012GL052910
- Schneider et al (2013) Schneider U, Becker E, Finger P, Meyer-Christoffer A, Ziese M, Rudolf B (2013) GPCC’s new land surface precipitation climatology based on quality-controlled in situ data and its role in quantifying the global water cycle. Theoretical and Applied Climatology 115(1-2):15–40, DOI 10.1007/s00704-013-0860-x
- Seager et al (2010) Seager R, Naik N, Vecchi G (2010) Thermodynamic and dynamic mechanisms for large-scale changes in the hydrological cycle in response to global warming. Journal of Climate 23:4651–4668
- Seager et al (2013) Seager R, Ting M, Li C, Naik N, Cook B, Nakamura J, Liu H (2013) Projections of declining surface-water availability for the southwestern united states. Nature Climate Change 3:482–486
- Seth et al (2011) Seth A, Rauscher S, Rojas M, Giannini A, Camargo SJ (2011) Enhanced spring convective barrier for monsoons in a warmer climate? Climatic Change 104:403 – 414
- Seth et al (2013) Seth A, Rauscher SA, Biasutti M, Giannini A, Camargo SJ, Rojas M (2013) CMIP5 projected changes in the annual cycle of precipitation in monsoon regions. J Climate 26:7328 – 7351
- Sheffield et al (2013) Sheffield J, Barrett AP, Colle B, Fernando DN, Fu R, Geil KL, Hu Q, Kinter J, Kumar S, Langenbrunner B, Lombardo K, Long LN, Maloney E, Mariotti A, Meyerson JE, Mo KC, Neelin JD, Nigam S, Pan Z, Ren T, Ruiz-Barradas A, Serra YL, Seth A, Thibeault JM, Stroeve JC, Yang Z, Yin L (2013) North American climate in CMIP5 experiments. Part I: Evaluation of historical simulations of continental and regional climatology. J Climate 26:9209 – 9245
- Shepherd (2014) Shepherd TG (2014) Atmospheric circulation as a source of uncertainty in climate change projections. Nature Geoscience DOI doi:10.1038/ngeo2253
- Shongwe et al (2009) Shongwe ME, van Oldenborgh GJ, van den Hurk BJJM, de Boer B, Coelho CAS, van Aalst MK (2009) Projected changes in mean and extreme precipitation in Africa under global warming. Part I: Southern Africa. J Climate 22:3819 – 3837
- Sperber and Annamalai (2014) Sperber KR, Annamalai H (2014) The use of fractional accumulated precipitation for the evaluation of the annual cycle of monsoons. Climate Dynamics DOI 10.1007/s00382-014-2099-3
- Sperber et al (2013) Sperber KR, Annamalai H, Kang IS, Kitoh A, Moise A, Turner A, Wang B, Zhou T (2013) The asian summer monsoon: an intercomparison of CMIP5 vs. CMIP3 simulations of the late 20th century. Climate Dynamics 41:2711–2744
- Taylor et al (2012) Taylor KE, Stouffer RJ, Meehl GA (2012) An overview of CMIP5 and the experiment design. Bull Amer Meteor Soc 93:485–498
- Tebaldi and Knutti (2007) Tebaldi C, Knutti R (2007) The use of the multi-model ensemble in probabilistic climate projections. Phil Trans R Soc A 365:2063 – 2075, DOI 10.1098/rsta.2007.2076
- Trenberth et al (2000) Trenberth KE, Stepaniak DP, Caron JM (2000) The global monsoon as seen through the divergent atmospheric circulations. J Climate 13:3969 – 3993
- Turner and Annamalai (2012) Turner A, Annamalai H (2012) Climate change and the South Asian summer monsoon. Nature Climate Change 2:587–595
- Van Vuuren et al (2011) Van Vuuren DP, Edmonds J, Kainuma M, Riahi K, Thomson A, Hibbard K, Hurtt GC, Kram T, Krey V, Lamarque JF, Masui T, Meinshausen M, Nakicenovic N, Smith SJ, Rose SK (2011) The representative concentration pathways: an overview. Climatic Change 109:5–31
- Wang and Ding (2008) Wang B, Ding Q (2008) Global monsoon: dominant mode of annual variation in the tropics. Dynamics of Atmospheres and Oceans 44:165 – 183
- Wang et al (2011) Wang B, Kim HJ, Kikuchi K, Kitoh A (2011) Diagnostic metrics for evaluation of annual and diurnal cycles. Climate Dynamics 37:941–955
- Wentz et al (2007) Wentz F, Ricciardulli L, Hilburn K, Mears C (2007) How much more rain will global warming bring? Science 317:233 235
- Wilcox et al (2013) Wilcox L, Highwood E, Dunstone N (2013) The influence of anthropogenic aerosol on multi-decadal variations of historical global climates. Environ Res Lett 8:024,033, DOI 10.1088/1748-9326/8/2/024033
- Xie et al (2003) Xie P, Janowiak JE, Arkin PA, Adler R, Gruber A, Ferraro R, Huffman GJ, Curtis S (2003) GPCP pentad precipitation analyses: an experimental dataset based on gauge observations and satellite estimates. J Climate 16:2197 – 2214