High-Sensitivity Temperature Sensing Using an Implanted Single Nitrogen-Vacancy Center Array in Diamond
Abstract
We presented a high-sensitivity temperature detection using an implanted single Nitrogen-Vacancy center array in diamond. The high-order Thermal Carr-Purcell-Meiboom-Gill (TCPMG) method was performed on the implanted single nitrogen vacancy (NV) center in diamond in a static magnetic field. We demonstrated that under small detunings for the two driving microwave frequencies, the oscillation frequency of the induced fluorescence of the NV center equals approximately to the average of the detunings of the two driving fields. On basis of the conclusion, the zero-field splitting D for the NV center and the corresponding temperature could be determined. The experiment showed that the coherence time for the high-order TCPMG was effectively extended, particularly up to 108 for TCPMG-8, about 14 times of the value 7.7 for thermal Ramsey method. This coherence time corresponded to a thermal sensitivity of 10.1 mK/Hz1/2. We also detected the temperature distribution on the surface of a diamond chip in three different circumstances by using the implanted NV center array with the TCPMG-3 method. The experiment implies the feasibility for using implanted NV centers in high-quality diamonds to detect temperatures in biology, chemistry, material science and microelectronic system with high-sensitivity and nanoscale resolution.
In recent years some thermal detection techniques have been developed to map temperature distribution with spatial resolution down to micrometer-nanometer rangekey-1 , such as Raman spectroscopykey-1 ; key-2 , fluorescence thermographykey-1 ; key-3 , and scanning thermal microscopy.key-4 However, such techniques are reported with limitations like low sensitivitykey-1 ; key-2 and large random errors come from fluorescence rate fluctuations or fluorescence blinking and bleaching in the local environment.key-1 ; key-2 ; key-3 Recently the negatively charged nitrogen vacancy (NV-) center in diamond key-5 ; key-6 ; key-7 ; key-8 ; key-9 ; key-10 and the spin defects in silicon carbide key-11 are investigated as promising nanoscale temperature sensors with both high temperature precision and high spatial resolution.key-8 ; key-9 ; key-10
The NV center is a spin defect consisting of a substitutional nitrogen impurity adjacent to a carbon vacancy in diamond. It has increasingly attracted attention in recent years owing to its excellent properties, like photostability, biocompatibility, chemical inertness, and long spin coherence and relaxation times (ms in the isotopically pure diamond) at room temperature. These remarkable properties have been explored in many applications like quantum information processing,key-12 ; key-13 ; key-14 ; key-15 ; key-16 metrologies such as magnetic field sensing,key-17 ; key-18 ; key-19 electric field sensing,key-20 ; key-21 force sensing,key-22 ; key-23 thermal sensing,key-8 ; key-9 ; key-10 single electron and nuclear spin sensing,key-24 ; key-25 ; key-26 and external nuclear spin sensing.key-27 ; key-28 In thermal sensing, Neumann et al. demonstrated the measurement of the temperature distribution on a glass coverslip using single NV center nanodiamonds as temperature sensors.key-9 However, the thermal sensitivity was unsatisfactory due to the short coherence time. To address the short coherence time issue, Toyli et al. proposed the thermal Carr-Purcell-Meiboom-Gill (TCPMG) method and extended the spin coherence time up to 17 by TCPMG-2.key-8
For further increasing the spin coherence time for the thermometry, in this work, we firstly studied the effects of the higher order TCPMG method applied on the implanted single NV centers in diamond at room temperature. In particular, a coherence time of 108 was obtained for TCPMG-8, about 14 times of the value 7.7 for Thermal Ramsey (T-Ramsey) method. This value corresponded to a thermal sensitivity of 10.1 mK/Hz1/2, which was comparable with that of the native NV center in isotopically pure diamond.key-9 ; key-10 Then we measured the temperature distribution on the surface of a high-purity diamond in three different circumstances by performing the TCPMG-3 pulse sequence measurement on the implanted NV center array. The obtained thermal sensitivity reached 24 mK/Hz1/2. The results demonstrate that the TCPMG method can effectively extend the spin coherence time of the implanted NV center, which paves the way for using the implanted NV center in high-quality nanodiamondskey-29 to practical temperature detection with nanoscale resolution and high-sensitivity.
The ground state of the NV- is a spin triplet (), consisting three spin projection states and , which are split under spin-spin interactions, exhibiting a zero-field splitting D=22.87 GHz at room temperature. The spin states can be spin polarized and read out optically, and coherently controlled by microwave pulses. The principle of temperature detection using NV center is based on the temperature dependence of the zero-field splitting D, which depends on the local lattice expansion induced by the temperature variation.key-5 ; key-6 ; key-7 In particular, as has been reported, the value of D is linearly dependent on the temperature with dD/dT = -74.2 kHz/K at the temperature from 280 K to 330 K.key-5
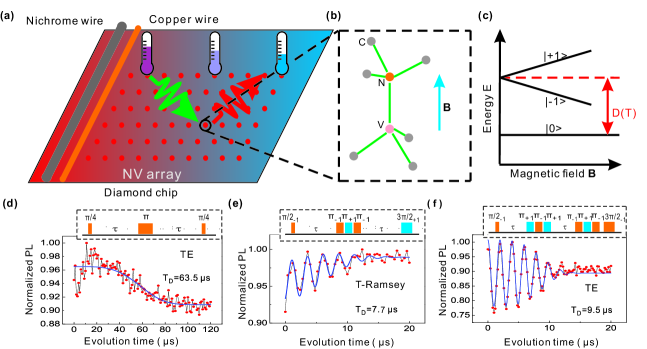
The scheme of the NV thermometry setup in our experiments was shown in Figure 1 (a). The implanted NV center array in the high-purity diamond was used to sense local temperature on the diamond surface layer. The wavy green arrow represented the 532-nm optical excitation laser which was used to polarize and read out the NV center spin states, and the wavy red arrow represented the emitted fluorescence of the NV center. A 20 copper wire was placed on the diamond for transmitting microwave to manipulate the spin states of the NV center and a 40 Nichrome wire placed beside the copper wire was heated by a precision DC power source for sample temperature control. An electromagnet generated a 32 G magnetic field for experiments in magnetic field.
The sample was a mm3 (100) high-quality electronic grade diamond with natural isotopic concentration of 13C (1.1%) from Element Six ([N] < 5 ppb). The NV center array was made by implanting 60 keV molecules with the fluence and the implantation angle through 45 nm diameter apertures patterned using electron beam lithography in a 300-nm-thick polymethyl methacrylate (PMMA) layer deposited on diamond surface.key-30 The average depth of the NV centers was about 40 nm and the longitudinal and lateral straggling were about 11 and 9 nm, respectively, inferred from SRIM simulations. After implantation, the sample was annealed at 1050 ℃ in a vacuum at Pa for 2 h to induce vacancy diffusion to form NV centers. Annealing at this temperature could also reduce the total concentrations of the paramagnetic residual defects to extend spin coherence times.key-31 After oxidation at 430 ℃ in atmosphere for 2.5 h for improving negatively charged NV centers conversion efficiency, the sample was cleaned in a 1:1:1 boiling mixture of sulfuric, nitric, and perchloric acid at 200 ℃ for one hour. The irradiation dose used for NV center generation corresponded to about 5 nitrogen atoms per aperture (45 nm diameter), so it was thought that the spin bath for the NV center was mainly contributed by in the diamond. In such a system, the Hamiltonian of NV center can be expressed as key-8
| (1) |
where is the NV center’s electronic spin, g = 2.00 is the electron g factor, is the Bohr magneton, is the applied magnetic field. The third term describes hyperfine coupling of the NV center spin to the bath of spins, and the last term describes the internal dynamics of the nuclear spin bath. In general, the zero-field splitting parameter D(T) depends on temperature T, axial electric field, and strain. For temperature detection based on D(T), we resonantly manipulate the spin states such that the unwanted relative phase are canceled, getting the common phase factor , with the phase proportional to D only. This detection produces a fluorescence intensity () oscillating between () and () with the frequency given by , where is the microwave carrier frequencies used for spin manipulation.key-8 When the change of oscillation frequency is determined, the change of D and hence the corresponding local temperature change can be deduced.
At zero magnetic field, by applying a thermal echo (TE) pulse sequencekey-8 ; key-10 , as shown in Figure 1(d), the electronic spin of the NV center was firstly initialized to a superposition state by a pulse. After half the total evolution time, a echo pulse was used to reverse the population of the and states. After another half of the total free evolution time, the relative phases between the levels, caused by quasi-static fluctuations of magnetic field, were canceled, getting the common phase factor , with the phase proportional to D. The TE sequence produced a long coherence time of 63.5 , which was comparable with that of the native NV center in high-quality diamond.key-8 However, there was not significant oscillations when we detuned the microwave carrier frequencies () from D. This result was confirmed by using other implanted single NV centers in the sample. This was attributed to the implanted N electron spin defects and the paramagnetic residual structure defects.key-8 ; key-10 ; key-32 It was concluded that the TE method at zero magnetic fieldkey-8 ; key-10 was difficult to be used on the implanted NV center for temperature sensing.
Then we applied the thermal Ramsey (T-Ramsey), TE, and TCPMG-N methods to the implanted NV centers for temperature sensing under finite magnetic fields. In these experiments, two microwave radiation fields with different frequencies and , in general, are used to manipulate the transitions of and , respectively. To induce oscillations in , both the microwave carrier frequencies are slightly detuned from the corresponding resonance frequencies. The as a function of the free evolution time t follows the equationkey-8
| (2) |
where a, n, and b are free parameters, is the thermal pulse sequences coherence time. It is proved that the oscillations frequency (see Supporting Information). So we can deduce the coherence time and oscillation frequency (hence the zero-field splitting D) by fitting the recorded to Eq. 2.
For the T-Ramsey experiment as shown in Figure 1(e)key-9 , the spin was firstly initialized into a superposition state by a pulse. After half of the total evolution time, a triple echo pulse sequence of the form was applied to swap the population of the and states, where the and were the -pulses applied to manipulate the and transition, respectively.key-8 ; key-9 After another half the total evolution time, the relative phases between the and states were canceled, getting a total phase factor , which was only related to D, independent of low-frequency magnetic noise. We got a coherence time of 7.7 for the T-Ramsey sequence, which was larger than the values of 1–5 for nanodiamonds.key-9 The reason was that, for nanodiamonds, the spin bath contains nuclear spins (), high concentration of electron spins ([N] about 100ppm), and surface layer spins.key-32 ; key-33
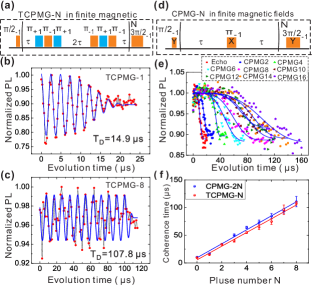
For the TE (Figure 1(f)) and TCPMG-N experiments (Figure 2(a)), the working principles are similar to that of the T-Ramsey experiment .key-8 The key difference between TE and TCPMG-N is that the TCPMG-N experiments invert the spin more frequently (2N times) and hence more effectively eliminate higher frequency magnetic noise, thus can extend the spin coherence time for thermometry.key-8 By fitting the experimental resultsof the TE and TCPMG-N to the Eq. (2), the coherence times for thermometry were derived. The coherence time of the TE measurement was 9.5 , which was close to a value of 10.5 obtained from the spin echo experimentkey-8 (Figure 2(e)). The TCPMG-1 (Figure 2(b)) and TCPMG-8 (Figure 2(c)) experiments extended the coherence time to 14.9 and 107.8 , respectively. The coherence time of TCPMG-8 was about fifteen times longer than that of the T-Ramsey. Utilizing the obtained experimental data, the corresponding thermal sensitivity of the NV center can be derived from the following equationkey-8
| (3) |
where and are the photon counts per measurement shot for the bright and dark spin states, respectively. In the experiments, we used the oil objective (NA = 1.4) and the obtained and values were about 0.029 and 0.02, respectively. Thus derived thermal sensitivity of the TCPMG-8 was 10.1 mK/Hz1/2, which was comparable with that of the native NV center in isotopically pure diamond.key-9 ; key-10
Furthermore, the TCPMG method was compared with the conventional CPMG method. In the CPMG-N experiments, as illustrated in Figure 2(d), the microwave pulse phases of the beginning and the final pulses were Y phases, while the phases of the echo pulses were X phases.key-34 The coherence times obtained in the CPMG-N experiments were increasing with the pulse number N, and, in particular, the of the CPMG-16 was 110.8 , about ten times longer than the value 10.5 for the Hahn echo. Considering the fact that there are two triple pulses in a period of TCPMG, it would be more reasonable to compare TCPMG-N with CPMG-2N. Figure 2(f) showed the obtained dependence of the coherence times for these two methods with the number N. It was found that in both cases the coherence times increased almost linearly with N. This phenomenon of the CPMG was similar to that for the native NV center in high-purity diamond,key-34 but different from the dependence in low-purity diamond.key-35 It was also noted that the coherence times of TCPMG-N were a little shorter than that in the CPMG-2N, which might be caused by the pulse imperfections, including pulse length, frequency imperfection, and power fluctuation, since the TCPMG sequences were composed with more microwave pulses.
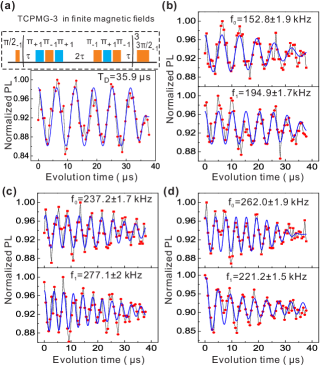
Then, we discussed, in more detail, the temperature detection through measuring the changes in the oscillation frequency by applying TCPMG-3 on implanted NV centers. In Figure 3(a), the upper part showed the pulse sequence of TCPMG-3 and the bottom part showed the results of the TCPMG-3 measurement on a NV center. The coherence time and the oscillation frequency, obtained from fitting the results to Eq. (2), were 159.0 1.0 kHz and 35.9 1.2 , respectively. In the experiments, we used the dry objective (NA = 0.9) and the obtained and values were 0.022 and 0.017, respectively. The corresponding thermal sensitivity was derived from Eq.(3) to be 24 mK/Hz1/2, which was about 6 times improvement in comparison with that for the single NV center nanodiamonds.key-9 Furthermore, the relation between the change of the oscillation frequency and the microwave frequency detunings was examined. Figure 3(b,c,d) showed the results for the sample both with and without heating, obtained under three different detunings but the same heating condition. As shown in Figure 3(b) and 3(c), the changes of oscillation frequency of the two different positive detunings (both of the microwave carrier frequencies were larger than the corresponding resonance frequencies), were 42.12.5 kHz and 39.92.6kHz, respectively, while for the negative detuning (both of the microwave carrier frequencies were less than the corresponding resonance frequencies), it was 40.82.4 kHz (see Figure 3(d)). It could be seen that the changes of the oscillation frequency were nearly the same. This result indicated that the change in oscillation frequency depends only on the change in temperature, regardless of the microwave frequencies. This was consistent with the theory described by Eq. (2). Using the standard error derived from the fitting, we estimated that the temperature precision was about 34 mK.

To demonstrate detection of temperature distribution, the implanted NV center array in the surface layer of a diamond chip was used, with which the corresponding local temperatures were measured using TCPMG-3. Figure 4(a) shows the confocal microscope fluorescence image of an area of the sample with an implanted single NV center array in its surface layer. The nearest separation of two NV centers was 2 . The larger bright specks in the image were NV center clusters formed during the implantation due to imperfect PMMA templet layer deposited on the diamond chip. The sample was equipped with a Nichrome wire heater, which was situated above the diamond surface (Figure 1(a)) and arranged parallel to the Y axis. Five single NV centers (named NV-AE in Figure 4(a)) with their axes parallel to the external magnetic field were selected to detect the local temperatures in the diamond surface layer. For all the five NV centers, the coherence time of the TCPMG-3 were about 35 . In the experiment the sample was situated in air or in oil (Nikon microscope immersion oil). Firstly, we detected the temperatures at four positions in the surface layer of the diamond chip in air (Nichrome wire was placed 15 above the surface of the diamond chip). Figure 4 (b) showed the local temperatures detected by the NV-D (273 away from the Nichrome wire) at various DC heating powers. It could be seen that the temperature increased sharply at the beginning when the heating power was low, then linearly increased as the DC heating power increased. The sharp increase at the beginning might be due to that the heat dissipation to the environment was less remarkable as the temperature difference between the sample and the surroundings was small at low heating power. On the other hand, as shown in Figure 4(c), under each DC heating power, the temperatures measured via four NV centers located at different distances from the Nichrome wire were almost the same, even for an NV center 100 away from the Nichrome wire. This result can be ascribed to the high thermal conductivity of the diamond (about 2000 W/mK). The similar result was obtained by using the same NV-D (289 away from the Nichrome wire, Nichrome wire 23 above the surface of the diamond chip) with the diamond chip in oil (red points in Figure 4(d)), except that the rate of the temperature variation for sample in oil was less than that in air (green points). The temperatures of the five single NV centers at different distances from the Nichrome wire for the sample in oil (Figure 4(e)) were also almost the same under the same DC powers, similar to the case of the sample in air.

Finally, we detected the temperature distribution on the surface layer of the sample in air, but with a heat sink added on the other side of the sample (Figure 5 (a)). The heat sink, a copper wire, was in thermally contacted with a stable heat bath of a temperature 0 ℃. The Nichrome heating wire was 20 above the surface of the diamond chip. To detect the temperature distribution on the sample surface, nine single NV centers (named NV-AI, as shown in Supporting Information Fig 3 and Fig 4) were selected to detect the temperatures at the corresponding local positions. The axes of all the nine NV centers were parallel to the magnetic field and the coherence times measured with TCPMG-3 for these centers were about 35 . Figure 5(b) presented a typical DC power dependence of the temperature recorded by NV-E (76 away from the Nichrome wire), showing a relationship similar to that for sample without the heat sink. Furthermore, Figure 5(c) showed the temperatures measured by using four single NV centers, NV-AD, that were located at about the same distance (about 96 ) away from the Nichrome wire from the Nichrome wire with a DC heating power of 20.66 mw. Obviously the temperatures were almost the same, which was in accordance with the geometry of these NV centers: the same distance from the heating wire. However, as shown in Figure 5(d), the temperatures varied along the perpendicular direction, as represented by temperatures of the five single NV centers, NV-EI, at different distances to the Nichrome wire that was heated with a DC power of 21.15 mw. According to the steady-state heat conduction equation, the temperature profile on the diamond surface layer follows the expression , where a, b are free parameters, is the heat flux, and is the thermal conductivity of diamond and r is the distance between the NV center and the Nichrome wire. It can be seen from the figure that the experimental data was fitted very well with the expression. The experiments showed the effectiveness of the TCPMG method for high-sensitivity temperature detection when performed on the implanted NV centers in high-purity diamond.
In summary, we studied thermometry based on the implanted single nitrogen vacancy (NV) center in diamond by using the TCPMG method in a static magnetic field. It was demonstrated that the spin coherence time for thermometry was extended up to 108 for TCPMG-8, which was around 14 times of the value for T-Ramsey method (7.7 ). This value corresponds to a thermal sensitivity 10.1 mK/Hz1/2, which was comparable with that for the isotopically pure diamond.key-9 ; key-10 We measured the temperature distributions on the diamond chip surface in three different circumstances using the TCPMG-3 pulse sequence on the implanted NV center array. The achieved thermal sensitivity was 24 mK/Hz1/2, which was about 6 times improvement in comparison with that for the single NV center nanodiamonds.key-9 The experiment implies the feasibility for using implanted NV centers in high-quality diamonds to detect temperatures with high-sensitivity.
It is expectable that using higher order TCPMG, isotopically pure diamond and technique of higher photon collection efficiency, such as solid immersion lenses,key-36 the thermal sensitivity can be further improved to submK/Hz1/2. Combining the TCPMG method and the implanted NV center in high-purity nanodiamonds,key-29 high performance temperature sensors with higher precision, nanoscale spatial resolution, outstanding sensor photostability and chemical inertness can be constructed, which can be applied to nanoscale temperature detection in a wide variety of systems, including biology,key-10 chemistry, material science and microelectronics systems. The TCPMG thermometry could also be applied to other solid-state quantum spin systems such as point defects in silicon carbidekey-11 ; key-37 for temperature sensing.
ACKNOWLEDGMENTS
We thank Qi Zhang, Fazhan Shi, Pengfei Wang, Jinming Cui, Zhaojun Gong and Jie You for their help in building the experiment setup and making the sample. We also thank Lei Zhou for his help in the preparation of this paper. This work was supported by the National Basic Research Program of China (2013CB921800, 2011CB921400) and the Natural Science Foundation of China (Grant Nos. 11374280, 50772110).
References
- (1) Brites, C. D. S.; Lima, P. P.; Silva, N. J. O.; Millan, A.; Amaral, V. S.; Palacio, F.; Carlos, L. D. Nanoscale 2012, 4, 4799.
- (2) Balandin, A. A.; Ghosh, S.; Bao, W. Z.; Calizo, I.; Teweldebrhan, D.; Miao, F.; Lau, C. N. Nano Lett. 2008, 8, 902.
- (3) Walker, G. W.; Sundar, V. C.; Rudzinski, C. M.; Wun, A. W.; Bawendi, M. G.; Nocera, D. G. Appl. Phys. Lett. 2003, 83, 3555.
- (4) Majumdar, A. Annu. Rev. Mater. Sci. 1999, 29, 505.
- (5) Acosta, V. M.; Bauch, E.; Ledbetter, M. P.; Waxman, A.; Bouchard, L. S.; Budker, D. Phys. Rev. Lett. 2010, 104, 070801.
- (6) Chen, X. D.; Dong, C. H.; Sun, F. W.; Zou, C. L.; Cui, J. M.; Han, Z. F.; Guo, G. C. Appl. Phys. Lett. 2011, 99, 161903.
- (7) Toyli, D. M.; Christle, D. J.; Alkauskas, A.; Buckley, B. B.; Van de Walle, C. G.; Awschalom, D. D. Phys. Rev. X 2012, 2, 031001.
- (8) Toyli, D. M.; de Las Casas, C. F.; Christle, D. J.; Dobrovitski, V. V.; Awschalom, D. D. Proc. Natl. Acad. Sci. U.S.A. 2013, 110, 8417.
- (9) Neumann, P.; Jakobi, I.; Dolde, F.; Burk, C.; Reuter, R.; Waldherr, G.; Honert, J.; Wolf, T.; Brunner, A.; Shim, J. H.; Suter, D.; Sumiya, H.; Isoya,J.; Wrachtrup, J. Nano Lett. 2013, 13, 2738.
- (10) Kucsko, G.; Maurer, P. C.; Yao, N. Y.; Kubo, M.; Noh, H. J.; Lo, P. K.; Park, H.; Lukin, M. D. Nature 2013, 500, 54.
- (11) Kraus, H.; Soltamov, V. A.; Fuchs, F.; Simin, D.; Sperlich, A.; Baranov, P. G.; Astakhov, G. V.; Dyakonov, V. Sci. Rep. 2014, 4, 5303.
- (12) Jelezko, F.; Gaebel, T.; Popa, I.; Domhan, M.; Gruber, A.; Wrachtrup J. Phys. Rev. Lett. 2004, 93, 130501.
- (13) Dutt, M. V. G.; Childress, L.; Jiang, L.; Togan, E.; Maze, J.; Jelezko, F.; Zibrov, A. S.; Hemmer, P. R.; Lukin, M. D. Science 2007, 316, 1312.
- (14) Neumann, P.; Mizuochi, N.; Rempp, F.; Hemmer, P.; Watanabe, H.; Yamasaki, S.; Jacques, V.; Gaebel, T.; Jelezko, F.; Wrachtrup, J. Science 2008, 320, 1326-1329.
- (15) Shi, F. Z.; Rong, X.; Xu, N. Y.; Wang, Y.; Wu, J.; Chong, B.; Peng, X. H.; Kniepert, J.; Schoenfeld, R. S.; Harneit, W.; Feng, M; Du, J. F. Phys. Rev. Lett. 2010, 105, 040504.
- (16) Waldherr, G.; Wang, Y.; Zaiser, S.; Jamali, M.; Herbruggen, T. S.; Abe, H.; Ohshima, T.; Isoya, J.; Du, J. F.; Neumann, P.; Wrachtrup, J. Nature 2014, 461, 1.
- (17) Taylor, J. M.; Cappellaro, P.; Childress, L.; Jiang, L.;Budker, L. D.; Hemmer, P. R.; Yacoby, A.; Walsworth, R.; Lukin, M. D. Nat. Phys. 2008, 4, 810.
- (18) Maze, J. R.; Stanwix, P. L.; Hodges, J. S.; Hong, S.; Taylor, J. M.; Cappellaro, P.; Jiang, L.; Dutt, M. V. G.; Togan, E.; Zibrov, A. S.; Yacoby, A.; Walsworth, R. L.; Lukin, M. D. Nature 2008, 455, 644.
- (19) Balasubramanian, G.; Chan, I. Y.; Kolesov, R.; Al-Hmoud, M.; Tisler, J.; Shin, C.; Kim, C.; Wojcik, A.; Hemmer, P. R.; Krueger, A.; Hanke, T.; Leitenstorfer, A.; Bratschitsch, R.; Jelezko, F.; Wrachtrup, J. Nature 2008, 455, 648.
- (20) Dolde, F.; Fedder, H.; Doherty, M. W.; Nöbauer, T.; Rempp, F.; Balasubramanian, G.; Wolf, T.; Reinhard, F.; Hollenberg, L. C. L.; Jelezko, F.; Wrachtrup, J. Nat. Phys. 2011, 7, 459.
- (21) Dolde, F.; Doherty, M. W.; Michl, J; Jakobi, I.; Naydenov, B. Pezzagna, S.; Meijer, J. Neumann, P.; Jelezko, F.; Manson, N. B.; Wrachtrup, J. Phys. Rev. Lett. 2014, 112, 097603.
- (22) Kolkowitz, S.; Jayich, A. C. B.; Unterreithmeier, Q. P.; Bennett, S. D.; Rabl, P.; Harris, J. G. E.; Lukin, M. D. Science 2012, 335,1603.
- (23) Hong, S. K.; Grinolds, M. S.; Maletinsky, P.; Walsworth, R. L.; Lukin, M. D.; Yacoby, A. Nano Lett. 2012, 12, 3920.
- (24) Zhao, N.; Honert, J.; Schmid, B.; Klas, M.; Isoya, J.; Markham, M.; Twitchen, D.; Jelezko, F.; Liu, R. B.; Fedder, H.; Wrachtrup, J. Nat. Nanotech. 2012, 7, 657.
- (25) Taminiau, T. H.; Wagenaar, J. J. T.; van der Sar, T.; Jelezko, F.; Dobrovitski, V. V.; Hanson, R. Phys. Rev. Lett. 2012, 109, 137602.
- (26) Shi, F. Z.; Zhang, Q.; Naydenov, B.; Jelezko, F.; Du, J. F.; Reinhard, F.; Wrachtrup, J. Phys. Rev. B 2013, 87, 195414.
- (27) Mamin, H. J.; Kim, M.; Sherwood, M. H.; Rettner, C. T.; Ohno, K.; Awschalom, D. D.; Rugar, D. Science 2013, 339, 557.
- (28) Staudacher,T.; Shi, F. Z.; Pezzagna, S.; Meijer, J.; Du, J. F.; Meriles, C. A.; Reinhard, F.; Wrachtrup, J. Science 2013, 339, 561.
- (29) Trusheim, M. E.; Li, L.; Laraoui, A.; Chen, E. H.; Gaathon, O.; Bakhru, H.; Schroeder, T.; Meriles, C. A.; Englund, D. Nano Lett. 2014, 14, 32.
- (30) Spinicelli, P.; Dréau, A.; Rondin, L.; Silva, F.; Achard, J.; Xavier, S.; Bansropun, S.; Debuisschert, T.; Pezzagna, S.; Meijer, J.; Jacques, V.; Roch, J. New J. Phys. 2011 13, 025014.
- (31) Yamamoto, T.; Umeda, T.; Watanabe, K.; Onoda, S.; Markham, M. L.; Twitchen, D. J.; Naydenov, B.; McGuinness, L. P.; Teraji, T.; Koizumi, S.; Dolde, F.; Fedder, H.; Honert, J.; Wrachtrup, J.; Ohshima, T.; Jelezko, F.; Isoya, J. Phys. Rev. B 2013, 88, 075206.
- (32) Laraoui, A.; Hodges, J. S.; Meriles, C. A. Nano Lett. 2012, 12, 3477.
- (33) Song, X. R.; Zhang, J.; Feng, F. P.; Wang, J. F.; Zhang, W. L.; Lou, L. R.; Zhu, W.; Wang, G. Z. AIP advances 2014, 4, 047103.
- (34) Ryan, C. A.; Hodges, J. S.; Cory, D. G. Phys. Rev. Lett. 2010, 105, 200402.
- (35) De Lange, G.; Wang, Z. H.; Ristè, D.; Dobrovitski, V. V.; Hanson, R. Science 2010, 330, 60.
- (36) Hadden, J. P.; Harrison, J. P.; Stanley Clarke, A. C.; Marseglia, L.; Ho, Y.-L. D.; Patton, B. R.; O’Brien, J. L.; Rarity, J. G. Appl. Phys. Lett. 2010, 97, 241901.
- (37) Klimov, P. V.; Falk, A. L.; Buckley, B. B.; Awschalom, D. D. Phys. Rev. Lett. 2014, 112, 087601.