Searching for small-scale diffuse emission around SGR 1806–20
Abstract
Diffuse radio emission was detected around the soft gamma-ray repeater SGR 1806–20 after its 2004 powerful giant flare. We study the possible extended X-ray emission at small scales around SGR 1806–20, in two observations by the High Resolution Camera Spectrometer (HRC-S) on board of the Chandra X-ray Observatory: in 2005, 115 days after the giant flare, and in 2013, during quiescence. We compare the radial profiles extracted from data images and PSF simulations, carefully considering various issues related with the uncertain calibration of the HRC PSF at sub-arcsecond scales. We do not see statistically significant excesses pointing to an extended emission on scales of arcseconds. As a consequence, SGR 1806–20 is compatible with being point-like in X-rays, months after the giant flare, as well as in quiescence.
keywords:
stars: magnetic fields — pulsar: individual: SGR 1806–20— X-rays: stars — stars: magnetars1 Introduction
Magnetars are highly magnetized neutron stars [Duncan and Thompson, 1992, Thompson and Duncan, 1995, 1996] which share a number of common properties, including long spin periods (–12 s), large spin-down rates – s s-1), relatively bright and variable persistent luminosities ( erg s-1), and the emission of powerful bursts (see e.g. Mereghetti 2008, Rea and Esposito 2011 for recent reviews).
Magnetar bursting/flaring events can be classified as short X-ray bursts (lasting s, X-ray luminosities erg s-1), intermediate bursts (s, erg s-1), and the very energetic giant flares ( erg s-1), which have been detected only three times [Mazets et al., 1979, Hurley et al., 1999, 2005]. The 2004 December 27 giant flare from SGR 1806–20 was exceptionally bright, with an initial hard spike lasting 0.2 s followed by a 500 s long pulsating tail [Hurley et al., 2005, Mereghetti et al., 2005, Palmer et al., 2005]. The isotropic luminosity above 50 keV was erg s-1 (for a distance of kpc; Tendulkar et al. 2012 and references therein). Following this event a moving asymmetric nebula was discovered at radio frequencies [Cameron et al., 2005, Gaensler et al., 2005, Taylor et al., 2005, Gelfand et al., 2005, Fender et al., 2006]. The extremely accurate localization (arcsec) obtained with the radio data made it possible the identification of a variable infrared counterpart [Kosugi et al., 2005, Israel et al., 2005] to SGR 1806–20. Well after the giant flare and a strong bursting episode in 2006, Svirski et al. [2011] detected X-ray diffuse emission around SGR 1806–20 in quiescence, with a size of a few arcminutes, interpreted as dust scattering echo.
We report here on the study of the high angular resolution X-ray data of the Chandra HRC-S camera, taken a few months after the giant flare (2005) and in quiescence (2013), in order to investigate a possible small-scale X-ray diffuse emission around SGR 1806–20.
| Method | RA | Dec |
|---|---|---|
| X-ray 2005 | ||
| X-ray burst 2005 | ||
| X-ray 2013 | ||
| IR Kosugi et al. [2005] | ||
| IR Israel et al. [2005] |
2 Chandra HRC-S data analysis.
The High Resolution Spectroscopy camera (HRC-S; Murray et al. 2000) on board Chandra is a multichannel plate detector sensitive to X-rays over the 0.1–10 keV energy range. The instrument has a 0.13′′ pixel size, while essentially no energy information on the detected photons is available.111http://cxc.harvard.edu/proposer/POG/html/chap7.html provides an updated description of HRC and related issues. Here we analyze two observations, taken in timing mode, for which the instrument time resolution is 16 s. The reprocessing, reduction and analysis of data were performed using CIAO 4.5 and the corresponding calibration libraries (CALDB 4.5.8). We reprocessed data applying the subpixel reconstruction by randomization (pix_adj=randomize in the chandra_repro routine), and extracted images and exposure maps with the fluximage tool.
In order to improve the signal-to-noise (S/N) ratio, we considered only the channels PI .222http://cxc.harvard.edu/ciao/threads/hrci_bg_spectra This filter applies to the HRC Imaging (HRC-I) and HRC-S in timing mode. This allowed us to reduce the instrumental background by about , losing only of the source counts within the extraction region.
An additional filtering would consist in removing all the events with AMP_SF=3, in order to reduce the known asymmetric artifact at .333http://cxc.harvard.edu/ciao/caveats/psf_artifact.html and http://hea-www.harvard.edu/~juda/memos/HEAD2010/ HEAD2010_poster.html The latter is caused by an HRC hardware problem (the ringing of the amplifiers), which is only partly corrected by the processing of the raw data (hrc_process_events tool). In our cases, such filter reduces the background by , but also removes of the source counts. We checked that including or not such filter produces essentially identical images, so we did not apply it.
The net exposure time changes by maximum in different regions, and the maximum background relative variations in our observations are estimated to be less than , across the field of view.
| Model | index | PL norm | |||
|---|---|---|---|---|---|
| [cm-2] | [keV] | [] | |||
| 2005 | |||||
| Fiducial | 5.87 | 0.93 | 1.61 | 0.66 | 7.5 |
| Soft | 0.01 | 0.93 | 1.61 | 0.66 | 7.5 |
| Hard | 6.60 | 0.70 | 1.95 | 0.40 | 39 |
| 2013 | |||||
| Fiducial | 6.50 | - | - | 2.50 | 93 |
The HRC-S observed SGR 1806–20 on 2005 April 22, 116 days after the giant flare, in a single, uninterrupted 27.1 ks timing mode exposure (27.0 ks after correcting for the dead time; ObsID 6251). After applying the filters described above, we extracted a total of 1927 counts from a circular region of radius centered on the X-ray source. From a source-free, circular region of radius , far from SGR 1806–20, we estimate that the background contributes to of the total counts (11 photons).
The inspection of the light curve binned at 0.1 s shows the presence of several short bursts. We removed the time intervals with the bursts from the event lists by applying intensity filters. This reduced the net exposure time by 1.9 s, during which counts attributable to the bursts from SGR 1806–20 were detected.
With such time interval filter, assuming that the source is point-like and that of counts are enclosed within (according to the simulated PSF below), the aprates tool estimates the total counts of SGR 1806–20 to be .
We repeated the same procedure and cross-checks for the 2013 May 15, 30 ks timing mode observation (ObsID 14884). We extracted a total of counts from a circular region of radius centered on our X-ray source with an estimated background contribution of of the total counts ( 20 photons). No bursts are seen in the light curve.
Since SGR 1806–20 is the only point source detected in the observations, we use the celldetect routine to obtain the best-fitting coordinates of its X-ray centroid, considering the exposure map and the image previously extracted. In 2005, additional information is provided by the counts associated with short bursts. Removing these events gives a negligible ( mas) difference on the source best-fit position. On the other hand, when considering only the burst events, the X-ray position differs by with respect to the position obtained considering the entire X-ray flux. Last, we note that the choice of a narrower binsize parameter in fluximage slightly changes the best-fit position, with further sub-pixel refinement (binsize=0.1) providing only differences of the order .
The X-ray position between the two observations differ by , which is of the order of the Chandra absolute astrometric accuracy ( at c.l.). An infrared (IR) counterpart of SGR 1806–20 was independently proposed by Israel et al. [2005] and Kosugi et al. [2005]. With respect to the position reported by the latter, our X-ray position has an offset of (in 2005) and (in 2013). The recently estimated proper motion of mas yr-1 (of the same order of the field velocity and the galactic rotation velocity, Tendulkar et al. 2012) translates into a negligible difference expected between the source position in the 2005 and 2013 observation.
In Table 1 we report the positions we have found, and the IR positions reported in literature. The quoted statistical 1 uncertainties and the mutual discrepancies are both within the absolute astrometric accuracy of the pointing: (at 68% confidence level).444See http://asc.harvard.edu/cal/ASPECT/celmon/ The off-set of the source position with respect to the instrument aim point source position is in 2005, and in 2013.


3 Extended or point-like emission?
3.1 Simulated Point Spread Function
To investigate the possible presence of extended emission around SGR 1806–20, we extracted the radial profiles from the images, and compared them to the Point Spread Function (PSF) profile expected from a point source, which was simulated using the Chandra Ray Tracer555See http://cxc.harvard.edu/chart/index.html (ChaRT, March 2014 online version; Carter et al. 2003) and Model of AXAF Response to X-rays666See http://space.mit.edu/cxc/marx/index.html (MARX v5.0.0-0) software packages.777We stress that, compared with initial results obtained with the 2012 version, the ChaRT/MARX simulations provide now significantly larger PSFs, especially at high energy. For each observation, we used the satellite aspect (rolling angle and pointing) and the fiducial position derived from the data analysis, both for the construction of the PSF and the extraction of the radial profile. We checked that using other positions within the pointing accuracy error yields statistically negligible differences in the radial profiles.
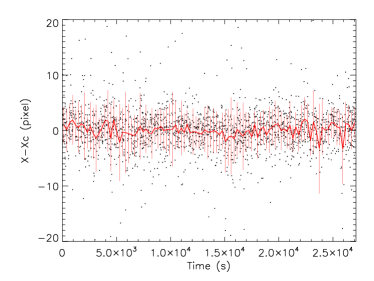
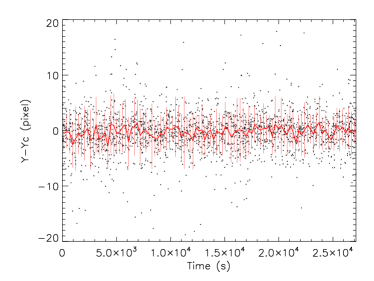
There are some caveats regarding the modeling of the PSF of HRC on sub-arcesond scales.888See http://cxc.harvard.edu/chart/caveats.html In particular, the residual errors in the position reconstruction cause a blur of the image over scales of (for on-axis sources). Such errors could be in principle modeled by the analysis of the event positions as a function of time.999See the case of the calibration source AR Lac, Fig. 1 at http://cxc.harvard.edu/contrib/juda/memos/hrc_blur/ hrc_blur_update.html. In Fig. 1 we show the mean positions (in detector coordinates) averaged out over time bins of 271 s, for the 2005 observation. In our case, the statistic is not high enough to recognize the possible residual position dithering (few pixels).
On the other hand, the blurring effect can be approximately considered in the ChaRT/MARX simulations by setting the phenomenological parameter Aspect_Blur larger than the default value of . Later we set it to . Such value, recommended by the manual, results from several years of calibration test, and it is an effective, phenomenological way to account for the effect. According to the manual, this value could be actually slightly larger, up , if high energy photons (several keV) are considered, since they get more blurred, compared to softX-ray photons. Last, we verified that including or not the pixel randomization in the simulations (pix_adj parameter set to exact or randomize in MARX) does not cause any statistically significant difference in the simulated image.
For the ray-tracing simulation, given the absence of spectral information in the HRC data, we have to assume a spectrum for the source. For the 2005 observation, we take the closest available XMM-Newton data, on 2005 March 07, which can be fit by an absorbed power law plus blackbody model, shown in Table 2 as fiducial, which is compatible with what obtained by Tiengo et al. [2005] (second row of their Table 1).101010The third row of their Table 1 is obtained by the fit of five different observations between 2003 and 2005, by forcing the values of and the blackbody component to be the same, with the power law component free to vary. The obtained spectrum has the following parameters: cm-2, and keV. Note that during the first year after the giant flare, the luminosity of SGR 1806–20 monotonically decreased by a factor of 2 and the spectrum was softening [Woods and Thompson, 2006, Esposito et al., 2007]. Since there is no reason to expect the temperature to be the same, we prefer to use the fit from the single observation (spectrum A). In order to test different spectra, we employed one much harder and one much softer, shown in Table 2. For the fiducial spectrum of the 2013 observation, we use the spectral fit to Swift/XRT data taken on 2013 March 17 (ObsID: 00035315026, photons): an absorbed power law with the parameters shown in Table 2.
3.2 High-resolution radial profiles.
We compare the radial profiles of data and simulations, obtained by considering the counts in a series of 1 pixel-wide annuli, centered around the same position. We normalize the simulated profile by fixing the first bin (i.e., the counts within ) to be the same as in the observed profile.
To build the simulations, we employed the fiducial X-ray position discussed above. For the data, as discussed above, we are not able to determine the exact position of the source with an accuracy better than . To this purpose, we move the annuli center across a grid of 100x100 positions in a box of 4x4 pixels (i.e., ) around the fiducial centroid of emission. Then, for each position, we systematically compute the radial profiles obtained for different annuli centers, and evaluate the root mean square (rms) differences and the counts excess. In this way, we are able to study how the assumed centroid position affects the differences between the theoretical and observed radial profiles, and to find, eventually, the optimal position, i.e. the one which minimizes the root mean square differences between the observed and simulated radial profiles.
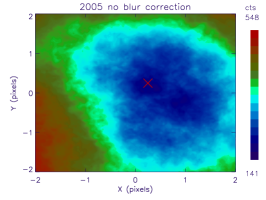
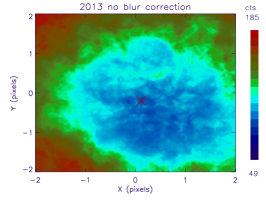
In Fig. 2, we show the comparison between the observed (solid lines) and simulated (dashes) radial profiles, for the 2005 case, with (Aspect_Blur=0.15, left) or without the blur correction (Aspect_Blur=0.07, center), for the optimal position, together with the total number of positive counts in excess (i.e., not taking into account the bins where data counts are less than in PSF). For the case without blur correction, we also show the 2D map of the excesses as a function of position (right panel). If the assumed position is strongly displaced from the optimal one, the profile becomes flatter, since the real peak of the emission is distributed among many radial bins, not only the central ones. Thus, a displaced center provides, by definition, large counts excesses (green and red colors).
In order to explore the effect of the spectrum on the simulated PSF, we have repeated the simulations for the three spectra of Table 2. The harder the spectrum, the broader the simulated PSF, and the smaller the rms differences. However, regardless of the spectrum, a few hundreds counts in excess (corresponding to a of the total counts) are seen in the optimal position only in the absence of the blur correction.
The same holds for the 2013 case, shown in Fig. 3: only when the blurring correction is properly considered in the simulation (Aspect_Blur=), the expected and observed profiles are compatible (excess counts not statistically significant).
3.3 Radial profile at intermediate scales.
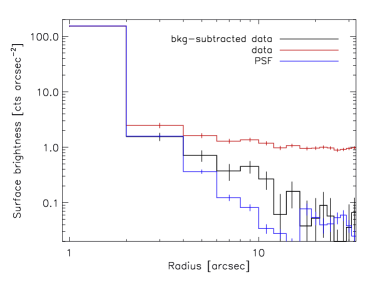
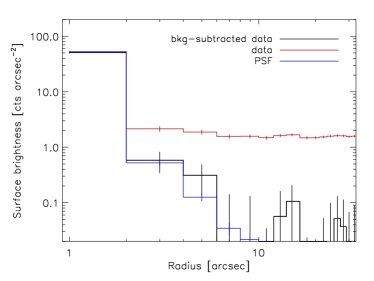
We repeat the same procedure above at larger scales (several arcseconds), to obtain radial profiles of the counts comprised within a series of annuli, up to from the fiducial center. In Fig. 4 we plot the comparison, for the 2005 (left panel) and 2013 (right) observations, of the radial profiles as extracted from data (red), background-subtracted data (black), and PSF simulation (blue). We normalize the profiles to the number of counts within . In 2005, a significant excess of the background-subtracted data counts are evident between and : in this annular region, there are counts in excess, which represent of the total counts in that region. Considering the circular region within , the excess counts are ( of the total counts in the same region). We have checked that this excess is present also when different spectra are used to simulate the PSF: for the hard spectrum of Table 2, the excess between and is only slightly reduced: (). We note also that, at such scales, the radial profiles are basically insensitive to the detailed position and the small-scale blurring: we have checked that the significance of the excess does not depend on the blurring correction.
On the other hand, in 2013 no clear excess is visible: the observed and simulated radial profiles seem compatible in the region within , where there are enough counts. However, the high background level would not allow to see a excess counts in the same region as 2005. This prevents us from comparing properly the diffuse emission in the two observations.
4 Timing analysis.
In the first Chandra observations, by using a (Rayleigh test), we measured a period s, which is in good agreement with the ephemeris by Woods et al. [2007]. The RMS pulsed fraction was % (uncertainties were determined from Monte Carlo simulations). For the 2013 observation, we searched for the periodic signals between 7 and 8 s, but it could not be found. This is not surprising, considering the low pulsed fraction of SGR 1806–20, and the low counting statistics of the 2013 observation. To restrict the search to a narrower range, we looked upon the last available values of the spin period of SGR 1806–20. The most recent observation of SGR 1806-20 where the period can be detected is an XMM-Newton observation (obs.ID 0654230401, unpublished), performed on 2011 March 23, where we measured s. Comparing this value with the last published measurement of s (2007 March 30, Nakagawa et al. 2009), it gives an average spin down rate of s s-1 from 2007 March 30 to 2011 March 23. This is among the largest values measured so far for SGR 1806–20 (see the McGill magnetar catalog, Olausen and Kaspi 2014). With these values at hand, we computed an upper limit for the pulsed fraction of a periodic signal with s (assuming a spin down rate from zero to five times the last observed ). Taking into account the 154 independent frequencies searched and following the recipes by Israel and Stella [1996], the 3 upper limit value is a poorly-constraining 64% for a sinusoidal signal.
5 Discussion
The careful analysis of the X-ray emission of SGR 1806–20 at arcsecond scale shows that the comparison with the Chandra-HRC PSF strongly depends on the parameter Aspect_Blur, which accounts for the blurring of the image. The latter is a phenomenological way to account for the PSF features, and depends on the photon energy (i.e., on the source spectrum).
In order to better understand this issue, we have repeated the whole procedure for the point-like, relatively soft and bright X-ray Isolated NS RBS 1223. We analyzed the data of the HRC 87.2 ks observation of 2004 March 30, from which we extracted counts in the central 2 circular region around the source. We repeated the same procedure as for SGR 1806–20, in order to compare simulations and data. Again, we found that simulations with Aspect_Blur=0.07 give too small PSFs compared with data, with an apparent counts excess in data. If instead Aspect_Blur=0.15 is employed in the simulation, the PSF and data radial profiles are compatible. Since the value of the blur parameter is set only phenomenologically, a more accurate and definitive study at such small scales require more precise calibrations. Note also that the modeling of artifacts and blur at small scale has been included only in the latest version of MARX, which has been a major revision. With previous versions of the software, the comparison of the radial profiles would have shown an excess in data, and could have been interpreted as diffuse emission. As a consequence, in order to draw physical interpretation from any HRC data at sub-arcsecond scale, we stress that the technical issues regarding simulated PSF should be carefully taken into account.
In conclusion, we do not see a statistically significant extended emission at small scales around SGR 1806–20, its observed emission is consistent with being point-like, both in the post-giant flare observation, and during quiescence. We do not detect any X-ray counterpart of the radio-nebula seen in 2005. On the other hand we found evidence in the 2005 data for diffuse emission on angular scale of about 10 arcseconds. Although a precise characterization of this diffuse emission is hampered by the poor statistics, by the large systematic errors due to the model-dependent PSF subtraction, and by the lack of spectral information, we note that its size and intensity are consistent with a scattering halo caused by a dust cloud relatively close to the source.
Acknowledgments
We acknowledge support from NewCompstar, and the grants AYA2012-39303 and SGR2009-811 (DV, NR). NR is supported by an NWO Vidi Award. We are grateful to: Lucien Kuiper and Wim Hermsen for their contribution in an earlier stage of the analysis of the 2005 data, Diego Götz for his useful comments, and Matteo Murgia for reanalyzing the VLA data for the time period following the giant flare.
References
References
- Cameron et al. [2005] Cameron, P.B., Chandra, P., Ray, A., Kulkarni, S.R., Frail, D.A., Wieringa, M.H., Nakar, E., Phinney, E.S., Miyazaki, A., Tsuboi, M., Okumura, S., Kawai, N., Menten, K.M., Bertoldi, F., 2005. Detection of a radio counterpart to the 27 December 2004 giant flare from SGR 1806 - 20. Nature 434, 1112–1115. doi:10.1038/nature03605.
- Carter et al. [2003] Carter, C., Karovska, M., Jerius, D., Glotfelty, K., Beikman, S., 2003. ChaRT: The Chandra Ray Tracer, in: H. E. Payne, R. I. Jedrzejewski, & R. N. Hook (San Francisco, CA: ASP) (Ed.), Astronomical Data Analysis Software and Systems XII, p. 477.
- Duncan and Thompson [1992] Duncan, R.C., Thompson, C., 1992. Formation of very strongly magnetized neutron stars - Implications for gamma-ray bursts. ApJL 392, L9–L13.
- Esposito et al. [2007] Esposito, P., Mereghetti, S., Tiengo, A., Zane, S., Turolla, R., Götz, D., Rea, N., Kawai, N., Ueno, M., Israel, G.L., Stella, L., Feroci, M., 2007. SGR 1806-20 about two years after the giant flare: Suzaku, XMM-Newton and INTEGRAL observations. A&A 476, 321–330. doi:10.1051/0004-6361:20078562, arXiv:arXiv:0710.2789.
- Fender et al. [2006] Fender, R.P., Muxlow, T.W.B., Garrett, M.A., Kouveliotou, C., Gaensler, B.M., Garrington, S.T., Paragi, Z., Tudose, V., Miller-Jones, J.C.A., Spencer, R.E., Wijers, R.A.M., Taylor, G.B., 2006. Structure in the radio counterpart to the 2004 December 27 giant flare from SGR 1806-20. MNRAS 367, L6--L10. doi:10.1111/j.1745-3933.2006.00123.x, arXiv:arXiv:astro-ph/0511214.
- Gaensler et al. [2005] Gaensler, B.M., Kouveliotou, C., Gelfand, J.D., Taylor, G.B., Eichler, D., Wijers, R.A.M.J., Granot, J., Ramirez-Ruiz, E., Lyubarsky, Y.E., Hunstead, R.W., Campbell-Wilson, D., van der Horst, A.J., McLaughlin, M.A., Fender, R.P., Garrett, M.A., Newton-McGee, K.J., Palmer, D.M., Gehrels, N., Woods, P.M., 2005. An expanding radio nebula produced by a giant flare from the magnetar SGR 1806-20. Nature 434, 1104--1106. doi:10.1038/nature03498, arXiv:arXiv:astro-ph/0502393.
- Gelfand et al. [2005] Gelfand, J.D., Lyubarsky, Y.E., Eichler, D., Gaensler, B.M., Taylor, G.B., Granot, J., Newton-McGee, K.J., Ramirez-Ruiz, E., Kouveliotou, C., Wijers, R.A.M.J., 2005. A Rebrightening of the Radio Nebula Associated with the 2004 December 27 Giant Flare from SGR 1806-20. ApJL 634, L89--L92. doi:10.1086/498643, arXiv:arXiv:astro-ph/0503269.
- Hurley et al. [2005] Hurley, K., Boggs, S.E., Smith, D.M., Duncan, R.C., Lin, R., Zoglauer, A., Krucker, S., Hurford, G., Hudson, H., Wigger, C., Hajdas, W., Thompson, C., Mitrofanov, I., Sanin, A., Boynton, W., Fellows, C., von Kienlin, A., Lichti, G., Rau, A., Cline, T., 2005. An exceptionally bright flare from SGR 1806-20 and the origins of short-duration -ray bursts. Nature 434, 1098--1103. doi:10.1038/nature03519.
- Hurley et al. [1999] Hurley, K., Cline, T., Mazets, E., Barthelmy, S., Butterworth, P., Marshall, F., Palmer, D., Aptekar, R., Golenetskii, S., Il’Inskii, V., Frederiks, D., McTiernan, J., Gold, R., Trombka, J., 1999. A giant periodic flare from the soft gamma-ray repeater SGR 1900+14. Nature 397, 41--43.
- Israel et al. [2005] Israel, G., Covino, S., Mignani, R., Stella, L., Marconi, G., Testa, V., Mereghetti, S., Campana, S., Rea, N., Götz, D., Perna, R., Lo Curto, G., 2005. Discovery and monitoring of the likely IR counterpart of SGR 1806-20 during the 2004 -ray burst-active state. A&A 438, L1--L4. doi:10.1051/0004-6361:200500138, arXiv:astro-ph/0506095.
- Israel and Stella [1996] Israel, G.L., Stella, L., 1996. A New Technique for the Detection of Periodic Signals in ‘‘Colored’’ Power Spectra. ApJ 468, 369. doi:10.1086/177697, arXiv:arXiv:astro-ph/9603038.
- Kosugi et al. [2005] Kosugi, G., Ogasawara, R., Terada, H., 2005. A Variable Infrared Counterpart to the Soft Gamma-Ray Repeater SGR 1806-20. ApJL 623, L125--L128. doi:10.1086/430171, arXiv:arXiv:astro-ph/0503280.
- Mazets et al. [1979] Mazets, E.P., Golentskii, S.V., Ilinskii, V.N., Aptekar, R.L., Guryan, I.A., 1979. Observations of a flaring X-ray pulsar in Dorado. Nature 282, 587--589.
- Mereghetti [2008] Mereghetti, S., 2008. The strongest cosmic magnets: soft gamma-ray repeaters and anomalous X-ray pulsars. A&ARv. 15, 225--287. doi:10.1007/s00159-008-0011-z, arXiv:0804.0250.
- Mereghetti et al. [2005] Mereghetti, S., Götz, D., von Kienlin, A., Rau, A., Lichti, G., Weidenspointner, G., Jean, P., 2005. The First Giant Flare from SGR 1806-20: Observations Using the Anticoincidence Shield of the Spectrometer on INTEGRAL. ApJL 624, L105--L108. doi:10.1086/430669.
- Murray et al. [2000] Murray, S.S., Austin, G.K., Chappell, J.H., Gomes, J.J., Kenter, A.T., Kraft, R.P., Meehan, G.R., Zombeck, M.V., Fraser, G.W., Serio, S., 2000. In-flight performance of the Chandra high-resolution camera, in: Truemper, J.E., Aschenbach, B. (Eds.), Proc. SPIE Vol. 4012, X-Ray Optics, Instruments, and Missions III, p. 68.
- Nakagawa et al. [2009] Nakagawa, Y.E., Mihara, T., Yoshida, A., Yamaoka, K., Sugita, S., Murakami, T., Yonetoku, D., Suzuki, M., Nakajima, M., Tashiro, M.S., Nakazawa, K., 2009. Suzaku Observations of SGR1900+14 and SGR1806-20. PASJ 61, 387. doi:10.1093/pasj/61.sp1.S387, arXiv:0808.3846.
- Olausen and Kaspi [2014] Olausen, S.A., Kaspi, V.M., 2014. The McGill Magnetar Catalog. ApJS 212, 6. doi:10.1088/0067-0049/212/1/6, arXiv:1309.4167.
- Palmer et al. [2005] Palmer, D.M., Barthelmy, S., Gehrels, N., Kippen, R.M., Cayton, T., Kouveliotou, C., Eichler, D., Wijers, R.A.M.J., Woods, P.M., Granot, J., Lyubarsky, Y.E., Ramirez-Ruiz, E., Barbier, L., Chester, M., Cummings, J., Fenimore, E.E., Finger, M.H., Gaensler, B.M., Hullinger, D., Krimm, H., Markwardt, C.B., Nousek, J.A., Parsons, A., Patel, S., Sakamoto, T., Sato, G., Suzuki, M., Tueller, J., 2005. A giant -ray flare from the magnetar SGR 1806 - 20. Nature 434, 1107--1109. doi:10.1038/nature03525.
- Rea and Esposito [2011] Rea, N., Esposito, P., 2011. Magnetar outbursts: an observational review, in: Torres, D.F., Rea, N. (Eds.), High-Energy Emission from Pulsars and their Systems. Springer Berlin Heidelberg. Astrophysics and Space Science Proceedings, pp. 247--273.
- Svirski et al. [2011] Svirski, G., Nakar, E., Ofek, E.O., 2011. SGR 1806-20 distance and dust properties in molecular clouds by analysis of flare X-ray echoes. MNRAS 415, 2485--2494. doi:10.1111/j.1365-2966.2011.18872.x, arXiv:1103.0006.
- Taylor et al. [2005] Taylor, G.B., Gelfand, J.D., Gaensler, B.M., Granot, J., Kouveliotou, C., Fender, R.P., Ramirez-Ruiz, E., Eichler, D., Lyubarsky, Y.E., Garrett, M., Wijers, R.A.M.J., 2005. The Growth, Polarization, and Motion of the Radio Afterglow from the Giant Flare from SGR 1806-20. ApJL 634, L93--L96. doi:10.1086/491648, arXiv:arXiv:astro-ph/0504363.
- Tendulkar et al. [2012] Tendulkar, S.P., Cameron, P.B., Kulkarni, S.R., 2012. Proper Motions and Origins of SGR 1806-20 and SGR 1900+14. ApJ 761, 76. doi:10.1088/0004-637X/761/1/76, arXiv:1210.8151.
- Thompson and Duncan [1995] Thompson, C., Duncan, R.C., 1995. The soft gamma repeaters as very strongly magnetized neutron stars - I. Radiative mechanism for outbursts. MNRAS 275, 255--300.
- Thompson and Duncan [1996] Thompson, C., Duncan, R.C., 1996. The Soft Gamma Repeaters as Very Strongly Magnetized Neutron Stars. II. Quiescent Neutrino, X-Ray, and Alfven Wave Emission. ApJ 473, 322--342.
- Tiengo et al. [2005] Tiengo, A., Esposito, P., Mereghetti, S., Rea, N., Stella, L., Israel, G.L., Turolla, R., Zane, S., 2005. The calm after the storm: XMM-Newton observation of SGR 1806-20 two months after the Giant Flare of 2004 December 27. A&A 440, L63--L66. doi:10.1051/0004-6361:200500170.
- Woods et al. [2007] Woods, P.M., Kouveliotou, C., Finger, M.H., Göğüş, E., Wilson, C.A., Patel, S.K., Hurley, K., Swank, J.H., 2007. The Prelude to and Aftermath of the Giant Flare of 2004 December 27: Persistent and Pulsed X-Ray Properties of SGR 1806-20 from 1993 to 2005. ApJ 654, 470--486. doi:10.1086/507459, arXiv:astro-ph/0602402.
- Woods and Thompson [2006] Woods, P.M., Thompson, C., 2006. in Compact stellar X-ray sources, ed. W. H. G. Levin and M. van der Klis. Cambridge: Cambridge University Press, p. 547.