Fast neutron scattering on Gallium target at 14.8 MeV
Abstract
Benchmarking of evaluated nuclear data libraries was performed for MeV neutrons on Gallium targets. The experiments were performed at China Institute of Atomic Energy(CIAE). Solid samples of natural Gallium (3.2 cm and 6.4 cm thick) were bombarded by MeV neutrons and leakage neutron energy spectra were measured at 60∘ and 120∘. The measured spectra are rather well reproduced by MCNP-4C simulations with the CENDL-3.1, ENDF/B-VII and JENDL-4.0 evaluated nuclear data libraries, except for the inelastic contributions around MeV. All three libraries significantly underestimate the inelastic contributions. The inelastic contributions are further studied, using the Talys simulation code and the experimental spectra are reproduced reasonably well in the whole energy range by the Talys calculation, including the inelastic contributions.
I. Introduction
The experimental studies of fast neutron scattering are important for design of nuclear reactors Hiroyuki1986 ; Steven2012 . They play a crucial role for verification of the evaluated nuclear data libraries, especially the elements that are of interest in accelerator driven systems, fission and fusion reactor technologies. Gallium (Ga) is one of such elements, which can be used as a cooling agent. Due to special physical properties of Ga, it is also used to make filling materials of some element samples, such as, Pu element within the device of reactors and nuclear weapons in a mixed form with Ga. Ga is a soft silvery metal and becomes liquid at slightly above the room temperature (29.78 ∘C). It is a moderate heat conductor similar to Lead and non-explosive unlike Sodium. Therefore it is a good candidate of a cooling agent for nuclear reactors. However, its available experimental data are limited and benchmarking of the evaluated nuclear data libraries is necessary. The benchmarking has been performed at CIAE since 2009 Nie2010 . The validity of the benchmarking test system has been examined. Several targets have been studied, such as U Nie2010 , Be Nie2013 , water Zhang2014 and polyethylene Nie2012 .
In this article, we studied fast neutron scatterings on Ga samples. The leakage neutron energy spectra were measured by time of flight measurements and evaluated nuclear data libraries were benchmarked. The discrepancies between the experimental data and the simulations based on the evaluated nuclear libraries are further investigated. The article is organized as follows. In Sec.II, the experiment is briefly described. In Sec.III, the benchmarking of evaluated nuclear data libraries are presented. In Sec.IV, elastic and inelastic contributions are discussed. A summary is given in Sec.V.
II. Experiment
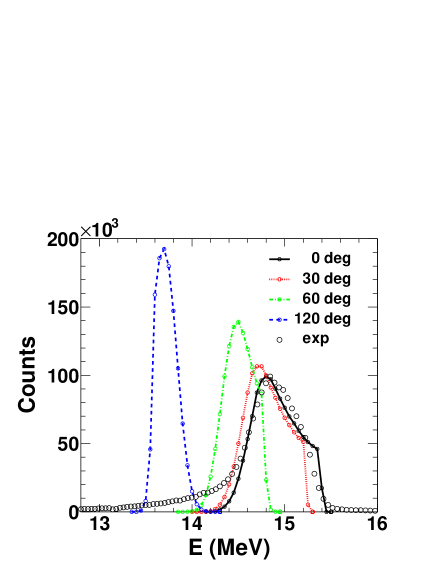
The experiment was performed at CIAE. Neutrons were produced by the reaction using the 300 keV beam accelerated by the Cockcroft-Walton accelerator. The average beam current was about 30 A during the experiment. A silicon surface barrier detector positioned at with respect to the beam was used to monitor the neutron yield by counting the associated particles. Another monitor, a BC501A scintillation detector, was placed at 7.98 m from the neutron source at approximately zero degree. The angles of the leakage neutrons are selected by changing the target position along the leakage neutron direction, which results in change of the neutron emission angle from the Tritium target and the flight distance of the target sample to the detector. The energy distributions of the neutrons emitted from the source in different angles, , , and with respect to the beam direction, have been simulated using TARGET code schlegel2005 . The calculated results are shown in Fig. 1 with the experimentally observed distribution by the monitor scintillator near 0∘. The energy distributions of the neutrons are around 14 MeV, slightly depending on different emission angles. The average neutron energy decreases slightly as the emission angle increases. The energy distribution measured by the monitor detector is well reproduced around the peak energy by the calculation at 0∘, which is slightly affected by the accelerator pulse shapes. The pulse width of the beam during this experiment was kept 3 ns.
In the experiment, the generated neutrons from two angles, and with respect to the beam direction were used, which gives the leakage neutron emission angle of 60∘ and 120∘, respectively, and the same average incident neutron energy distribution peaked at around 14.8 MeV at both target positions. The beam was impinged on Ga samples. Natural Ga was used, which is composed of and . Two self-supported solid Ga samples were made as a cylindrical shape with cm 3.2 cm and cm 6.4 cm. (The samples were manufactured at a low temperature room and stored in a refrigerator. During the experiment, room temperature was kept to keep them in solid.) Leakage neutron spectra from Gallium samples ware measured using a BC501A ( cm 2.54 cm) scintillation detector by a TOF technique with the flight path of 8.30 m and 8.67 m for 60∘ and 120∘, respectively. A pre-collimator system, which is made of Iron, polyethylene and Lead, were orderly placed along the fight path between the sample and the detector. In front of the detector, another collimator was embedded inside the concrete wall of 2 m thick with a hole of cm diameter , which was set to shield the neutron detector from background neutrons. Using such a heavy shielding and collimating system, high foreground/background ratio has been achieved. The light output function and the detection efficiency of the neutron detector were well calibrated at the 1-20 MeV at the Tandem Accelerator at CIAE Huang2009 . For a given thresholds, the detection efficiency can be well determined with NEFF code Dietze1982 . Further details of the experimental setup and the data acquisition system can be found in Ref. Nie2010 and Nie2012 .
III. Results
The neutron leakage time spectra measured in the experiment are shown by symbols in Fig. 2 (a) and (b). The measured data were normalized to the n-p scattering cross section on a polyethylene target in a separate run. Time calibration has been made, using the gamma peak which is eliminated in Fig. 2. The errors presented in the figure are from the statistical errors. As shown in the figure, the neutron leakage time spectra are quite similar with each other at both angles. Similar characteristic properties are also observed for those of the 3.2 cm thinner sample, and therefore their spectra are not shown. In the highest energy region, a shape peak is observed, which corresponds to the elastic scattering. The experimentally observed widths of the elastic peaks are dominated by the incident neutron energy distribution at the target which is shown in Fig.1. Inelastic contributions start right after the elastic peak. and reaction channels are opened at the incident neutron energy of 14.8 MeV. These contributions are observed as a broad peak starting around 170 ns in the time spectra (below 13 MeV in energy).
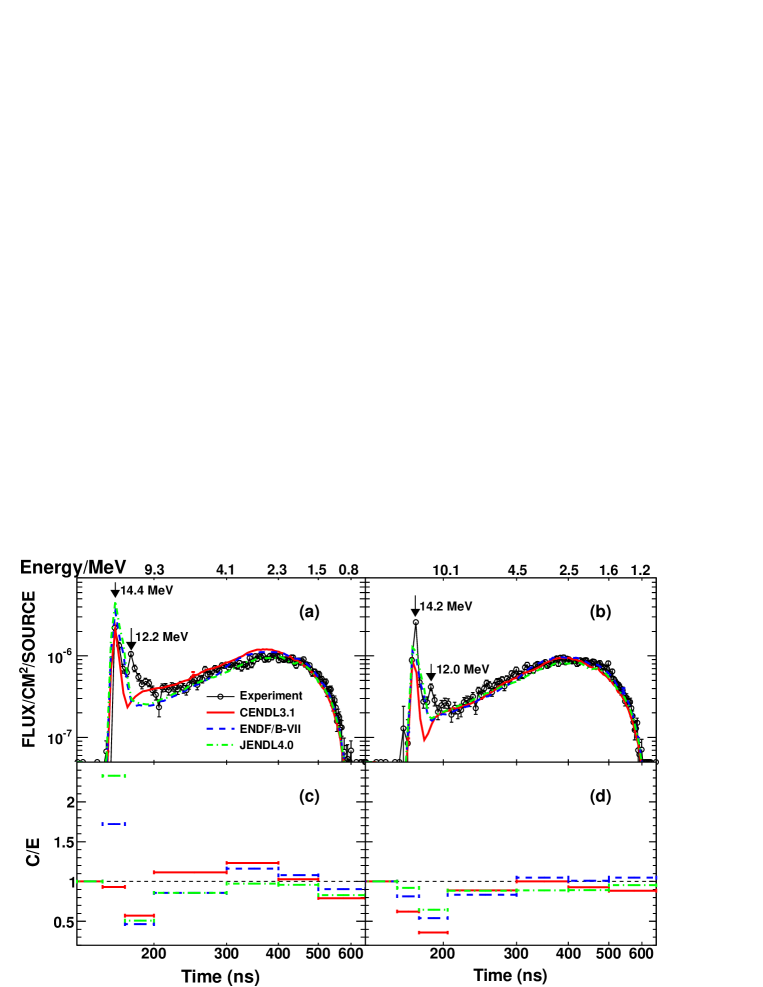
To benchmark evaluated nuclear data libraries, the neutron leakage spectra are simulated by MCNP-4C Briesmeister code using Gallium evaluated nuclear data from the CENDL3.1, ENDF/B-VII and JENDL4.0 libraries. In the MCNP simulations, the experimental parameters are taken into account. These include the incident neutron energy distribution at the target, the target thickness, the neutron detection efficiency, the time response of the neutron detector and among others. The calculated results of the MCNP simulations are compared with those of the experiment in Fig. 2 (a) and (b). The general trends of the experimental neutron leakage spectra are well reproduced except for the inelastic peak around MeV.
In order to make further detail comparisons, the ratios of calculated and experimental cross sections, , are plotted in Fig. 2 (c) and (d) as a function of time for a certain time interval. From the above comparisons, we made the following observations:
-
1.
At ns ( MeV), a sharp elastic peak is observed. The simulated yield of the elastic scattering neutrons depends on the choice of the evaluated nuclear libraries. For , the yield from the CENDL3.1 library agrees within 5 comparing with that of the experiment, whereas those from the ENDF/B-VII and JENDL4.0 libraries are larger by a factor of and a factor of , respectively. At , the ratios are 0.6, 0.8, and 0.9 for the CEND3.1, ENDF/B-VII, and JENDL4.0, respectively.
-
2.
At ns ( MeV), a small, but clear peak is observed. The contribution originates from inelastic scatterings and all MCNP simulations using these three libraries do not show a peak as the experimental data do and significantly underestimate the cross section.
-
3.
At ns ( MeV), a broad peak is observed, which originates from the and reaction channels. The experimental cross sections are well reproduced by the simulations from all three libraries within 20 at both angles.
IV. Discussions
In the following discussions, we first address the discrepancy of the elastic contribution for the different nuclear libraries. Then we address the problem of the inelastic contributions, using the Talys program.
A. Elastic contribution
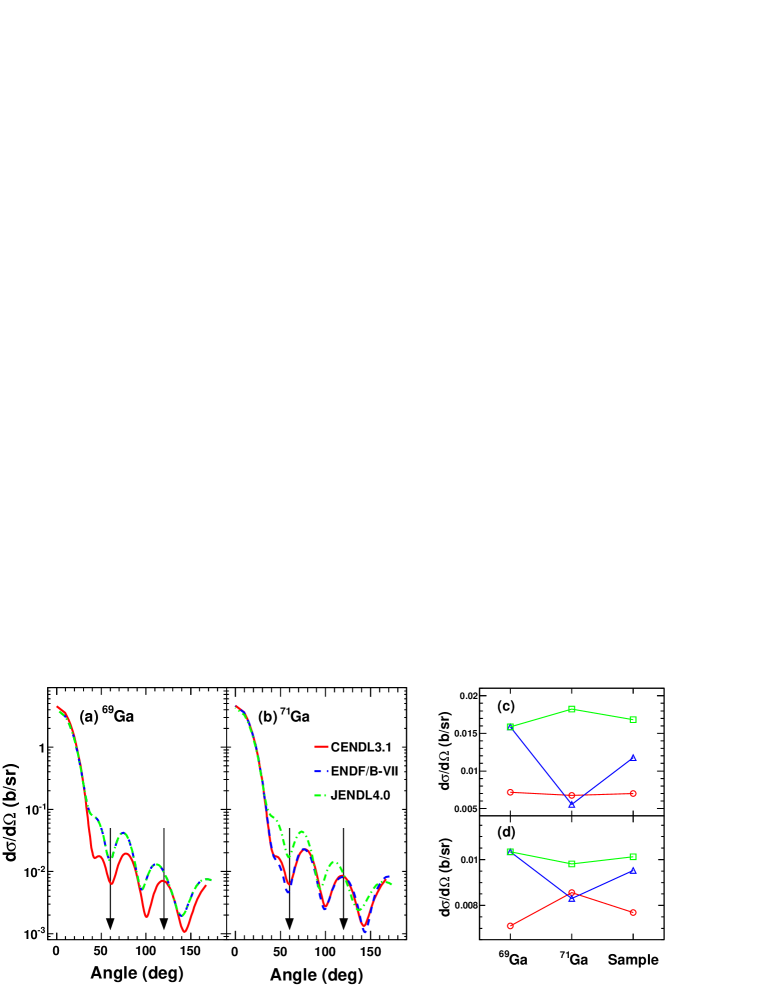
The angular distributions of the elastic scattering for and , from the CENDL3.1, ENDF/B-VII and JENDL4.0 libraries, are shown in Fig. 3 (a) and (b), respectively. The available data of the three evaluated nuclear libraries at 14.75 MeV are used for the plots. As shown in Fig. 3 (a) and (b), the angular distributions show a strong forward peaking and an oscillation pattern appears at angles larger than . The oscillation patterns of the evaluated elastic angular distributions of and from the CENDL3.1 and JENDL4.0 libraries are almost identical, whereas those from the ENDF/B-VII library show slightly different distributions between and . The elastic cross sections of and at and , are picked up from Fig. 3 (a) and (b), at angle positions indicated by arrows, and plotted in Fig. 3 (c) for and (d) for with the calculated values for the natural Ga sample. One should note that in the angular distribution locates near the valley of the distributions for all cases, and thus the effect of the ambiguity of the experimental angular determinations on the cross section becomes an order of less than 10. , on the other hand, locates near a peak for some cases. In this case the ambiguity from the angular determination becomes in the similar order, whereas for other cases, the angle locates on the shoulder of the distribution and thus the ambiguity becomes larger. The cross section of the natural target sample is calculated as . The ratios of the elastic cross sections of the target sample between these three libraries, are at and at . These ratios are quite consistent with those obtained in Fig. 2 (c) and (d), in which these ratios of at and at are obtained. These observations indicate that the discrepancies of the elastic scattering neutron yields in the MCNP simulations using the CENDL3.1, ENDF/B-VII and JENDL4.0 libraries in Fig. 2 (a) and (b) originate simply from the differences in the angular distribution of the elastic cross sections at and in these libraries. One should note that, as shown in Fig. 3 (a) and (b), the major contribution of the elastic scattering to the total reaction cross section is governed by the contribution at angles smaller than and therefore the discrepancies in the elastic peaks observed in this experiment is in a minor effect for the whole elastic contribution.
B. Inelastic contributions
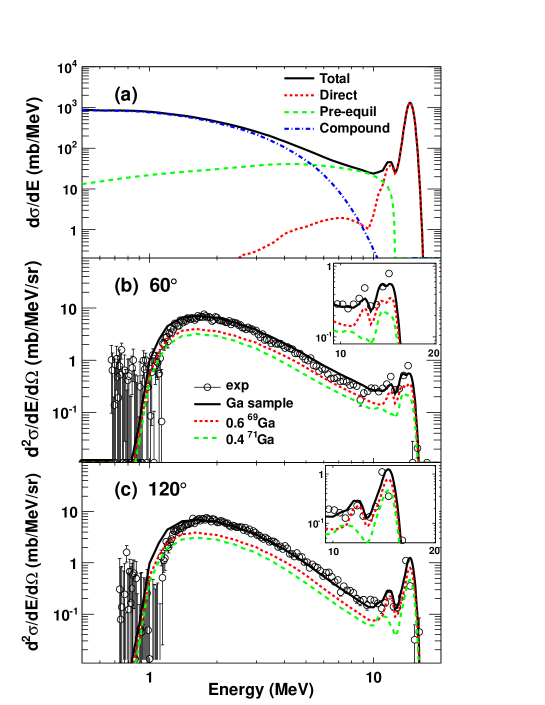
To investigate the discrepancies in the neutron leakage energy spectra between the experiment and the MCNP simulations at MeV, simulations by Talys-1.6 code koning2013 are performed. In the Talys code, the neutron-induced reaction is divided in three physical processes, e.g., direct, pre-equilibrium and compound nucleus reactions. Calculated total neutron leakage energy spectrum and the contributions from three processes are shown in Fig. 4 (a). Natural Ga samples was used in the plots. The calculated total cross section show three
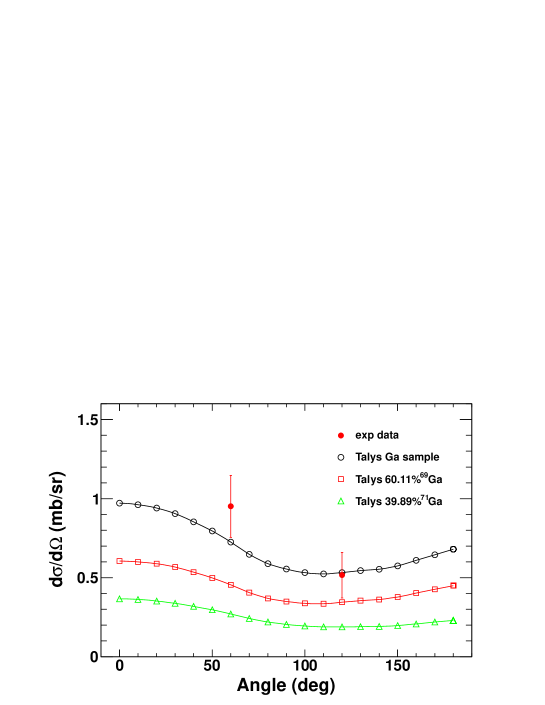
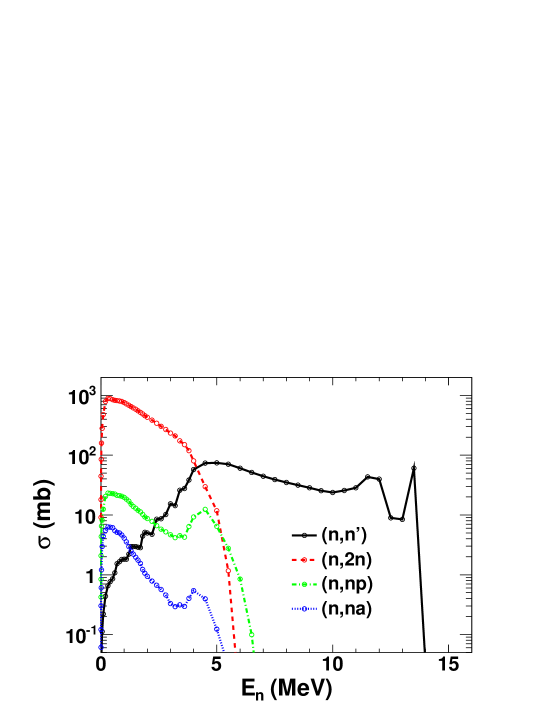
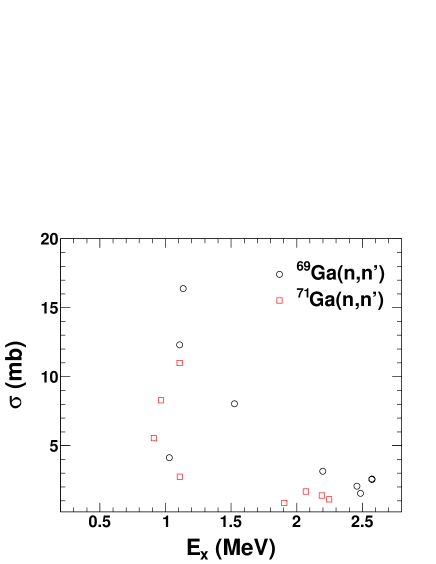
characteristic features, an elastic peak, an inelastic peak and a broad bump in the low energy side. The elastic and inelastic peaks are generated by the direct process. The broad bump at the low energy is dominated by the compound nucleus process. The contribution from the pre-equilibrium process is dominated at the energy range of MeV. In Fig. 4 (b) and (c), the experimental energy spectra at and are compared with the calculations, respectively. The experimental spectra are well reproduced by the calculated cross sections for the Ga sample, including the inelastic peaks at both angles. Individual contributions of 69Ga and 71Ga to those of the Ga sample are also shown by dotted and dashed lines. As shown clearly in the inserts, the inelastic peaks are mainly generated from the direct process of 69Ga, but not of 71Ga though a very small contribution from 71Ga is observed at at a slightly ( MeV) lower neutron energy. In Fig. 5 the calculated angular distribution of the inelastic cross section at MeV are plotted from the Talys simulation (open symbols) and compared with those of the experiment (filled circles). In contrast to the elastic channel, the calculated angular distribution is rather flat and the experimental data agree within the error bars at both angles. In this work, since we are focusing on the neutron emission channels, no neutron pick-up reaction channel is used in the direct reaction channel. In Fig. 6, the contributions of different reaction channels to the total reaction cross sections are plotted as a function of the leakage neutron energy for natural Ga sample. The cross section is the sum of those from the discrete and continuum states calculations. The channel dominates in the direct and pre-equilibrium contribution at 5 MeV MeV. At MeV, the compound nucleus contribution of the process is dominated and and channels show minor contributions. In Fig. 7, the calculated cross section of the individual state below 2.6 MeV is plotted for 69Ga(circles) and 71Ga(squares). As one can see, the location of the excited levels are similar for the two isotopes, but the strengths are larger by about for 69Ga. For the natural Ga samples, the natural abundance of is multiplied for 71Ga and the relative yield to those of 69Ga is further reduced. This causes a relatively small contribution from 71Ga in the inelastic contribution at MeV. This fact indicates that there is no essential difference between the reaction mechanisms of neutron scattering between 69Ga and 71Ga in the inelastic channels.
V. summary
The neutron leakage spectra from natural Ga samples at the incident energy of 14.8 MeV are compared with the MNCP simulations with the CENDL3.0, ENDF/B-VII and JENDL4.0 evaluated nuclear data libraries at and . The essential characteristic properties of the spectra are well reproduce by these simulations, except for the inelastic contributions at MeV. The results from all three libraries significantly underestimate the cross section in this energy range. The experimental spectra are further compared with those of the Talys simulations with the standard default parameters in addition to the parameters related to the experiments. The Talys simulations reproduce the experimental spectra very well, including the inelastic peak at MeV. It is found that the inelastic contributions originated mainly from the channel of 69Ga and minor contribution from those of 71Ga. As far as concerning to the observed spectra for Ga samples in this experiment, the Talys code provides a slightly better nuclear data information, comparing to the CENDL3.0, ENDF/B-VII and JENDL4.0 evaluated nuclear data libraries.
Acknowledgments
The authors thank to the operational staff in the Cockcroft-Walton accelerator, China Institute of Atomic Energy, for their support during the experiment. The experiment is supported by the National Natural Science Foundation of China (Grants No. 11075189) and ADS project 302 (Grants No. XDA03030200) of the Chinese Academy of Sciences.
References
- (1) C. Steven and van der Marck, Nuclear Data Sheets. 113 (2012) 2935.
- (2) Hiroyuki Hashikura et al., Journal of Nuclear Science and Technology. 23(6) (1986) 477.
- (3) Y. Nie et al., Annals of Nuclear Energy. 37 (2010) 1456.
- (4) Y. Nie et al., Annual Report of China Institute of Atomic Energy. (2013) 78.
- (5) Zhang Kai et al., Nuclear Techniques. 37(8) (2014) 080501.
- (6) Y. Nie et al., Nuclear Physics Review. 29(3) (2012) 310.
- (7) D. Schlegel, TARGET User’s Manual, laborbericht PTB-6.42-05-2. Braunschweig, Germany, 2005.
- (8) H. X. Huang et al., Chinese Physics C. 33(8) (2009) 677.
- (9) G. Dietze and H. Klein, NRESP4 and NEFF4 Monte Carlo Code for the Calculation of Neutron Response Functions and Detection Efficiencies for NE213 Scintillation Detectors. PTB-ND-22. Physikalisch-Technische Bundesanstalt, Braunschweig, Germany.
- (10) J. Briesmeister, MCNP A General Monte Carlo N-particle Transport Code, Version 4C. Tech. Rep. LA 13709, M. Los Alamos National Laboratory, USA, 2000.
- (11) A. Koning, S. Hilaire and S. Goriely, Nuclear Research and Consultancy Group, (2013), http://www.talys.eu/.