Optical study of the hyper-luminous X-ray source
2XMM J011942.7+032421
Abstract
We present the identification and characterization of the optical counterpart to 2XMM J011942.7+032421, one of the most luminous and distant ultra-luminous X-ray sources (ULXs). The counterpart is located near a star forming region in a spiral arm of the galaxy NGC 470 with , , and magnitudes of 21.53, 21.69, and 21.71 mags, respectively. The luminosity of the counterpart is much larger than that of a single O-type star, indicating that it may be a stellar cluster. Our optical spectroscopic observations confirm the association of the X-ray source and the optical counterpart with its host galaxy NGC 470, which validates the high, 1041 , X-ray luminosity of the source. Its optical spectrum is embedded with numerous emission lines, including H recombination lines, metallic forbidden lines and more notably the high-ionization He II (4686 Å) line. This line shows a large velocity dispersion of 410 , consistent with the existence of a compact ( 5 AU) highly-ionized accretion disc rotating around the central X-ray source. The 1.4 1037 luminosity of the He II line emission makes the source one of the most luminous ULXs in the emission of that line. This, together with the high X-ray luminosity and the large velocity dispersion of the He II emission, suggests that the source is an ideal candidate for more extensive follow-up observations for understanding the nature of hyper-luminous X-ray sources, a more luminous subgroup of ULXs and more likely candidates for intermediate-mass black holes.
1 Introduction
Stellar black holes remnants of massive stars have masses of up to 30 , typically radiating at luminosities of 1037 and occasionally up to 1039 (see McClintock and Remillard, 2006). Supermassive black holes at the centers of galaxies, on the other hand, have typical masses in the range of 106–109 and luminosities of – . Between the two lie putative intermediate-mass black holes (IMBHs) of 102–104 proposed to explain the high X-ray luminosities of 1039–1042 from ultra-luminous X-ray sources (ULXs), which are bright off-nuclear X-ray point sources mostly found near star-forming regions in spiral galaxies (e.g., Liu & Bregman, 2005). The IMBHs interpretation of the ULXs is particularly compelling for the more luminous subset of ULXs of 1041 for which other explanations for their nature, such as those based on beamed emission or supper-Eddington accretion onto compact objects (e.g., Ohsuga & Mineshige, 2011; Moon & Eikenberry, 2001; Moon et al., 2003), have hitherto been unable to provide plausible scenarios. This is consistent with the recent results from X-ray population studies (Swartz et al., 2011) which separate such luminous, i.e., 1041 , ULXs from the population of stellar-mass X-ray sources in the local Universe, bolstering the case for the IMBH interpretation.
Although ULXs have been studied mostly in the X-ray waveband, identification and characterization of ULXs in the optical, where one can study their stellar counterpart, accretion disc, and/or extended nebular emission – particularly the high-ionization He II (4686 Å; 54 eV ionization potential) emission from X-ray photo-ionization – is essential to understanding the nature of these sources (e.g., van der Marel, 2004; Gutiérrez, 2006, 2013; López-Corredoira & Gutiérrez, 2006; Moon et al., 2011). Here, we present a study on 2XMM J011942.7+032421 (Sutton et al., 2012; Gladstone, 2013), one of the most luminous ULXs located at 33″ (or 5.3 kpc at 33.5 Mpc) from the center of the SA(rs)b galaxy NGC 470, in the optical waveband. Located at the host galaxy NGC 470 as confirmed in this study (see §2), the maximum X-ray luminosity in the 0.2–12 keV range of the ULX is 1.53 1041 (Sutton et al., 2012), and its X-ray spectra can be fit either by absorbed power-law emission or absorbed multicolor-disk (MCD) emission of 1 keV inner disc temperature with its mass of 1,900 . The source has exhibited an order of magnitude decrease of its X-ray luminosity in power-law emission, and there is some evidence for the existence of a short-term, i.e., 1 hr, variability, indicating accretion onto a massive compact object. The host galaxy NGC 470 forms a pair with NGC 474 at 5′ away, and the pair shows clear signs for early interactions between them (Rampazzo et al., 2006).
The high, 1041 , X-ray luminosity of 2XMM J011942.7+032421 places it in the aforementioned group of more luminous ULXs, dubbed “hyper-luminous” (or sometimes “extreme”) ULXs (e.g., Soria et al., 2010; Gladstone et al., 2013). Among them only two other sources of M82 X-1 and ESO 243-49 HLX-1 have been studied with their counterparts in the optical waveband to the best of our knowledge. M82 X-1 was identified to be associated with a stellar cluster (Portegies Zwart et al., 2004), but a recent study showed that the position of the optical counterpart may have a significant offset, 065 (or 3 level), from its X-ray position (Voss et al., 2011). The optical counterpart to ESO 243-49 HLX X-1 has an intrinsic brightness –11, comparable to that of a massive globular cluster (Soria et al., 2010), and was detected with H emission from a redshift comparable to that of the host galaxy ESO 243-49 (Wiersema et al., 2010). Although the detection of the H emission confirms the location of HLX X-1 in the host galaxy, no detailed optical spectroscopic information is avaiable for this source or M82 X-1. Our study presented in this of 2XMM J011942.7+032421 is the first detailed spectroscopic observations of a hyper-luminous ULX in the optical waveband.
2 Observations and Results
Our inspection of SDSS images and catalogues111http://skyserver.sdss3.org/dr10/en/home.aspx at the location of the ULX 2XMM J011942.7+032421 reveals the presence of a point source (ID #1237678620110880953) at (R.A., decl) = (, ) (J2000) near the Chandra X-ray position (, ) of the ULX reported in Sutton et al. (2012). (Note that no archival HST image for the region around the ULX is available.) We measure its more precise X-ray position using the same Chandra data in Sutton et al. to be (R.A., decl) = (, ). This is consistent with the previous measurement and is 03 away from the optical point source in the SDSS data, which is well within the positional uncertainty resident in matching the Chandra and SDSS astrometry. The , , and magnitudes of the optical point source are 21.53 0.13, 21.69 0.06 and 21.71 0.08 mag, respectively, while its and magnitudes have rather large uncertainties and are excluded from further analyses (see below). Based on the position and also on the spectroscopic information presented below, we identify this object to be the optical counterpart to the ULX 2XMM J011942.7+032421.
Spectroscopic observations of the optical counterpart were made with the OSIRIS spectrograph222http://www.gtc.iac.es/instruments/osiris/osiris.php on the 10.4-m GTC333http://www.gtc.iac.es in La Palma (Spain) using its service observing mode on 2012 September 14. Three consecutive 900-s long-slit spectra of R1000B grism were obtained at the parallactic angle of each exposure under 1″ seeing condition around 1.2 airmass. The slit width and length were 1″ and 8′, respectively; the pixel spatial sampling was 025. The spectra were analyzed following the standard procedure using IRAF444IRAF is the Image Reduction and Analysis Facility, written and supported by the IRAF programming group at the National Optical Astronomy Observatories (NOAO) in Tucson, Arizona., which comprises bias subtraction, flat-field correction, co-addition of the three single exposures, wavelength calibration, and spectral extraction. The flat-field correction was made only in the red ( 6,300 Å) part of each spectrum due to the low response of the calibration lamp in the blue part. Spectral calibration was conducted using 32 He-Ar and Ne arc lines that we obtained at the beginning of the night in the wavelength range 4,000–7,500 Å, and the rms uncertainty in the wavelength calibration was 0.06 Å. The FWHM of the lines, which is equivalent to the intrinsic spectral resolution of the OSIRIS spectrograph, increases from 6.0 Å at 4,000 Å to 7.6 Å at 7,500 Å. The spectroscopic standard star Ross 640 (Oke 1990) was observed for photometric calibration.
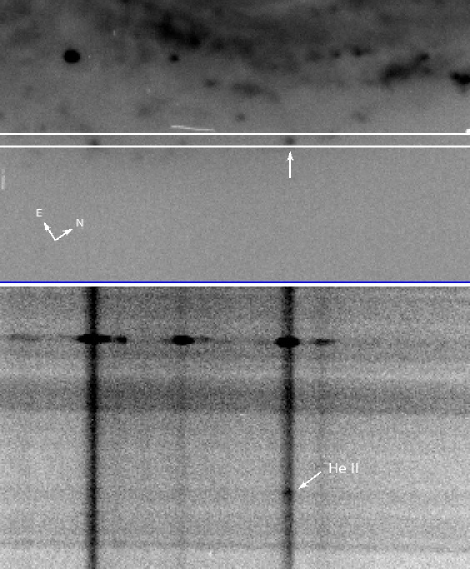
The top panel in Figure 1 is a raw 20-s acquisition image of the field obtained by ORSRIS just prior to taking spectra, showing the location of the source, which is indicated by a white arrow, overlaid on the slit projection; the bottom panel shows part of a 2-D dispersed image of the obtained OSIRIS spectrum including the wavelength range of H (4861 Å; extended emission around continuum sources) and He II (4868 Å; indicated by a white arrow) lines. As in Figure 1, in addition to 2XMM J011942.7+032421, spectra of three more sources lying on the slit were obtained: two at 294 and 162 away from 2XMM J011942.7+032421 in the left-hand side and one at 590 away in the right-hand side. All the three sources show extended H recombination lines with relative velocities of –78, –38, and –19 , respectively, to 2XMM J011942.7+032421. Note that only 2XMM J011942.7+032421 shows the He II emission line at 4686 Å. Hodge & Kennicutt (1983) identified 51 H II regions in spiral arms of NGC 470, 18 of them within 1′ distance from 2XMM J011942.7+032421 including the H II region 46 inside the positional uncertainty of the ULX. It is, therefore, highly likely that all the four sources in Figure 1 are H II regions or at least associated with H II regions in spiral arms of the host galaxy NGC 470.
According to Sutton et al. (2012), the best-fit X-ray spectra of 2XMM J011942.7+032421 give H column density of 1.0–1.4 1021 cm-2 for absorbed power-law model and 9 1020 for absorbed multi-component disk blackbody model in the host galaxy, additionally to 3.1 1020 cm-2 in the Galaxy toward the source. We take the low limit of 1 1021 cm-2 from the absorbed power-law model fits as the H column density toward the source, and this gives 0.70 mag inclusive of the Galactic contribution. This estimation agrees with the extinction deduced from the empirical H/H ratio (Calzetti et al., 2000) where the quoted uncertainty includes contributions from those in line intensity measurement and dust models.
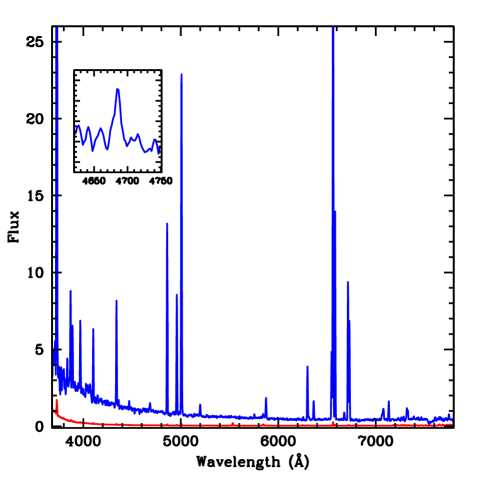
Figure 2 shows the spectrum of the counterpart 2XMM J011942.7+032421 which is wavelength rest-framed and also extinction corrected. The spectrum is dominated by numerous emission lines, including H Balmer series, He lines (both He I and He II) and forbidden lines of heavy elements, which overlie blue continuum emission. Table 1 contains a list of the emission lines identified in our spectrum. The velocity of H line is 2,370 , and it is consistent with the value obtained as the radial velocity of NGC 470 in H I observations (e.g., Huchra et al., 1999). The rms velocity shift of other lines with respect to the H emission is 7.2 14.8 which is insignificantly small. No meaningful velocity offset between the He II (4686 Å) line and the other lines is identified as the former shows a –9.8 5.3 shift from the H line, confirming that the ULX counterpart is indeed located in the host galaxy NGC 470 and, consequently, validating the X-ray luminosity measurement of the ULX (see §1). The 9.0 0.6 Å FWHM of the He II line is significantly larger than those of the other isolated lines which have an average FWHM of 6.4 0.9 Å. In order to investigate the large linewidth of the He II line further, we measure it in all of the three individual 900-s exposures to be 11.9 3.7, 13.0 2.7 and 16.0 5.2 Å, consistently larger than those of the other lines. The increased uncertainties caused by the faintness of the signal in the individual exposures, however, make it impossible to check if the central velocity of the He II line changes during the three exposures. Note that all the isolated lines other than the He II line have a FWHM compatible with the intrinsic spectral resolution of the OSIRIS spectrograph (see above). Excluding the instrumental line width of 6.3 Å measured in an arc line at 4,400 Å, the FWHM of the He II line corresponds to velocity dispersion of 410 . The de-reddend line intensity ratios 85 and 1.4 for ([N II](6548 Å)+[N II](6583 Å))/[N II](5755 Å) and [S II](6716 Å)/[S II](6713 Å), respectively, indicate the temperature and electron density of 1.1 104 K and 30 cm-3, respectively (Osterbrock and Ferland, 2006), whereas 11.5 for the ratio of ([O II]((3727 Å)+[O III](4959+5007Å))/H does subsolar metallicity of the source (Kewley & Dopita, 2002).
We use the continuum emission in Figure 2 to obtain its and magnitudes of 21.8 and 22.1 mag, respectively, after removing the line emission in the bands. The band magnitude is comparable to that from the SDSS photometry, whereas the band magnitude is larger than the SDSS result. We attribute this discrepancy in the band magnitudes to the contribution by the strong H emission of the source and also to the uncertainty resident in photometric calibration of spectroscopic observations. The de-reddened absolute magnitudes of the optical counterpart in the and bands are –11.7 and –11.1 mag, respectively, after correction for its = 0.7 mag extinction. The absolute magnitudes of the optical counterpart of 2XMM J011942.7+032421 are approximately 100 times brighter than a single O-type star (Zombeck, 1990) and are comparable to those of a more evolved star such as a Wolf-Rayet (WR) star or a luminous blue variable (e.g., Hainich et al., 2014), or more likely an unresolved stellar cluster.
3 Discussion and Conclusions
As described in §2, 2XMM J011942.7+032421 is located close to an H II region in NGC 470 with small velocity offsets from other nearby H II regions in spiral arms – which is indicative that it is related to star formation activities therein – and also from the nucleus of the host galaxy. This makes it highly unlikely that the source is a product of disruption of a satellite galaxy by the host galaxy or a merge of satellite galaxies (Bellovary et al., 2010) as suggested for the hyper-luminous ULX ESO 243-49 showing 400 velocity shift from its nucleus (Soria et al., 2012). The absence of significant dynamic motions other than the large velocity dispersion in the He II emission also makes it unlikely that the source is a recoiling supermassive black hole (Komosa et, 2008). And its 300 X-ray (0.5–8 keV range) to optical ( band) flux ratio, computed by the method in Hornschemeier et al. (2001), is much larger than the typical value, i.e., 10, found in active galactic nuclei (Bauer et al., 2004), while it is lower than the value, 500, found in ESO 243-49 (Soria et al., 2010), supporting the interpretation that the source is unlikely associated with a supermassive black hole.
As observed in Cygnus X-3 and NGC 300 X-1 (Lommen et al., 2005; Binder et al., 2011), WR stars accreting onto a compact object have shown high X-ray luminosities up to 1038 , and Liu et al. (2013) suggested that M101 ULX-1 is a binary system of a WR star and a black hole of 20–30 . However, it is less likely that the optical counterpart of 2XMM J011942.7+032421 is a WR star accreting onto a compact object since we do not see any spectral signature, e.g., broad emission lines indicating significant mass loss, of a WR star (Figure 2). Other possibilities for the origin of the optical continuum emission of 2XMM J011942.7+032421 include an unresolved stellar cluster or irradiate disc emission as often found in other ULXs.
One notable feature in the spectrum of the source is the He II (4686 Å) line which is known to be often produced by strong X-ray photoionization, including those from ULXs (e.g., Moon et al. 2011). The presence of the He II emission also supports that it is a real optical counterpart to 2XMM J011942.7+032421. At the distance of 33.5 Mpc, the de-reddend luminosity of the He II emission is 1.4 1037 ergs s-1, corresponding to the X-ray (0.1–12 keV) to He II luminosity ratio of 5.7 104. This makes 2XMM J011942.7+032421 one of the most luminous ULXs observed in the He II emission. Figure 3, which compares the spatial distribution of the He II emission with that of the nearby H emission, shows that the former is a bit more centrally concentrated than the latter – the FWHM of the He II emission is 12, whereas that of H is 16. The size of the H emission is substantially greater than the seeing size ( 1″ in average) and also the size of the He II emission. The size of the He II emission, however, is not much different from the seeing size, and it is uncertain if the former is indeed greater than the latter. If the large 410 velocity dispersion of the He II emission (§2) is due to the rotation of a photoionized accretion disc around the X-ray source as suggested for other ULXs (see Moon et al., 2011), the size of an area where the majority of the He II emission originates is , where , and are the Gravitational constant, mass and velocity dispersion, respectively. This gives 0.05–5 AU for the mass range of 10–1,000 , which is in fact much smaller than the seeing size. Note that the H emission dose not show any apparent velocity dispersion (§2), and it is in a different dynamic motion from He II. We thus conclude the linear size of the H emission to be 260 pc corresponding to 16, while the He II emission is unresolved. This is consistent with what have been observed in other ULXs where large ( 100 pc) emission nebulae show more extended emission in H than He II (Moon et al., 2011). In particular, the ULX Ho IX X-1 at 3.6 Mpc shows an unresolved central He II emission of 370 velocity dispersion surrounded by diffuse He II emission as well as by strong unevenly-distributed H emission. At an about 10 times larger distance, the He II emission of Ho IX X-1 may appear as that of 2XMM J011942.7+032421 presented in this study.
2XMM J011942.7+032421 is one of the most luminous ULXs with its X-ray luminosities reaches up to 1.5 1041 . Using the SDSS data, we discovered its optical countepart near an H II region in a spiral arm of the host galaxy NGC 470, and our optical spectrum of the source shows blue continuum embedded with numerous emission lines such as H recombinations, forbidden transitions, and most notably high-ionization He II line at the same velocity of the host galaxy, validating the high X-ray luminosity of the ULX and confirming its optical conterpart. The absence of any significant dynamic motion, other than the large velocity dispersion of the He II emission, of the source identified in the optical spectrum indicates that it is less likely associated with disruption or merge of satellite galaxies or motion of a supermassive black hole. The unresolved He II emission of 410 velocity dispersion, which is consistent with what have been observed in other ULXs, most likely represents a compact ( 5 AU) photoionized accretion disc rotating the central X-ray source. The large optical luminosity suggests that the source may be an unresolved stellar cluster.
References
- Bauer et al. (2004) Bauer, F. E., Alexander, D. M., Brandt, W. N., et al. 2004, AJ, 128, 2048
- Bellovary et al. (2010) Bellovary, J. M. et al. 2010, ApJ, 721, L148
- Binder et al. (2011) Binder, B., Williams, B. F., Eracleous, M., et al. 2011, ApJ, 742, 128
- Bregman et al. (2003) Bregman, J. N., Houck, J. C., Chevalier, R. A., & Roberts, M. S. 2003, ApJ, 596, 323
- Calzetti et al. (2000) Calzetti, D., Armus, L., Bohlin, R. C., et al. 2000, ApJ, 533, 682
- Crowther & Hadfield. (2006) Crowther & Hadfield 2006, A&A, 449, 711
- Cseh et al. (2012) Cseh, D., Corbel, S., Kaaret, P., et al. 2012, ApJ, 749, 17
- Gladstone (2013) Gladstone, J. C., 2013, MmSAI, 84,1
- Gladstone et al. (2013) Gladstone, J. C., Copperwheat, C., Heinke, C. O., Roberts, T. P., Cartwright, T. F., Levan, A. J., & Goad, M. R. 2013, ApJS, 206, 14
- Grisé et al. (2012) Grisé, F., Kaaret, P., Corbel, S., et al. 2012, ApJ, 745, 123
- Gutiérrez (2006) Gutiérrez, C. M., 2006, ApJ, 640, L17
- Gutiérrez (2013) Gutiérrez, C. M., 2013, A&A, 549, 81
- Hainich et al. (2014) Hainich, R., et al. 2014, A&A, 565, 27
- Hodge & Kennicutt (1983) Hodge, P. W., & Kennicutt, R. C., Jr. 1983, AJ, 88, 296
- Hornschemeier et al. (2001) Hornschemeier, A. E., Brandt, W. N., Garmire, G. P., et al. 2001, ApJ, 554, 742
- Huchra et al. (1999) Huchra, J. P., Vogeley, M. S., & Geller, M. J. 1999, ApJS, 121, 287
- Kewley & Dopita (2002) Kewley, L. J., & Dopita, M. A. 2002, ApJS, 142, 35
- Komosa et (2008) Komosa, S., Zhou, H., & Lu, H. 2008, ApJ, 678, L81
- Körding et al. (2002) Körding, E., Falcke, H., & Markoff, S. 2002, A&A, 382, L13
- King et al. (2001) King, A. R., Davies, M. B., Ward, M. J., Fabbiano, G., & Elvis, M. 2001, ApJ, 552, L109
- Liu & Bregman (2005) Liu, J.-F. & Bregman, J. N. 2005, ApJS, 157, 59
- Liu et al. (2013) Liu, J.-F., Bregman, J. N., Bai, Y., Justham, S., & Crowther, P. 2013, Nature, 503, 500
- López-Corredoira & Gutiérrez (2006) López-Corredoira, M., & Gutiérrez, C. M., 2006, A&A, 454, 77
- Lommen et al. (2005) Lommen, D., Yungelson, L., van den Heuvel, E., Nelemans, G., & Portegies Zwart, S. 2005, A&A, 443, 231
- McClintock and Remillard (2006) McClintock, J. E., & Remillard, R. A. 2006, Compact stellar X-ray sources. Edited by Walter Lewin & Michiel van der Klis. Cambridge Astrophysics Series, No. 39. Cambridge, UK: Cambridge University Press.
- Moon & Eikenberry (2001) Moon, D.-S. & Eikenberry, S. S. 2001, ApJ, 552, 135
- Moon et al. (2003) Moon, D.-S., Eikenberry, S. S., & Wasserman, I. M. 2003, ApJ, 586, 1280
- Moon et al. (2011) Moon, D.-S., Harrison, F. A., Cenko, S. B., & Shariff, J. A. 2011, ApJ, 731, L32
- Oke (1990) Oke, J. B. 1990, AJ, 99, 1621
- Ohsuga & Mineshige (2011) Oshuga, K., & Mineshige, S. 2011, ApJ, 736, 2
- Osterbrock and Ferland (2006) Osterbrock, D. E., & Ferland, G. J. 2006, Astrophysics of gaseous nebulae and active galactic nuclei, 2nd. ed. by D.E. Osterbrock and G.J. Ferland. Sausalito, CA: University Science Books.
- Oke (1990) Oke, J. B. 1990, AJ, 99, 1621
- Portegies Zwart et al. (2004) Portegies Zwart, S. F., Baumgardt, H., Hut, P., Makino, J., & McMillan, S. L. W. 2004, Nature, 428, 724
- Rampazzo et al. (2006) Rampazzo, R. et al. 2006, MNRAS, 368, 851
- Soria et al. (2010) Soria, R., Hau, G. K. T., Graham, A. W., et al. 2010, MNRAS, 405, 870
- Soria et al. (2012) Soria, R., Hakala, P. J., Hau, G. K. T., Gladstone, J. C., & Kong, A. K. H. 2012, MNRAS, 420, 3599
- Sutton et al. (2012) Sutton, A. D., Roberts, T. P., Walton, D. J., Gladstone, J., & Scott, A. E. 2012, MNRAS, 423, 1154
- Swartz et al. (2011) Swartz, D. A., Soria, R., Tennant, A. F., & Yukita, M. 2011, ApJ, 741, 49
- Tao et al. (2011) Tao, L., Feng, H., Grisé, F., & Kaaret, P. 2011, ApJ, 737, 81
- Tao et al. (2012) Tao, L., Kaaret, P., Feng, H., & Grisé, F. 2012, ApJ, 750, 110
- van der Marel (2004) van der Marel, R. P. 2004, Coevolution of Black Holes and Galaxies, from the Carnegie Observatories Centennial Symposia. Published by Cambridge University Press, as part of the Carnegie Observatories Astrophysics Series. Edited by L. C. Ho.
- Voss et al. (2011) Voss, R., Nielsen, M. T. B., Nelemans, G., Fraser, M., & Smartt, S. J. 2011, MNRAS, 418, L124
- Wiersema et al. (2010) Wiersema, K., Farrell, S. A., Webb, N. A., Servillat, M., Maccarone, T. J., Barret, D., & Godet, O. 2010, ApJ, 721, L102 & Kaaret, P. 2011, ApJ, 733, 118
- Yang et al. (2011) Yang, L., Feng, H., & Kaaret, P. 2011, ApJ, 733, 118
- Zombeck (1990) Zombeck, M. V. 1990, Handbook of space astronomy and astrophysics. Cambridge: University Press, 1990, 2nd ed.

| Line | Intensity | FWHM | Line | Intensity | FWHM | ||
|---|---|---|---|---|---|---|---|
| (Å) | (Å) | (Å) | (Å) | ||||
| [O II] | 3728.2 | 643.0(16.6) | 6.1(0.2) | H | 3835.6 | 10.6(1.0) | 4.5(0.8) |
| [Ne III] | 3868.8 | 39.4(1.5) | 4.9(0.6) | He I | 3889.2 | 26.0(1.2) | 5.3(0.7) |
| [Ne III]+He I | 3968.9 | 32.0(1.1) | 6.4(0.4) | H | 4102.1 | 29.1(0.9) | 5.6(0.5) |
| H | 4340.7 | 45.8(1.2) | 5.9(0.2) | [O III] | 4362.5 | 3.3(0.3) | 5.9(0.4) |
| He I | 4471.3 | 3.2(0.2) | 5.0(0.3) | He II | 4685.4 | 4.6(0.2) | 9.0(0.6) |
| H | 4861.3 | 91.6(2.1) | 6.6(0.2) | [O III] | 4958.7 | 59.6(1.4) | 6.8(0.2) |
| [O III] | 5006.7 | 177.0(4.0) | 7.0(0.1) | [N I] | 5199.0 | 6.1(0.2) | 7.3(0.4) |
| [N II] | 5755.4 | 1.7(0.1) | 5.7(0.3) | He I | 5875.4 | 10.6(0.3) | 7.2(0.3) |
| [O I] | 6299.6 | 28.7(0.7) | 7.1(0.3) | [O I] | 6363.0 | 9.6(0.3) | 6.6(0.4) |
| [N II] | 6547.7 | 40.8(0.8) | 7.0(0.2) | H | 6562.4 | 308.0(6.6) | 7.1(0.1) |
| [N II] | 6583.0 | 117.0(2.4) | 7.1(0.1) | He I | 6677.6 | 4.5(0.2) | 7.8(0.5) |
| [S II] | 6715.9 | 72.4(1.6) | 6.8(0.1) | [S II] | 6730.3 | 51.8(1.1) | 6.7(0.2) |
| He I††Contaminated by an unidentified nearby feature. | 7065.8 | 4.2(0.2) | 11.2(0.8) | [O III]+[O II] | 7079.3 | 8.8(0.3) | 11.2(0.6) |
| [Ar III] | 7135.1 | 9.0(0.3) | 6.3(0.5) | [O II] | 7318.9 | 6.1(0.2) | 7.3(0.9) |
| [O II] | 7329.4 | 4.0(0.2) | 5.3(0.8) |
Note. — The wavelengths are rest-framed observed values and the line intensity is in the unit of 10-17 ergs s-1 cm-2. The values in the parentheses represent 1 uncertainty level.