Environment and Protostellar Evolution
Abstract
Even today in our Galaxy, stars form from gas cores in a variety of environments, which may affect the properties of resulting star and planetary systems. Here we study the role of pressure, parameterized via ambient clump mass surface density, on protostellar evolution and appearance, focussing on low-mass, Sun-like stars and considering a range of conditions from relatively low pressure filaments in Taurus, to intermediate pressures of cluster-forming clumps like the Orion Nebula Cluster (ONC), to very high pressures that may be found in the densest Infrared Dark Clouds (IRDCs) or in the Galactic Center (GC). We present unified analytic and numerical models for collapse of prestellar cores, accretion disks, protostellar evolution and bipolar outflows, coupled to radiative transfer (RT) calculations and a simple astrochemical model to predict CO gas phase abundances. Prestellar cores in high pressure environments are smaller and denser and thus collapse with higher accretion rates and efficiencies, resulting in higher luminosity protostars with more powerful outflows. The protostellar envelope is heated to warmer temperatures, affecting infrared morphologies (and thus classification) and astrochemical processes like CO depletion to dust grain ice mantles (and thus CO morphologies). These results have general implications for star and planet formation, especially via their effect on astrochemical and dust grain evolution during infall to and through protostellar accretion disks.
Subject headings:
stars: formation1. Introduction
In self-gravitating virialized gas clumps, internal pressure is set by gas envelope weight, which is related to the more easily observable mass surface density, , via (McKee & Tan 2003, hereafter MT03). Observed s of star-forming regions vary greatly, from regions like Taurus with (Onishi et al. 1996) where low-mass stars are forming in relative isolation, to regions like the ONC with (MT03) where low-mass stars are more crowded around massive stars. IRDCs have (Butler & Tan 2012). Some massive-star-forming regions reach (Plume et al. 1997; Battersby et al. 2014; Tan et al. 2014). Here low-mass stars are also expected to form along with massive stars from the fragmenting clump. GC region clouds, such as the “Brick,” also contain clumps of very high (Rathborne et al. 2014). How do these different environmental conditions affect formation of Sun-like stars?
In the Turbulent Core model for massive star formation (MT03), initial core size and subsequent protostellar evolution are determined by initial core mass, , and of surrounding clump. This model can be extended to low-mass star formation, assuming cores are approximately virialized and in pressure balance with the clump. A prestellar core, i.e., on verge of collapse, of given mass in a higher environment experiences a higher surface pressure, is therefore more compact and dense, and thus collapses with higher accretion rate. Higher luminosity due to faster accretion and more compact structure make the core warmer. Such dependence of protostellar core temperature on environment has further implications for infrared morphologies, chemical evolution of core and disk, and potentially planet formation.
The above scenario falls within the “core accretion” paradigm, in which accretion rate and final stellar mass are determined by initial conditions of the core. In the alternative “competitive accretion” paradigm (Bonnell et al. 2001), there is no such dependence on initial core properties.
Some observations of protoclusters suggest neighboring protostars have more correlated luminosities and accretion rates (Kryukova et al. 2014, Elmegreen et al. 2014). This has been explained invoking mass segregation and large-scale accretion flows, which appear in competitive accretion, but may also result from accretion rate dependence on star formation environment as predicted by core accretion. A better quantitative understanding of this environmental dependence will help solve this question.
Here we study how star-forming environment () affects thermal evolution, infrared morphologies and CO gas phase abundances of protostellar cores. The infrared appearance of low-mass protostars and its dependence on envelope, disk, and outflow properties were studied by Robitaille et al. (2006) with a suite of RT models. Temperature and chemical evolution of protostellar cores have also been studied using various astrochemistry models incorporated into either analytical models of collapse (e.g., Visser et al. 2009, 2011) or dynamical simulations (e.g., Hincelin et al. 2013). However, dependence of temperature evolution, infrared morphology, and chemistry on initial environmental conditions, especially pressure and , has not yet been studied with a self-consistent model including collapsing cores, disks, gradually widening outflow cavities and full protostellar evolution. This is our goal.
2. Models
In several papers (Zhang & Tan 2011, Zhang et al. 2013, 2014, hereafter ZT11, ZTM13, ZTH14), we have developed a RT model for massive star formation, following evolutionary sequences of protostars forming from massive cores. Each evolutionary track was built from three initial conditions: clump mass surface density ; core mass ; and core rotational-to-graviational energy ratio . Extending this model to low-mass star formation, low-mass cores have radius . Note, enters this formula because it sets core surface pressure via . In a Taurus-like region with , the typical radius of a core (which will form a star if the efficiency ) is . In an Orion-like region with , this core has , consistent with observed prestellar cores in these regions (Ward-Thompson et al. 2007). The core is assumed to be a singular polytropic sphere at start of collapse, with power-law density distribution with .
Collapse follows inside-out expansion wave solutions (McLaughlin & Pudritz 1997) expected of singular polytropic cores. In later non-homologous stages after the expansion wave reaches the core boundary, we simply lower the envelope density while fixing the density profile shape and outer boundary, normalizing to remaining envelope mass. Inside the sonic point, we apply the Ulrich (1976) solution for density and velocity profiles to model infall with rotation, which conserves angular momentum. The disk is described by an -disk model, including effects of outflow and accretion infall (ZTM13). Disk mass is set equal to 1/3 of stellar mass, expected if self-gravity is regulating accretion and angular momentum transport. Disk outer radius is set by the centrifugal radius, increasing with protostellar growth as (ZTH14), where is star+disk mass, and is idealized star+disk mass in the case of no outflow feedback, making the average star formation efficiency. This assumes angular momentum is conserved inside the sonic point. The disk could be smaller if magnetic braking is relatively strong (Li et al. 2014).
Bipolar protostellar outflows carve out low-density cavities, which gradually widen, affecting how the envelope is irradiated by the protostar. We include this process by considering when enough wind momentum is accumulated to accelerate envelope material to the escape velocity (Matzner & McKee 2000; ZTH14). We assume outflow momentum distribution with polar angle , suitable for X-winds or disk-winds at large distance (Matzner & McKee 1999). Concentration of wind momentum towards implies outflow breakout first occurs at the poles and then gradually widens. Outflowing mass rate is assumed as , typical for disk winds (Königl & Pudritz 2000). After the opening angle is determined, we carve out such cavities from the envelope, but with detailed wall shapes set to follow inflowing Ulrich streamlines for simplicity. We fill the cavities with dust and gas distributions from a disk wind solution (Blandford & Payne 1982, ZTM13).
Protostellar evolution, i.e., internal structure, size and luminosity, is calculated with a multi-zone numerical model (Hosokawa & Omukai 2009; Hosokawa et al. 2010) with accretion rate regulated by gradually widening outflow feedback (ZTH14). Half the accretion energy () is released from the disk, partly radiated () and partly driving the disk-wind. The other half is radiated from the boundary layer where the accretion flow hits the protostellar surface (). The total luminosity from the source therefore is .
Thus we self-consistently model core collapse and rotation, disk growth, outflow cavity widening and protostar evolution, based on three initial conditions , and . We assume typical from observations of low-mass prestellar cores (Goodman et al. 1993). affects disk size and shape of rotating inflow streamlines, which although influencing temperatures of inflowing gas near the disk, does not affect envelope temperature as significantly as . Therefore, we defer exploration of variation to a future study. We choose mimicking environments from Taurus-like regions to IRDCs/GC. We set to form a small model grid.
For each initial condition, we sample stages, evenly distributed in time to construct an evolutionary sequence. The first steps start with protostars of and . However, depending on , initial accretion luminosities vary greatly, so total stellar+accretion luminosities range from . At each time step we simulate continuum RT using Monte Carlo code HOCHUNK3D (Whitney et al., 2013) to calculate temperature profiles. Simulations use a 3D grid starting from the stellar surface and covering the whole core. The disk is typically covered by of total radial grid of 1000 zones (finer spacing in inner disk). Four dust opacity types are used in envelope, high density disk, low density disk, and outflow cavity regions (see ZT11 for details). Envelope and disk dust grains have ice mantles; outflow cavity grains are bare. Gas-to-dust mass ratio of 100 is used throughout. Photons composing total are radiated isotropically from the stellar surface following blackbody spectrum of temperature . Photons composing total are launched from the disk with an -disk radial dependence and a gaussian vertical distribution (ZTM13).
We include external illumination of a standard solar neighborhood interstellar radiation field (ISRF) attenuated by clump extinction of given . This may underestimate external illumination in some cases like the GC, where ISRF can be greater (Clark et al. 2013), though high and clump extinction counteracts this. In Orion-like regions, massive young stars may strongly increase external illumination of cores. Higher external illumination in such high regions would further amplify the contrast of the temperatures of the protostellar cores in the low and high environments. Our adopted external illumination sets a lower limit for earliest stage core temperature .
At each time step, spectral energy distributions (SEDs) and IR continuum images are calculated from input density and converged temperature profiles. From the velocity field we can also track material parcels from any initial core position following infall streamlines, and calculate temperature and density evolution of that parcel (, ), needed for further chemical modeling.
Given CO’s important role in studying molecular clouds and in astrochemistry, we focus on modeling CO depletion as an example of the effect of the star-forming environment on chemical evolution. We consider CO depletion onto dust grains, thermal desorption, and cosmic ray (CR) desorption. We adopt timescales for depletion () and thermal desorption () from Visser et al. (2009) (Eqs. 35 and 36) for grains with radius and abundance relative to H nuclei, and unity sticking efficiency. For such grains, depletion timescale is , and thermal desorption timescale is . For the latter, we also assume CO binding energy onto grain ice mantles of , suitable for an ice surface of H2O and CO with abundance ratio 30. The CR desorption timescale () is from Keto & Caselli (2008) (Eq. 11; also Hasegawa & Herbst 1993). For the same grains and assuming CR ionization rate , , independent of temperature and density. Note in a magnetized core/clump, CRs may be absorbed or mirrored, lowering ionization rates by factors (Padovani & Galli 2011), thus increasing by the same factor.
Evolution of relative gas phase CO abundance () is then described via . The shortest timescale among the three processes is at most , much shorter than the star formation or free-fall timescale, in the fastest collapse (highest ) model. So typically we can assume the equilibrium value for , calculated as . Note, is very temperature sensitive. Below , is so long that it is unimportant and CO depletion is determined by the other two processes, . In this case higher temperature and density lead to shorter and lower gas-phase CO abundance (higher depletion factor), but the dependence is weak (). When the temperature reaches , drops very quickly and becomes much shorter than the other two processes, leading to , i.e., most CO molecules in gas phase. Depletion factor is defined . Note, we always assume the same temperature for dust and gas, valid for (Doty & Neufeld, 1997), true for envelopes in most models, except the outer envelope in the case. Here we expect slightly higher dust than gas temperatures because of dust absorption of IR radiation. Then, becomes longer. Dust and gas temperature coupling is even weaker in the outflow cavities, but CO is expected to be mostly in the gas phase and here we anyway focus on the envelope.
3. Results
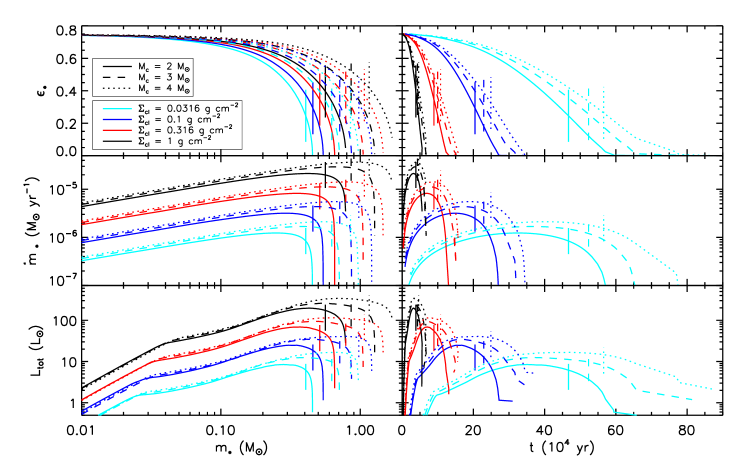
Figure 1 shows evolution of instantaneous star formation efficiency (), protostellar accretion rate, and total luminosity in models with different and . Here with being protostellar accretion rate and being idealized mass growth rate of star+disk in absence of outflow feedback. As the protostar grows, gradual opening up of outflow cavities causes to drop. Such feedback curtails the power-law growth of with (expected for collapse of the adopted singular polytropic core). This accretion rate drop marks end of main accretion phase and start of core clearing phase (defined as ). During the whole evolutionary track, the accretion luminosity significantly exceeds the intrinsic internal stellar luminosity, so total luminosity closely tracks accretion rate evolution, except for minor features due protostellar radius evolution. We see both accretion rate and luminosity depend sensitively on , but less so on . In the highest pressure, environments, accretion rate and luminosity can be higher than in the environment. Star formation timescale is also sensitive to , being much shorter in a high environment, since (McKee & Tan 2003). For a core of given initial mass, final stellar mass also depends on , with a more massive star (i.e., higher star formation efficiency) formed at higher . This is because it is more difficult for outflows to break-out and widen in a denser core.
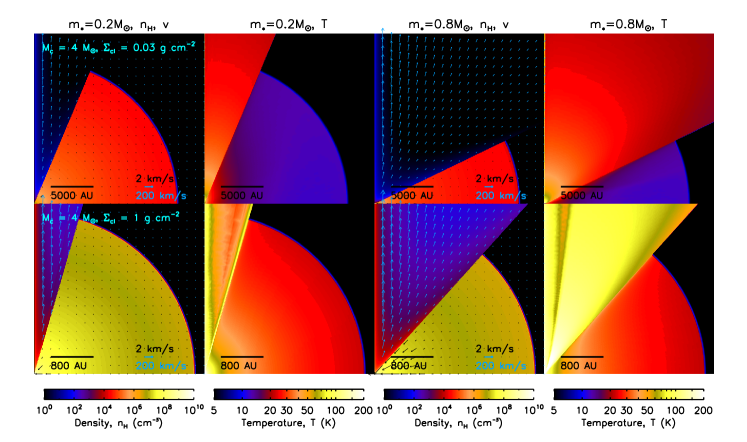
Figure 2 shows examples of input density profiles for the RT simulation and resultant temperature profiles at selected stages () in two models with different , chosen to illustrate extremes of the explored range. Although the ambient clump is important for setting core properties, it is not included explicitly in our RT simulation (i.e., assumed empty outside core boundary), given the extra parameters needed to describe clump density structure. This may lead to a modest underestimation of core temperatures due to back heating from the clump. In both cases, following the evolutionary sequences, we see that outflow cavities widen and core envelopes are being heated up due to increasing luminosities (from 70 to in low case; from 160 to in high case). At same , for high the core is much more compact and denser than for low . The outflow opening angle is also smaller in the high case. Envelope temperatures in this case reach –, significantly warmer than in the low case, which is .
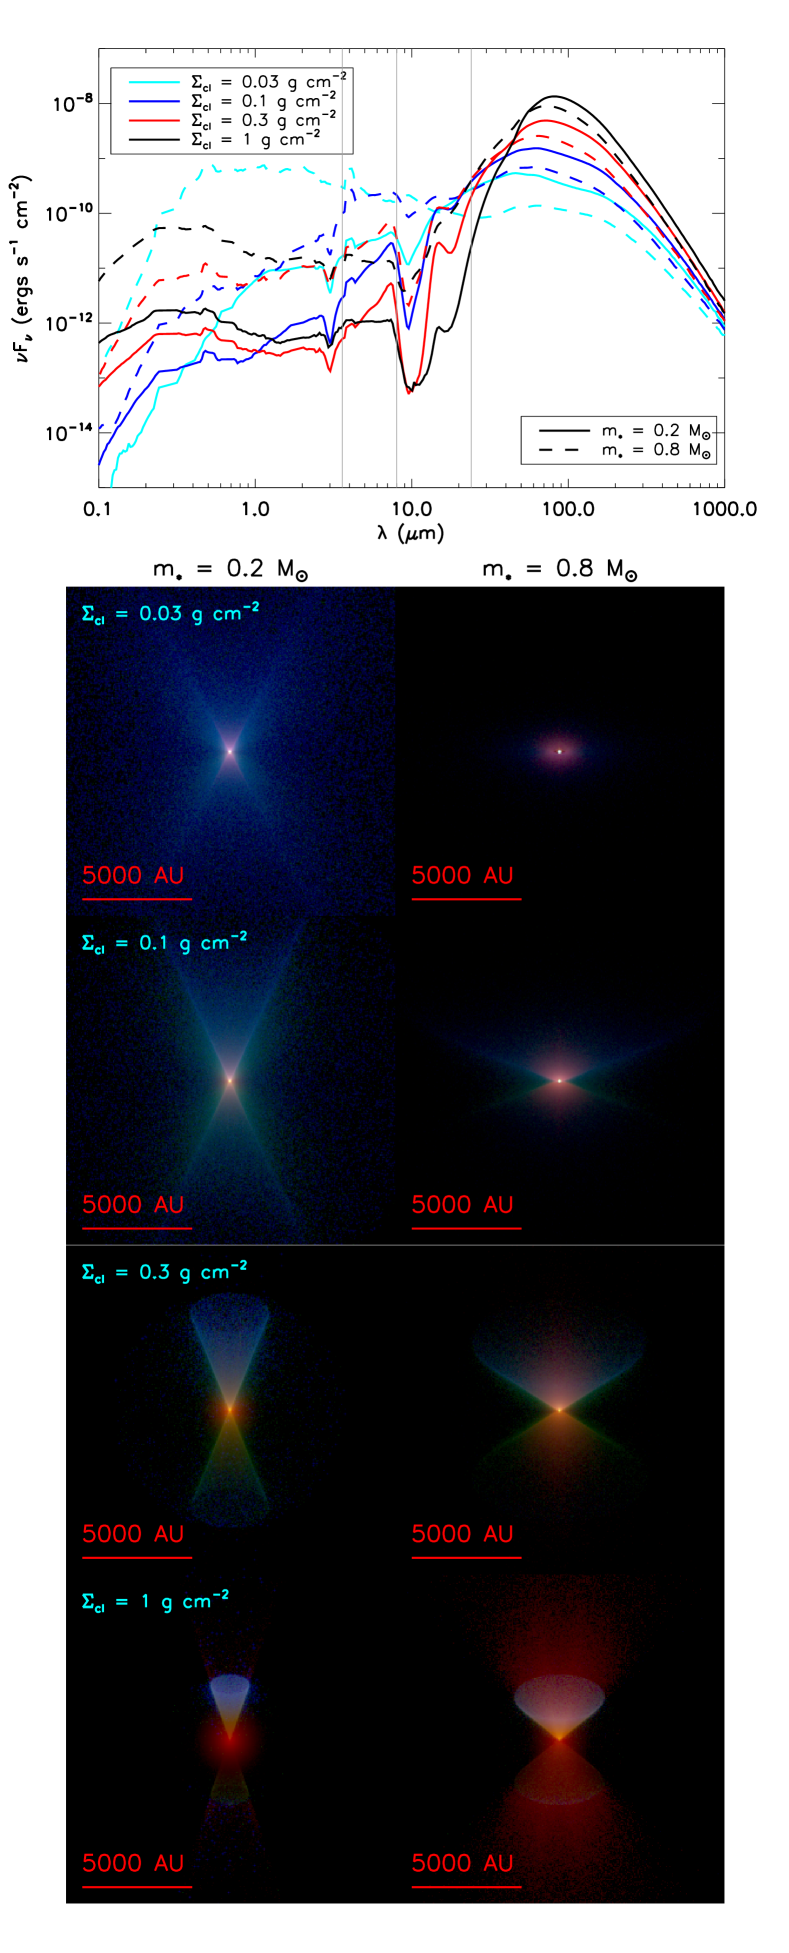
Figure 3 shows simulated SEDs and Spitzer 3-color images at the same two evolutionary stages for models with but four different values. For core with given initial mass and at same , from low to high environments, the FIR SED peak becomes higher and moves to longer wavelengths due to higher luminosity and higher envelope extinction. Higher extinctions also suppress short wavelength fluxes, making the MIR slope steeper than in low environments. IR morphology is also strongly affected by . For low , emission is dominated by the central source and the innermost regions of the envelope and outflow cavity walls. Outflow cavities become the dominant feature as increases. Due to higher extinction of the envelope at higher , the contrast of near- and far-facing outflow cavities becomes higher than for lower s. The source also appears redder in higher environments. As the protostar evolves, shorter wavelength fluxes increase while the FIR peak decreases, which agrees with the transition from Class 0 to Class I sources (André 1995). Outflow cavity widening can be clearly seen from IR morphologies. Due to larger outflow cavities and less dense envelopes, the emission becomes more peaked towards the central source in later stages.
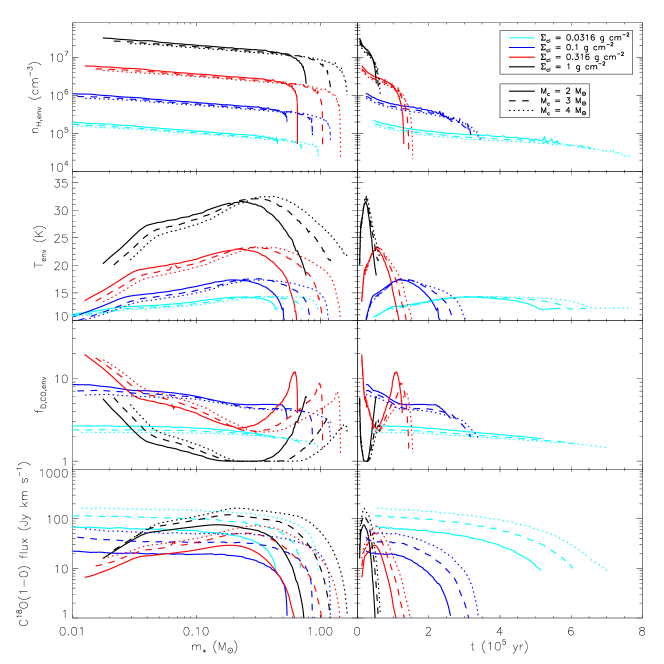
Quantitative dependence of core density and temperature on is shown in the first two rows of Figure 4. Both mass-weighted mean density and temperature are highly dependent on , but less affected by . Cores in higher environments are denser and warmer. In the highest environment, envelope mean temperature reaches , while for low , mean temperature is always between . Potential crowding of stars in high environments could make external illumination significantly higher than the standard ISRF, which would make the envelope even warmer than estimated here, amplifying the contrast between these environments. Note in a high environment the star formation timescale is much shorter so material stays in a warmer state for a shorter time, while in the low environment it stays in a cooler state for a longer time. For each evolutionary track, the envelope density decreases as a power-law as expected for a collapsing polytropic sphere, and quickly decreases in the late stages after the expansion wave reaches the core boundary and self-similarity breaks down. The temperature evolution shows an increase at first and then a drop, mainly due to increase and decrease of the accretion rate and thus luminosity. Outflow cavity widening also contributes to the increase of envelope temperature, as a wider cavity facilitates irradiation by the protostar.
Average envelope CO depletion factors, , are shown in the third row of Figure 4, determined by balance between depletion of molecules onto dust grains and thermal or CR desorption. When , thermal desorption is much faster than the other two processes, leading to very low CO depletion. Thus models with highest have lowest . When , thermal desorption becomes much slower and CO depletion is determined by the other two processes. Since CR desorption timescale is independent of temperature and density, while depletion timescale scales as , CO is more depleted when temperature and density are higher. Therefore models with lowest , which have lower densities and temperatures, also have relatively low . The two intermediate cases with have relatively high CO depletion. In models with lower surface densities (), mean envelope temperature is always and does not vary much during the evolution, since depletion timescale is only weakly dependent on temperature and density. In the two higher surface density environments, CO depletion drops faster at first as the temperature gradually increases to , and then increases again as the envelope cools down. CO depletion drops at the end of the evolutionary tracks as the density quickly declines. CO depletion is not so sensitive to core mass. These different behaviors of CO depletion affect line fluxes of CO and its isotopologues, as shown in the fourth row of Figure 4. For cores with the same mass, line emission (assumed optically thin) is stronger in an environment with either very high or very low , but lower in intermediate environments. Variation can be a factor between cores in different environments.
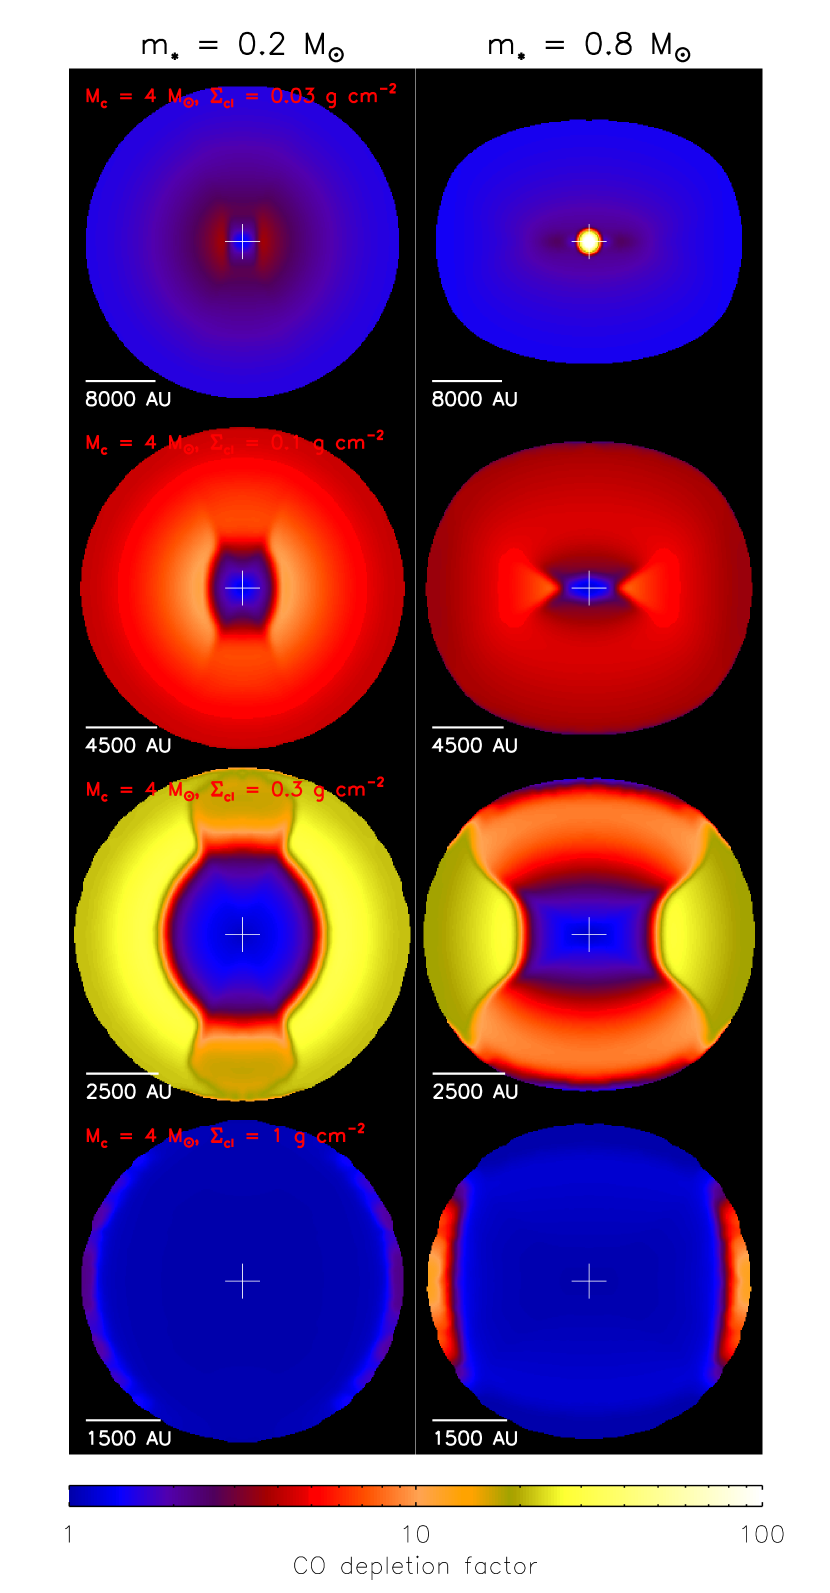
Figure 5 shows simulated CO depletion factor maps of cores in different environments at the two fiducial evolutionary stages. As discussed above, from to , as increases, increases because higher core temperatures and densities in higher environments shorten the depletion timescale. However, near the protostar, depletion is low where cause thermal desorption timescales to be shorter than depletion timescales. For highest almost all the envelope becomes warm enough for efficient thermal desorption and low . Therefore at both extremes of high and low environments, we expect smooth distributions of low CO depletion factor over the protostellar core, but in environments with intermediate –, we expect higher CO depletion towards the outer core and a low CO depletion hole towards the center. Such distributions of may be tested observationally.
4. Conclusions
We investigated how mass surface densities, , of star-forming regions affect thermal and chemical evolution of protostellar cores, with implications for infrared morphologies and CO depletion. In high , high-pressure environments, cores of given mass are more compact, denser, collapse with higher accretion rates, forming more luminous protostars with higher efficiencies that lead to warmer infall envelopes. When , the mean temperature is . It rises to in the highest case. As increases, infrared morphologies reveal more dominant outflow cavities that show greater asymmetry between near- and far-facing sides. CO depletion factors are small at low , since cores have low densities leading to low rates of adhesion of molecules to dust. rises at intermediate as cores become denser, but there is a central warm, low-depletion region. This grows for more luminous protostars and for the high case it encompasses the entire core envelope over most of the evolution.
Further implications of these models for: disk structure and possible fragmentation for binary formation (Kratter et al. 2010) with fragmentation via gravitational instability being easier in larger, cooler disks; more general astrochemical evolution (Visser et al. 2011) in the infall envelope and disk; and for dust grain coagulation in these phases (Birnstiel et al. 2012), remain to be investigated in future studies.
References
- André (1995) André, P. 1995, Astrophysics and Space Science, 224, 29
- Battersby et al. (2014) Battersby, C., Ginsburg, A., Bally, J., Longmore, S., Dunham, M., Darling, J., 2014, ApJ, 787, 113
- Birnstiel et al. (2012) Birnstiel, T., Klahr, H. & Ercolano, B. 2012, A&A, 539, 148
- Blandford & Payne (1982) Blandford, R. D., Payne, D., G., 1982, MNRAS, 199, 883
- Bonnell et al. (2001) Bonnell, I. A., Bate, M. R., Clarke, C. J., Pringle, J. E., 2001, MNRAS, 323, 785
- Butler & Tan (2012) Butler, M. J., Tan, J. C., 2012, ApJ, 754, 5
- Clark et al. (2013) Clark, P. C., Glover, S. C. O., Ragan, S. E., Shetty, R., Klessen, R. S., 2013, ApJL, 768, L34
- Doty & Neufeld (1997) Doty, S. D., Neufeld, D. A., 1997, ApJ, 489, 122
- Elmegreen et al. (2014) Elmegreen, B., Hurst, R., Koenig, X., 2014, ApJL, 782, L1
- Frerking et al. (1982) Frerking, M. A., Langer, W. D., Wilson, R. W., 1982, ApJ, 262, 590
- Hincelin et al. (2013) Hincelin, U., Wakelam, V., Commercon, B., Hersant, F., Guilloteau, S., 2013, ApJ, 775, 44
- Goodman et al. (1993) Goodman, A. A., Benson, P. J., Fuller, G. A., Myers, P. C., 1993, ApJ, 406, 528
- Hasegawa & Herbst (1993) Hasegawa, T., Herbst, E., 1993, MNRAS, 261, 83
- Hosokawa & Omukai (2009) Hosokawa, T., Omukai, K., 2009, ApJ, 691, 823
- Hosokawa et al. (2010) Hosokawa, T., Yorke, H. W., Omukai, K., 2010, ApJ, 721, 478
- Keto & Caselli (2008) Keto, E., Caselli, P., 2008, ApJ, 683, 238
- Königl & Pudritz (2000) Königl, A., Pudritz, R. E., 2000, in Protostars and Planets IV, ed. V. Mannings (Tucson: University of Arizona Press), 759
- Kratter et al. (2010) Kratter, K. M., Matzner, C. D., Krumholz, M. R., & Klein, R. I. 2010, ApJ, 708, 1585
- Kryukova et al. (2014) Kryukova, E., Megeath, S. T., Hora, J. L., et al., 2014, ApJ, 148, 11
- Langer & Penzias (1993) Langer, W. D., Penzias, A. A., 1993, ApJ, 408, 539
- Li et al. (2014) Li, Z.-Y., Banerjee, R., Pudritz, R. E., Jorgensen, J. K., Shang, H., Krasnopolsky, R., Maury, A., 2014, in Protostars and Planets VI, eds. H. Beuther, R. Klessen, C. Dullemond, & Th. Henning (University of Arizona Press), in press (arXiv:1401.2219)
- Matzner & McKee (1999) Matzner, C. D., McKee, C. F., 1999, ApJL, 526, L109
- Matzner & McKee (2000) Matzner, C. D., McKee, C. F., 2000, ApJ, 545, 364
- McKee & Tan (2003) McKee, C. F., Tan, J. C., 2003, ApJ, 585, 850
- McLaughlin & Pudritz (1997) McLaughlin, D. E., Pudritz, R. E., 1997, ApJ, 476, 750
- Onishi et al. (1996) Onishi, T., Mizuno, A., Kawamura, A., Ogawa, H., Fukui, Y., 1996, ApJ, 465, 815
- Padovani & Galli (2011) Padovani, M., Galli, D., 2011, A&A, 530, 109
- Plume et al. (1997) Plume, R., Jaffe, D. T., Evans, N. J., Martin-Pintado, J., Gomez-Gonzalez, J., 1997, 476, 730
- Rathborne et al. (2014) Rathborne, J. M., Longmore, S. N., Jackson, J. M., et al., 2014, ApJ, 786, 140
- Robitaille et al. (2006) Robitaille, T. P., Whitney, B. A., Indebetouw, R., Wood, K., Denzmore, P., 2006, ApJS, 167, 256
- Tan et al. (2014) Tan, J. C., Beltran, M. T., Caselli, P., et al. 2014, in Protostars and Planets VI, eds. H. Beuther, R. Klessen, C. Dullemond, & Th. Henning (University of Arizona Press), in press, arXiv:1402.0919
- Ulrich (1976) Ulrich, R. K., ApJ, 210, 377
- Visser et al. (2011) Visser, R., Doty, S. D., van Dishoeck, E. F., 2011, A&A, 534, A132
- Visser et al. (2009) Visser, R., van Dishoeck, E. F., Doty, S. D., Dullemond, C. P., 2009, A&A, 495, 881
- Ward-Thompson et al. (2007) Ward-Thompson, D., Andre, P., Crutcher, R., et al., 2007, in Protostars and Planets V, ed. B. Reipurth, D. Jewitt, & K. Keil (Tucson, AZ: Univ. Arizona Press), 33
- Whitney et al. (2013) Whitney, B. A., Robitaille, T. P., Bjorkman, J. E., et al., 2013, ApJS, 207, 30
- Wilson & Matteucci (1992) Wilson, T. L., Matteucii, F., 1992, A&A Rev., 4, 1
- Zhang & Tan (2011) Zhang, Y., Tan, J. C., 2011, ApJ, 733, 55 (ZT11)
- Zhang et al. (2014) Zhang, Y., Tan, J. C., Hosokawa, T., 2014, ApJ, 788, 166 (ZTH14)
- Zhang et al. (2013) Zhang, Y., Tan, J. C., McKee, C. F., 2013, ApJ, 766, 86 (ZTM13)