Local structure of semicrystalline P3HT films probed by nanofocused coherent x-rays†
Ruslan P. Kurta,a∗ Linda Grodd,b Eduard Mikayelyan,b Oleg Y. Gorobtsov,a,c Ivan A. Zaluzhnyy,a,d Ilaria Fratoddi,e Iole Venditti,f Maria Vittoria Russo,f Michael Sprung,a Ivan A. Vartanyantsa,d‡ and S. Grigorian
Received Xth XXXXXXXXXX 20XX, Accepted Xth XXXXXXXXX 20XX
First published on the web Xth XXXXXXXXXX 200X
DOI: 10.1039/b000000x
We present results of an x-ray study of structural properties of semicrystalline polymer films using nanofocused x-ray beam. We applied the x-ray cross-correlation analysis (XCCA) to scattering data from blends of poly(3-hexylthiophene) (P3HT) embedded with gold nanoparticles (AuNPs). Spatially resolved maps of orientational distribution of crystalline domains allow us to distinguish sample regions of predominant face-on morphology, with a continuous transition to edge-on morphology. The average size of crystalline domains was determined to be of the order of . As compared to pristine P3HT film, the P3HT/AuNPs blend is characterized by substantial ordering of crystalline domains, which can be induced by Au nanoparticles. The inhomogeneous structure of the polymer film is clearly visualized on the spatially resolved nanoscale 2D maps obtained using XCCA. Our results suggest that the observed changes of the polymer matrix within crystalline regions can be attributed to nanoconfinement in the presence of gold nanoparticles.
1 Introduction
Semicrystalline conjugated polymers are promising cost-effective candidates for organic electronic devices 1, 2, 3. Among different conjugated polymers, polythiophenes received increasing attention in recent years due to their attractiveness for organic field-effect transistors (OFET) and solar cell applications 4, 5, 6, 7, 8, 9. Typical features of these polymers are mixtures of poor and well organized domains 10, 11. Usually, well organized domains are addressed to be crystalline and it is assumed that their presence strongly improves device performance 12, 13, 14, 15. Controlling the morphology and orientation of the crystalline domains in polymer films is a crucial step for the fabrication process, since it determines key electronic properties of the material, such as charge carrier mobility and charge separation, and defines the overall device performance 16, 15, 9.
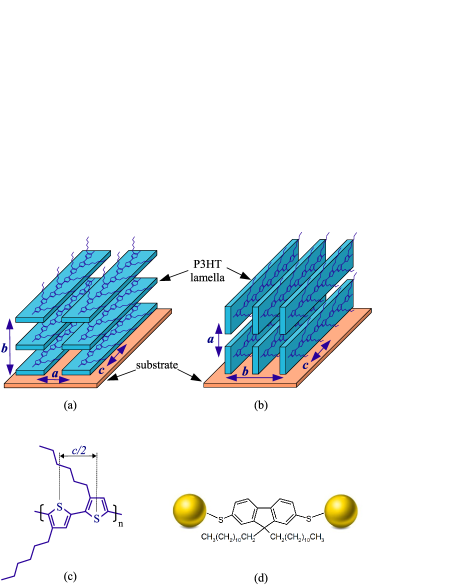
One of the most studied polythiophenes is poly(3-hexylthiophene) (P3HT) [see Fig. 1(c)] with crystalline domain sizes varying from tens to few hundreds of nanometers, depending on preparation techniques 17, 18, 10. In many cases two predominant morphologies, termed edge-on and face-on, can be observed for pristine P3HT 19, 15. They are defined by a different orientation of crystalline domains with respect to the substrate. P3HT lamellae stack parallel to the substrate in the case of face-on domains [Fig. 1(a)], and perpendicular in the case of edge-on domains [Fig. 1(b)]. The shortest distance between P3HT layers, called - stacking distance, is equal to , where is a unit cell parameter [Fig. 1(a),(b)]. Mixed orientation of domains also occurs, especially in non annealed samples. Generally, it is assumed that the edge-on orientation of domains enhances OFET performance, while the face-on orientation is favorable for photovoltaic applications 4, 20, 15.
P3HT films can be prepared using various methods, for example, drop-casting, spin-coating, dip-coating or directional crystallization, leading to a different degree of crystallinity and preferred orientation of P3HT domains 5, 21, 15, 22. The formation of a particular morphology of the film is defined by macromolecular parameters (molecular weight, regioregularity, polydispersity, etc), sample growth conditions (e.g., temperature, coating speed) and post-processing (e.g., annealing) 5, 12, 1, 23, 20, 24, 21, 22, 25, 13, 15, 26, 10, 27, 28. It has been demonstrated that thermal annealing of the grown films results in better crystallinity and improved charge carrier mobility 13, 14, 20, 29, 25.
Together with pristine P3HT, its blends of various compositions emerge as another important class of hybrid materials with attractive structural and electronic properties 26, 30, 31. In this work we analyzed structural variations of the P3HT host matrix upon small addition of gold nanoparticles stabilized with fluorene derivatives (AuNPs-SFL) [see Fig. 1(d)]. Such systems have been extensively investigated 32, 33, 34 and are considered to be attractive for optoelectronic applications due to their optical absorption and emission properties, as well as solubility 35, 36, 37.
It is important to characterize the structure of the - conjugated P3HT network on the nanoscale, since charge transport and charge separation are governed by the nanoscale morphology of a polymer film 23, 3, 38. Various techniques, such as x-ray, electron or neutron scattering, atomic force microscopy and transmission electron microscopy, are used to experimentally characterize the sample morphology on different length scales 5, 12, 30, 20. To study structural variations in semicrystalline P3HT films on the nanoscale we performed spatially-resolved coherent x-ray scattering experiment with a nanofocused x-ray beam, in combination with the x-ray cross-correlation analysis (XCCA)39, 40, 41, 42, 43. A nanosize x-ray probe provides access to the local structure of a polymer film, and XCCA gives information on orientational ordering on a larger length scales. XCCA is a newly developed technique for structural characterization of partially ordered samples 44, 45, 46, 47. Our approach provides information which is complementary to results of conventional small angle x-ray scattering (SAXS) or grazing incidence x-ray diffraction (GIXD) experiments 26, 25.
This paper is organized as follows. In the next section we provide a short theoretical basis for the XCCA technique applied for data analysis. The description of the experimental setup, sample preparation and measurement scheme are presented in the third section of the paper. In the fourth section results of the data analysis are presented, where the average and spatially resolved structural properties of the film are considered separately. The conclusions section completes the paper.
2 Theory
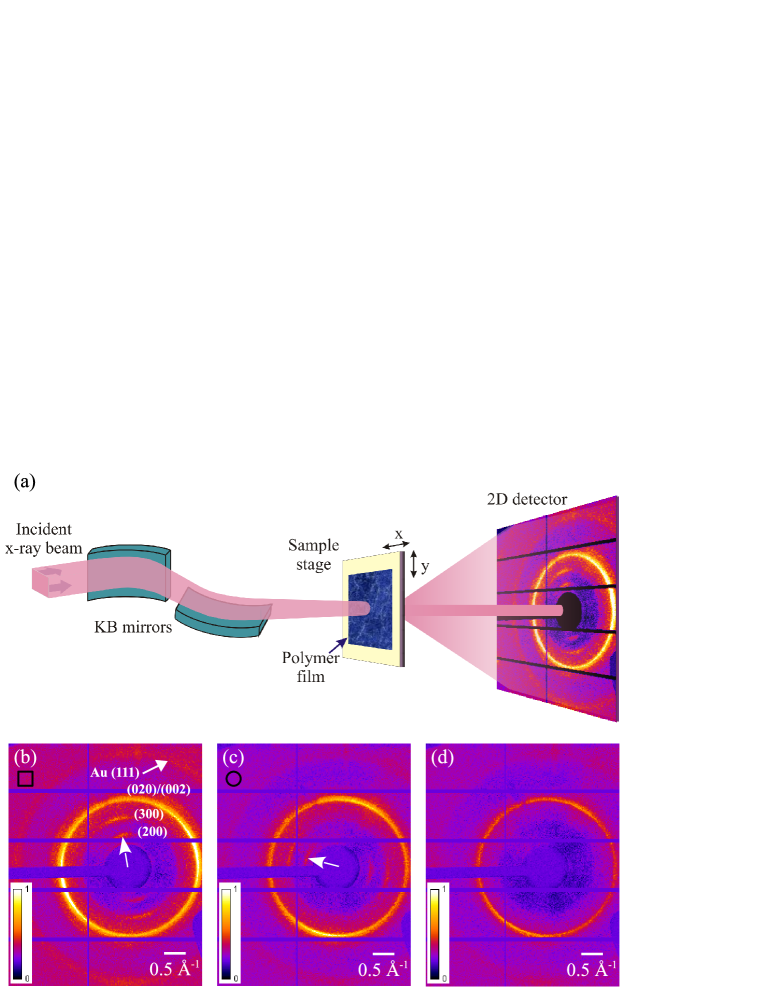
We consider coherent x-ray scattering from a partially ordered polymer film in transmission geometry, as it is shown in Fig. 2(a). For each diffraction pattern the measured intensity distribution can be considered in a polar coordinate system, where the momentum transfer vector is defined by the radial and angular components. The scattered intensity can be expanded into angular Fourier series as
| (1) |
where are, in general, complex Fourier components of intensity with the amplitudes and phases . In can be shown that for , where denotes the angular average of the scattered intensity around the ring of a radius 40. The relation was used in Eq. (1) due to the fact that measured intensities are always real quantities.
XCCA enables direct determination of the Fourier components from a set of diffraction patterns measured at different positions on the sample 40, 41. The two-point cross-correlation function (CCF) can be defined as 47
| (2) |
where is the angular coordinate, and and indicate intensities measured on the -th and -th diffraction patterns, respectively. We would like to note, that in Eq. (2) the CCF can be determined on two different diffraction patterns , or individual diffraction pattern . In the latter case Eq. (2) reduces to the well-known CCF often used in the literature 40, 41.
The CCF can be analyzed using a Fourier series decomposition similar to Eq. (1)
| (3) |
where are the complex Fourier components of the CCF, with the corresponding amplitudes and phases . It can be shown 40, 41, 42, 43, 47 that , where the Fourier components of intensity and are defined for the -th and -th diffraction patterns, respectively. Particularly, in the case of the Fourier components are real , with
| (4) |
for , and for .
It has been demonstrated 41 that in the case of a system of identical particles with a substantial orientational order, the Fourier components calculated for different realizations of such a system qualitatively resemble a spectrum corresponding to a single particle. This enables spatially resolved analysis of the diffraction data measured at each individual position of the sample. In the case of a disordered system the Fourier components fluctuate from position to position on the sample 40, 41, 42, 43 and averaging over a large number of realizations of the system can be applied to get a statistical result,
| (5) |
where the averaging of is performed over pairs of diffraction patterns with , or diffraction patterns in the case of . It can be shown that for (see section 1.1 in the ESI†), for a completely disordered system without any angular correlation between diffraction patterns measured at different positions on the sample . Nonzero values of indicate the presence of background contributions in the scattered signal.
The experimentally determined spectrum may contain both, sample and background scattering contributions. To remove background contribution from the following difference spectrum 47 can be used for analysis,
| (6) |
Such difference spectrum facilitates identification of Fourier components that are caused only by the sample structure.
3 Experimental
The coherent x-ray scattering experiment was performed at the nanoprobe endstation GINIX 48 installed at the coherence beamline P10 of the PETRA III facility at DESY in Hamburg. The scattering geometry of the experiment is shown in Fig. 2(a). The incident photon energy was chosen to be and a 2D detector was positioned in transmission geometry at distance from the sample and protected by a beamstop of in diameter. The scattering data were recorded on a hybrid-pixel detector Pilatus 1M from Dectris with pixels and a pixel size of .
The sample was mounted on a goniometer, and a film was aligned with its surface perpendicular to the direction of the incident beam. The beam with a flux of about was focused on the sample with Kirkpatrick-Baez (KB) mirrors to a spot of about (FWHM). The sample was scanned in the plane perpendicular to the incident beam direction. The sample area of was scanned on the raster grid with a step size in both directions and the total number of positions. Cryogenic cooling of the film with liquid nitrogen was used during measurements to reduce radiation damage. The exposure time was chosen to be per image to perform measurements in a nondestructive regime.
The sample was spin-cast from a blend of P3HT (molecular weight ; PDI 1.22) with gold nanoparticles. Gold nanoparticles of in size stabilized with fluorene derivatives (AuNPs-SFL) have been prepared and characterized in analogy to recent reports 49, 50, 32, 51, 52. A 5 mg/ml blend solution (P3HT:AuNPs-SFL = 10:1 by weight) in chloroform was spin cast on rectangular shaped grids with a 15 nm thick membranes (Dune Sciences, Inc.).
An x-ray dataset consisting of diffraction patterns was measured. The data were corrected for background scattering and polarization of incident x-rays. Typical snapshot diffraction patterns corresponding to two different positions on the sample are shown in Figs. 2(b)-2(d). It is readily seen that the film is inhomogeneous, i.e. it has different structures at distinct sample positions.
4 Results and discussion
We first determine the average structure of the film and then continue with spatially resolved analysis of nanoscale variations of the film properties.
4.1 Spatially averaged structural properties
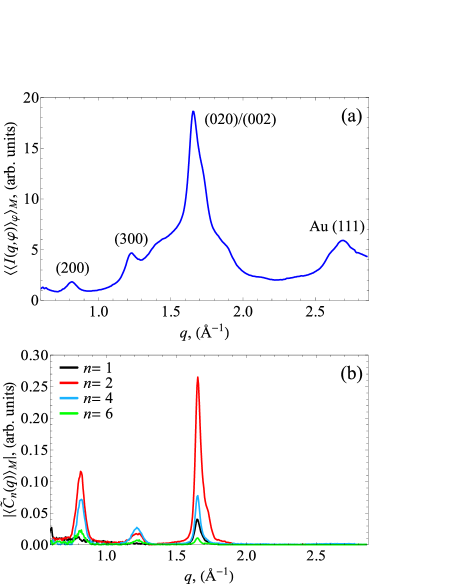
To determine the average structure of the film we first analyzed the ensemble-averaged intensity. The radial intensity averaged over the full dataset in the range of is presented in Fig. 3(a). Our diffraction data suggest that the average structure of crystalline domains can be described with a monoclinic unit cell with parameters and , similar to the model proposed in 27. One can clearly see in Fig. 3(a) the and peaks at and , respectively ***The reflection was covered by the beamstop.. These peaks are defined by the unit cell parameter of crystalline P3HT domains [see Fig. 1], and suggest the presence of the face-on morphology in the sample. The strongest peak at may contain scattering contribution from both and planes, since the and lattice parameters have very close values 25. Due to the fact that crystalline domains may have different orientations in the illuminated sample area, this peak is often considered as 16. Finally, the peak located at is defined by scattering from the set of atomic planes of gold. The corresponding scattering ring at higher momentum transfer values is partially visible on the diffraction patterns shown in Figs. 2(b)-2(d).
To determine the average characteristics of orientational order of P3HT domains, the Fourier spectra (see section 1.1 in the ESI†) and , as well as their difference (Eq. 6) were calculated and averaged over the full dataset [see Fig. 3(b)]. Only Fourier components of the orders and 6 have large contribution to the full spectrum (the others have negligible values). The -dependence of has three local maxima located at the same values as the , and peaks on the average intensity curve [Fig. 3(a)]. The presence of harmonics higher than (up to ) indicates enhanced orientational order of P3HT domains. The nonzero value of the first order Fourier component can be attributed to uncompensated background contribution.
We would like to note, that analysis of diffraction data measured from pristine P3HT films prepared by the same fabrication protocol does not reveal orientational order in the system. For pristine P3HT films all Fourier components of the difference spectra have negligible values. This brings us to the conclusion that in P3HT/AuNPs blends orientational order of crystalline domains is induced by Au nanoparticles. This observation is supported by recent experiments, where improved crystallinity and orientational order were reported for various P3HT blends 31, 53.
The difference spectrum shown in Fig. 3(b) is determined by average nanoscale structural properties of the sample due to the nano-sized x-ray probe applied in the experiment. At the same time, the diffraction patterns shown in Figs. 2(b) and 2(c) clearly indicate structural variations in different parts of the sample. The major difference between these diffraction patterns is determined by the and peaks present in low -region, that can be attributed to the face-on orientation of P3HT domains [Fig. 2(b),(c)]. Both peaks are absent in Fig. 2(d) where only the scattering ring can be observed, that is characteristic for the edge-on orientation. Therefore, it is important to characterize the structure of the polymer film at each separate position defined by the x-ray probe.
4.2 Spatially resolved structural properties
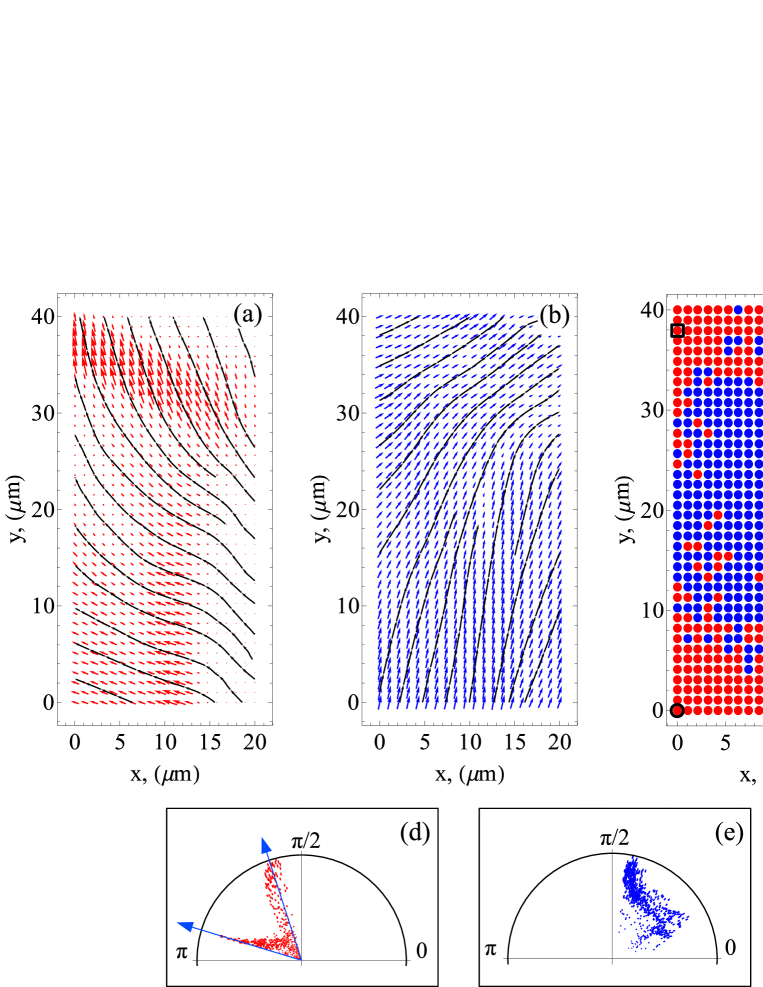
To determine spatially resolved nanoscale information about the structure of the film we analyzed diffraction patterns and corresponding Fourier spectra of intensity at each spatial position of the sample. To analyze local orientational distribution of domains we directly applied Eq. (1) and determined the phases of the dominant second order Fourier components . This Fourier component has the largest contribution in the spectrum and its phase determines local orientation of P3HT domains in the film. We determine the distribution of orientations of crystalline P3HT domains across the sample using two-dimensional (2D) vector fields shown in Figs. 4(a) and 4(b). Each vector in these figures is defined by the amplitude and phase of the Fourier component , determined at the positions of the [Fig. 4(a)] and [Fig. 4(b)] peaks, respectively. Figs. 4(d) and 4(e) represent all available orientations shown in Figs. 4(a) and 4(b) in the form of angular diagrams.
The distribution of the magnitudes and orientations of the vectors in Figs. 4(a) and 4(b) shows that the film is not uniform. As it follows from Figs. 4(d) and 4(e), all phases are distributed in the angular range of in Fig. 4(a), and in the range of in Fig. 4(b). A comparison of vector orientations in Figs. 4(a) and 4(b) allows us to partition the sample area into two major regions [see Fig. 4(c)] according to the value of the phase difference calculated at each spatial position.
The first region [red points in Fig. 4(c)] is characterized with a strong correlation between the vector orientations in Figs. 4(a) and 4(b), and the phase difference in the range of angles . This suggests a presence of a certain preferential P3HT morphology in this region, that preserves angular orientation of the and peaks with respect to each other at each particular position. Since our samples were prepared in the same way as in Ref. 20, where the face-on oriented domains were mainly observed, we conclude that the face-on morphology is preferential in this region. In this case, the main contribution to the peak at is defined by the -planes [i.e., by the peak]. As one can see in Fig. 4(c), two separated areas of the sample are characterized with dominating face-on morphology but different orientations, indicated with two arrows in Fig. 4(d). Quite naturally these regions coincide with the areas in Fig. 4(a) where the magnitudes are large since the face-on morphology in the given scattering geometry is primarily associated with a peak.
The second region of the film [blue points in Fig. 4(c)] is characterized with a larger spread of the phase difference, . One can see in Figs. 4(a) and 4(b), that both vector fields are characterized with a smooth change of the magnitudes and orientations of the vectors. At the same time, distribution of the magnitudes of the vectors in Fig. 4(b) is more uniform than in Fig. 4(a). It is about of the vectors in Fig. 4(a) have magnitudes smaller than of the largest vector, while less than of the vectors in Fig. 4(b) satisfy similar condition. This all suggests that in the second region a mixed orientation of domains is observed, and a continuous transition from the face-on towards the edge-on morphology is achieved by rotation of the face-on domains around the -axis [see Fig. 1]. It is important to note, that such a conclusion can be drawn only from a simultaneous analysis of both vector fields in Figs. 4(a) and 4(b), while separate analysis of each peak does not reflect a real distribution of domain types.
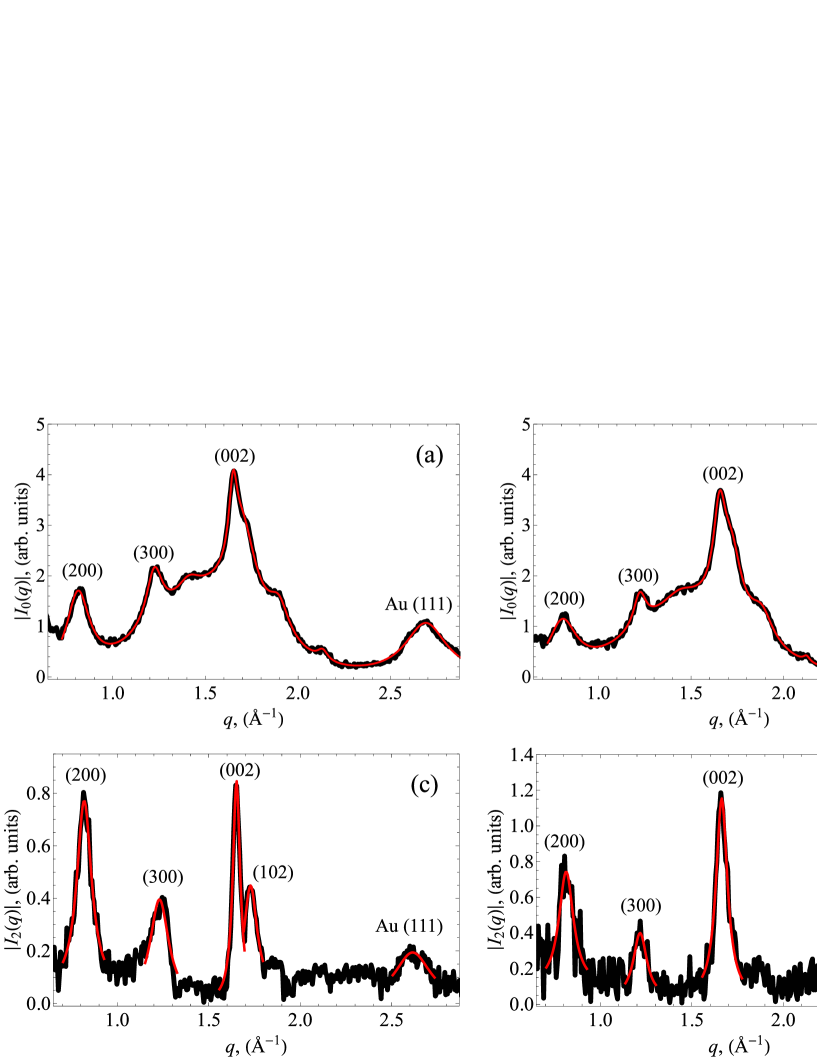
A smooth distribution of the phases and magnitudes of the Fourier components across the sample shown in Figs. 4(a) and 4(b) indicates a substantial orientational order in the polymer film and confirms applicability of the spatially resolved XCCA to such a system. As a step further, we applied the CCF to individual diffraction patterns to access hidden structural features of the film with an increased accuracy (see section 1.2 in the ESI†). In this case the Fourier components of intensity were determined using the relation (see Eq. 4). In Fig. 5 the magnitudes of the Fourier components of the orders and are presented as a function of for two diffraction patterns measured at different sample positions with the predominant face-on morphology. One can see that the -dependence of provides additional structural details that can not be directly observed in the angular averaged profile , that is usually analyzed in scattering experiments. For example, the peak indexed as on the profile can be clearly separated from the peak in Fig. 5(c), and is not visible in Fig. 5(d), indicating slightly different orientation of the face-on domains at these positions. This cannot be directly seen from the profiles shown in Figs. 5(a) and 5(b).
We determined the positions of the centers and magnitudes of different peaks in and profiles as a function of the probe position on the sample. These peaks were fitted with a Lorentzian function (see Fig. 5), , where is a background correction, is a scaling coefficient, is half-width at half-maximum (HWHM) of the peak, and is a center of the peak. Analysis of the peak on the profile (see section 1.3 in the ESI†), gives the average positional correlation length of the order of . This value is in agreement with a characteristic size of P3HT crystalline domains 20, 26.
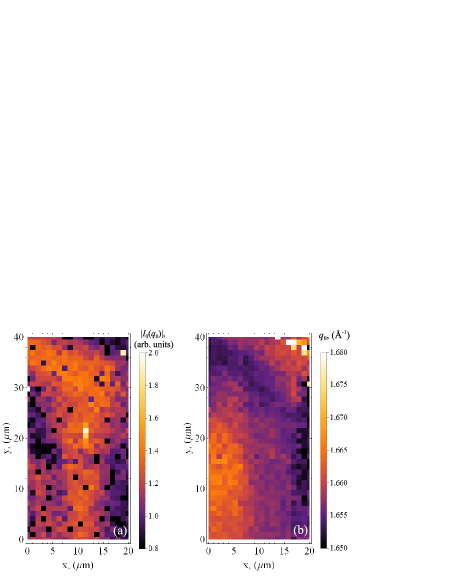
In Fig. 6(a) a 2D map of the magnitudes of the Au peak is shown, determined from the fit of the peak on the profile. As one can see, gold nanoparticles are not uniformly distributed across the film, the regions with high gold concentration correspond to large values of Au peak magnitude. A 2D map of the P3HT peak center position determined from the profile is shown in Fig. 6(b). One can clearly see a smooth variation of the peak position, that indicates changes of the unit cell parameter across the film in the range from to . In the regions with higher gold concentration the peak slightly shifts to lower . This observation suggests that Au nanoparticles could influence the structure of P3HT crystalline regions, particularly cause relaxation of the -spacing in the P3HT backbone [see Fig. 1].
5 Conclusions
The x-ray scattering experiment with a nanofocused beam in combination with XCCA allowed us to reveal details of the nanoscale structure of semicrystalline films cast from P3HT/AuNPs blend. We explored spatially resolved and average properties of the films by 2D mapping various structural parameters. One of the prominent results obtained in our work is orientational distribution of crystalline domains that allowed us to distinguish sample regions with predominant face-on and mixed orientation of domains. Our results suggest that a continuous transition between different morphologies is achieved by rotation of the domains around the -axis defined along the P3HT backbone.
The polymer film is characterized by substantial orientational ordering of crystalline domains, that is defined by the presence of higher order ( and ) Fourier components of the cross-correlation function. As a result of our analysis we conclude that orientational order of P3HT domains can be induced by Au nanoparticles. Spatially resolved 2D maps show inhomogeneities in the spatial distribution of Au nanoparticles, where the regions with a high concentration of AuNPs coincide with regions where structural relaxation of P3HT matrix is observed. The average size of crystalline domains was determined to be of the order of .
The obtained results demonstrate that XCCA provides valuable information about the structure of partially ordered materials, complementary to the conventional SAXS or GIXD analysis. Spatially resolved analysis of the Fourier spectra of CCFs allows to observe structural features hidden in the averaged SAXS intensity, and to determine nanoscale variation and interplay between different film parameters. It is an irreplaceable tool to observe local structural changes in P3HT conjugated network induced by Au nanoparticles. As shown here, XCCA has a significant potential to be used as sensitive tool for nanoscale characterization of nanocomposite materials.
6 Acknowledgements
We are grateful to S. Allard and U. Scherf from the University of Wuppertal, Germany for synthesis of the P3HT material. We are thankful to the group of T. Salditt, especially to M. Osterhoff and S. Kalbfleisch, for providing support of the Göttingen instrument for nano-imaging with x-rays (GINIX), and also A. Zozulya for the help during the experiment. We acknowledge fruitful discussions and support of this project by E. Weckert. We gratefully acknowledge U. Pietsch for helpful discussions. Part of this work was supported by BMBF Proposal 05K10CHG “Coherent Diffraction Imaging and Scattering of Ultrashort Coherent Pulses with Matter” in the framework of the German-Russian collaboration “Development and Use of Accelerator-Based Photon Sources” and the Virtual Institute VH-VI-403 of the Helmholtz Association, the Department of Chemistry of the Sapienza University of Rome through the Supporting Research Initiative 2013 and BMBF (project Nr 05K3PS4).
References
- Kline et al. 2005 R. J. Kline, M. D. McGehee, E. N. Kadnikova, J. Liu, J. M. J. Fréche and M. F. Toney, Macromolecules, 2005, 38, 3312.
- Majewski et al. 2006 L. A. Majewski, J. W. Kingsley, C. Balocco and A. M. Song, Appl. Phys. Lett., 2006, 88, 222108.
- Coakley and McGehee 2004 K. Coakley and M. McGehee, Appl. Phys. Lett., 2004, 16, 4533.
- Sirringhaus et al. 1999 H. Sirringhaus, P. J. Brown, R. H. Friend, M. M. Nielsen, K. Bechgaard, B. M. W. Langeveld-Voss, A. J. H. Spiering, R. A. J. Janssen, E. W. Meijer, P. Herwig and D. M. de Leeuw, Nature, 1999, 401, 685.
- Salleo et al. 2010 A. Salleo, R. J. Kline, D. M. Delongchamp and M. L. Chabinyc, Adv. Mater., 2010, 22, 3812.
- Dang et al. 2011 M. T. Dang, L. Hirsch and G. Wantz, Adv. Mater., 2011, 23, 3597.
- Krebs et al. 2013 F. C. Krebs, N. Espinosa, M. Hösel, R. R. Sondergaard and M. Jorgensen, Adv. Mater., 2013, 26, 29.
- Y. Kim et al. 2006 Y. Y. Kim, S. Cook, S. M. Tuladhar, S. A. Choulis, J. N. J. R. Durrant, D. D. C. Bradley, M. Giles, I. McCulloch, C.-S. Ha and M. A. Ree, Macromolecules, 2006, 39, 5843.
- Nagarjuna and Venkataraman 2012 G. Nagarjuna and D. Venkataraman, J. Polym. Sci., 2012, 50, 1045.
- Kohn et al. 2012 P. Kohn, S. Hüttner, H. Komber, V. Senkovskyy, R. Tkachov, A. Kiriy, R. H. Friend, U. Steiner, W. T. S. Huck, J.-U. Sommer and M. Sommer, J. Am. Chem. Soc., 2012, 134, 4790.
- Brinkmann and Rannou 2007 M. Brinkmann and P. Rannou, Adv. Funct. Mater., 2007, 17, 101.
- Kline et al. 2003 R. J. Kline, M. D. McGehee, E. N. Kadnikova, J. Liu and J. M. J. Fréchet, Adv. Mater., 2003, 15, 1519.
- A. Zen et al. 2004 A. A. Zen, J. Pflaum, S. Hirschmann, W. Zhuang, F. Jaiser, U. Asawapirom, J. P. Rabe, U. Scherf and D. Neher, Adv. Funct. Mater., 2004, 14, 757.
- Ali et al. 2013 K. Ali, U. Pietsch and S. Grigorian, J. Appl. Cryst., 2013, 46, 908.
- Tanigaki et al. 2014 N. Tanigaki, Y. Ikeo, T. Mizokuro, C. Heck and H. Aota, Jap. J. Appl. Phys., 2014, 53, 01AB05.
- Joshi et al. 2008 S. Joshi, S. Grigorian, U. Pietsch, P. Pingel, A. Zen, D. Neher and U. Scherf, Macromolecules, 2008, 41, 6800.
- Prosa et al. 1992 T. J. Prosa, M. J. Winokur, J. Moulton, P. Smith and A. J. Heeger, Macromolecules, 1992, 25, 4364.
- Rahimi et al. 2012 K. Rahimi, I. Botiz, N. Stingelin, N. Kayunkid, M. Sommer, F. P. Koch, H. Nguyen, O. Coulembier, P. Dubois, M. Brinkmann and G. Reiter, Angew. Chem. Int. Ed. Engl., 2012, 51, 11131.
- Kim et al. 2006 D. H. Kim, Y. Jang, Y. D. Park and K. Cho, Macromolecules, 2006, 39, 5843.
- Salammal et al. 2012 T. S. Salammal, E. Mikayelyan, S. Grigorian, U. Pietsch, N. Koenen, U. Scherf, N. Kayunkid and M. Brinkmann, Macromolecules, 2012, 45, 5575.
- Shabi et al. 2012 T. S. Shabi, S. Grigorian, M. Brinkmann, U. Pietsch, N. Koenen, N. Kayunkid and U. Scherf, J. Appl. Polym. Sci., 2012, 2335.
- Brinkmann and Wittmann 2006 M. Brinkmann and J. C. Wittmann, Adv. Mater., 2006, 18, 860.
- Hoppe and Sariciftci 2004 H. Hoppe and N. Sariciftci, J. Mater. Res., 2004, 19, 1924.
- Zhang et al. 2006 R. Zhang, B. Li, C. M. Iovu, M. Jeffries-EL, G. Sauve, J. Cooper, S. Jia, S. Tristram-Nagle, D. M. Smilgies, D. N. Lambeth, R. D. McCullough and T. Kowalewski, J. Am. Chem. Soc., 2006, 128, 3480.
- Grigorian et al. 2010 S. Grigorian, S. Joshi and U. Pietsch, IOP Conf. Series: Mat. Sci. and Engineering, 2010, 14, 012007.
- Kohn et al. 2013 P. Kohn, Z. Rong, K. H. Scherer, A. Sepe, M. Sommer, P. Müller-Buschbaum, R. H. Friend, U. Steiner and S. Hüttner, Macromolecules, 2013, 46, 4002.
- Kayunkid et al. 2010 N. Kayunkid, S. Uttiya and M. Brinkmann, Macromolecules, 2010, 43, 4961.
- Newbloom et al. 2012 G. M. Newbloom, K. M. Weigandt and D. C. Pozzo, Macromolecules, 2012, 45, 3452.
- Joshi et al. 2009 S. Joshi, P. Pindel, S. Grigorian, T. Panzner, U. Pietsch, D. Neher, M. Forster and U. Scherf, Macromolecules, 2009, 42, 4651.
- Moghaddam et al. 2013 R. S. Moghaddam, S. Huettner, Y. Vaynzof, C. Ducati, G. Divitini, R. H. Lohwasser, K. P. Musselman, A. Sepe, M. R. J. Scherer, M. Thelakkat, U. Steiner and R. H. Friend, Nano Lett., 2013, 13, 4499.
- Parashchuk et al. 2013 O. Parashchuk, S. Grigorian, E. Levin, V. Bruevich, K. Bukunova, I. Golovnin, T. Dittrich, K. Dembo, V. Volkov and D. Paraschuk, J. Phys. Chem. Lett, 2013, 4, 1298.
- Quintiliani et al. 2014 M. Quintiliani, M. Bassetti, C. Pasquini, C. Battocchio, M. Rossi, F. Mura, R. Matassa, L. Fontana, M. V. Russo and I. Fratoddi, J. Mater. Chem. C, 2014, 2, 2517.
- Battocchio et al. 2014 C. Battocchio, F. Porcaro, S. Mukherjee, E. Magnano, S. Nappini, I. Fratoddi, M. Quintiliani, M. V. Russo and G. Polzonetti, J. Phys. Chem. C, 2014, 118, 8159.
- Battocchio et al. 2014 C. Battocchio, I. Fratoddi, L. Fontana, E. Bodo, F. Porcaro, C. Meneghini, I. Pis, S. Nappini, S. Mobilio, M. V. Russo and G. Polzonetti, Phys. Chem. Chem. Phys., 2014, 16, 11719.
- Venditti et al. 2013 I. Venditti, I. Fratoddi, M. V. Russo and A. Bearzotti, Nanotechnology, 2013, 24, 155503.
- Battocchio et al. 2012 C. Battocchio, C. Meneghini, I. Fratoddi, I. Venditti, M. V. Russo, G. Aquilanti, C. Maurizio, F. Bondino, R. Matassa, M. Rossi, S. Mobilio and G. Polzonetti, J. Phys. Chem. C, 2012, 116, 19571.
- Ghosh and Pal 2007 S. K. Ghosh and T. Pal, Chem. Rev., 2007, 107, 4797.
- Clarke and Durrant 2010 T. M. Clarke and J. R. Durrant, Chem. Rev., 2010, 110, 6736.
- Wochner et al. 2009 P. Wochner, C. Gutt, T. Autenrieth, T. Demmer, V. Bugaev, A. Diaz-Ortiz, A. Duri, F. Zontone, G. Grübel and H. Dosch, Proc. Nat. Acad. Sci., 2009, 106, 11511.
- Altarelli et al. 2010 M. Altarelli, R. P. Kurta and I. A. Vartanyants, Phys. Rev. B, 2010, 82, 104207; Erratum: 2012, 86, 179904(E).
- Kurta et al. 2012 R. P. Kurta, M. Altarelli, E. Weckert and I. A. Vartanyants, Phys. Rev. B, 2012, 85, 184204.
- Kurta et al. 2013 R. P. Kurta, R. Dronyak, M. Altarelli, E. Weckert and I. A. Vartanyants, New J. Phys., 2013, 15, 013059.
- Kurta et al. 2013 R. P. Kurta, M. Altarelli and I. A. Vartanyants, Adv. Cond. Matt. Phys., 2013, 2013, 959835.
- Kurta et al. 2013 R. P. Kurta, B. I. Ostrovskii, A. Singer, O. Y. Gorobtsov, A. Shabalin, D. Dzhigaev, O. M. Yefanov, A. V. Zozulya, M. Sprung and I. A. Vartanyants, Phys. Rev. E, 2013, 88, 044501.
- Schroer et al. 2014 M. A. Schroer, C. Gutt and G. Grübel, Phys. Rev. E, 2014, 90, 012309.
- Liu et al. 2013 A. C. Y. Liu, M. J. Neish, G. Stokol, G. A. Buckley, L. A. Smillie, M. D. de Jonge, R. T. Ott, M. J. Kramer and L. Bourgeois, Phys. Rev. Lett., 2013, 110, 205505.
- Kurta et al. 2014 R. P. Kurta, L. Grodd, E. Mikayelyan, O. Y. Gorobtsov, I. Fratoddi, I. Venditti, M. Sprung, S. Grigorian and I. A. Vartanyants, J.Phys: Conf.Series, 2014, 499, 012021.
- Kalbfleisch et al. 2011 S. Kalbfleisch, H. Neubauer, S. P. Kruger, M. Bartels, M. Osterhoff, D. D. Mai, K. Giewekemeyer, B. Hartmann, M. Sprung and T. Salditt, AIP Conf. Proc., 2011, 1365, 96.
- Fratoddi et al. 2011 I. Fratoddi, I. Venditti, C. Battocchio, G. Polzonetti, F. Bondino, M. Malvestuto, E. Piscopiello, L. Tapfer and M. V. Russo, J. Phys. Chem. C, 2011, 115, 15198.
- Matassa et al. 2012 R. Matassa, I. Fratoddi, M. Rossi, C. Battocchio, R. Caminiti and M. V. Russo, J. Phys. Chem. C, 2012, 116, 15795.
- Vitaliano et al. 2009 R. Vitaliano, I. Fratoddi, I. Venditti, G. Roviello, C. Battocchio, G. Polzonetti and M. V. Russo, J. Phys. Chem. A, 2009, 113, 14730.
- Cametti et al. 2011 C. Cametti, I. Fratoddi, I. Venditti and M. V. Russo, Langmuir, 2011, 27, 7084.
- Wu et al. 2011 W.-R. Wu, U.-S. Jeng, C.-J. Su, K.-H. Wei, M.-S. Su, M.-Y. Chiu, C.-Y. Chen, W.-B. Su, C.-H. Su and A.-C. Su, ASC Nano, 2011, 5, 6233.