THE GAMMA RAY OPACITY OF THE UNIVERSE – INDIRECT MEASUREMENTS OF THE EXTRAGALACTIC BACKGROUND LIGHT
Abstract
Indirect constraints on the intensity of the Extragalactic Background Light (EBL) were provided by recent studies of extragalactic sources emitting sub-TeV to multi-TeV photons. These constraints are provided thanks to the absorption of rays by soft photons from the EBL (UV/optical/IR) via pair production by interactions. This paper provides an overview of recent results that have led to substantially reduced uncertainties on the EBL intensity over a wide range of wavelengths from 0.1 m to 15 m.
1 Introduction
The opacity of intergalactic space to rays due to EBL absorption encodes important information for a host of astrophysical topics and also allows for tests of fundamental particle interactions. From the perspective of ray astronomers, detailed knowledge of the EBL is critical for our understanding of relativistic jets in distant ray blazars and Gamma Ray Bursts, since it is required for the opacity correction [13] of the observed ray spectra, and thereby unveils the intrinsic spectra of these enigmatic sources.
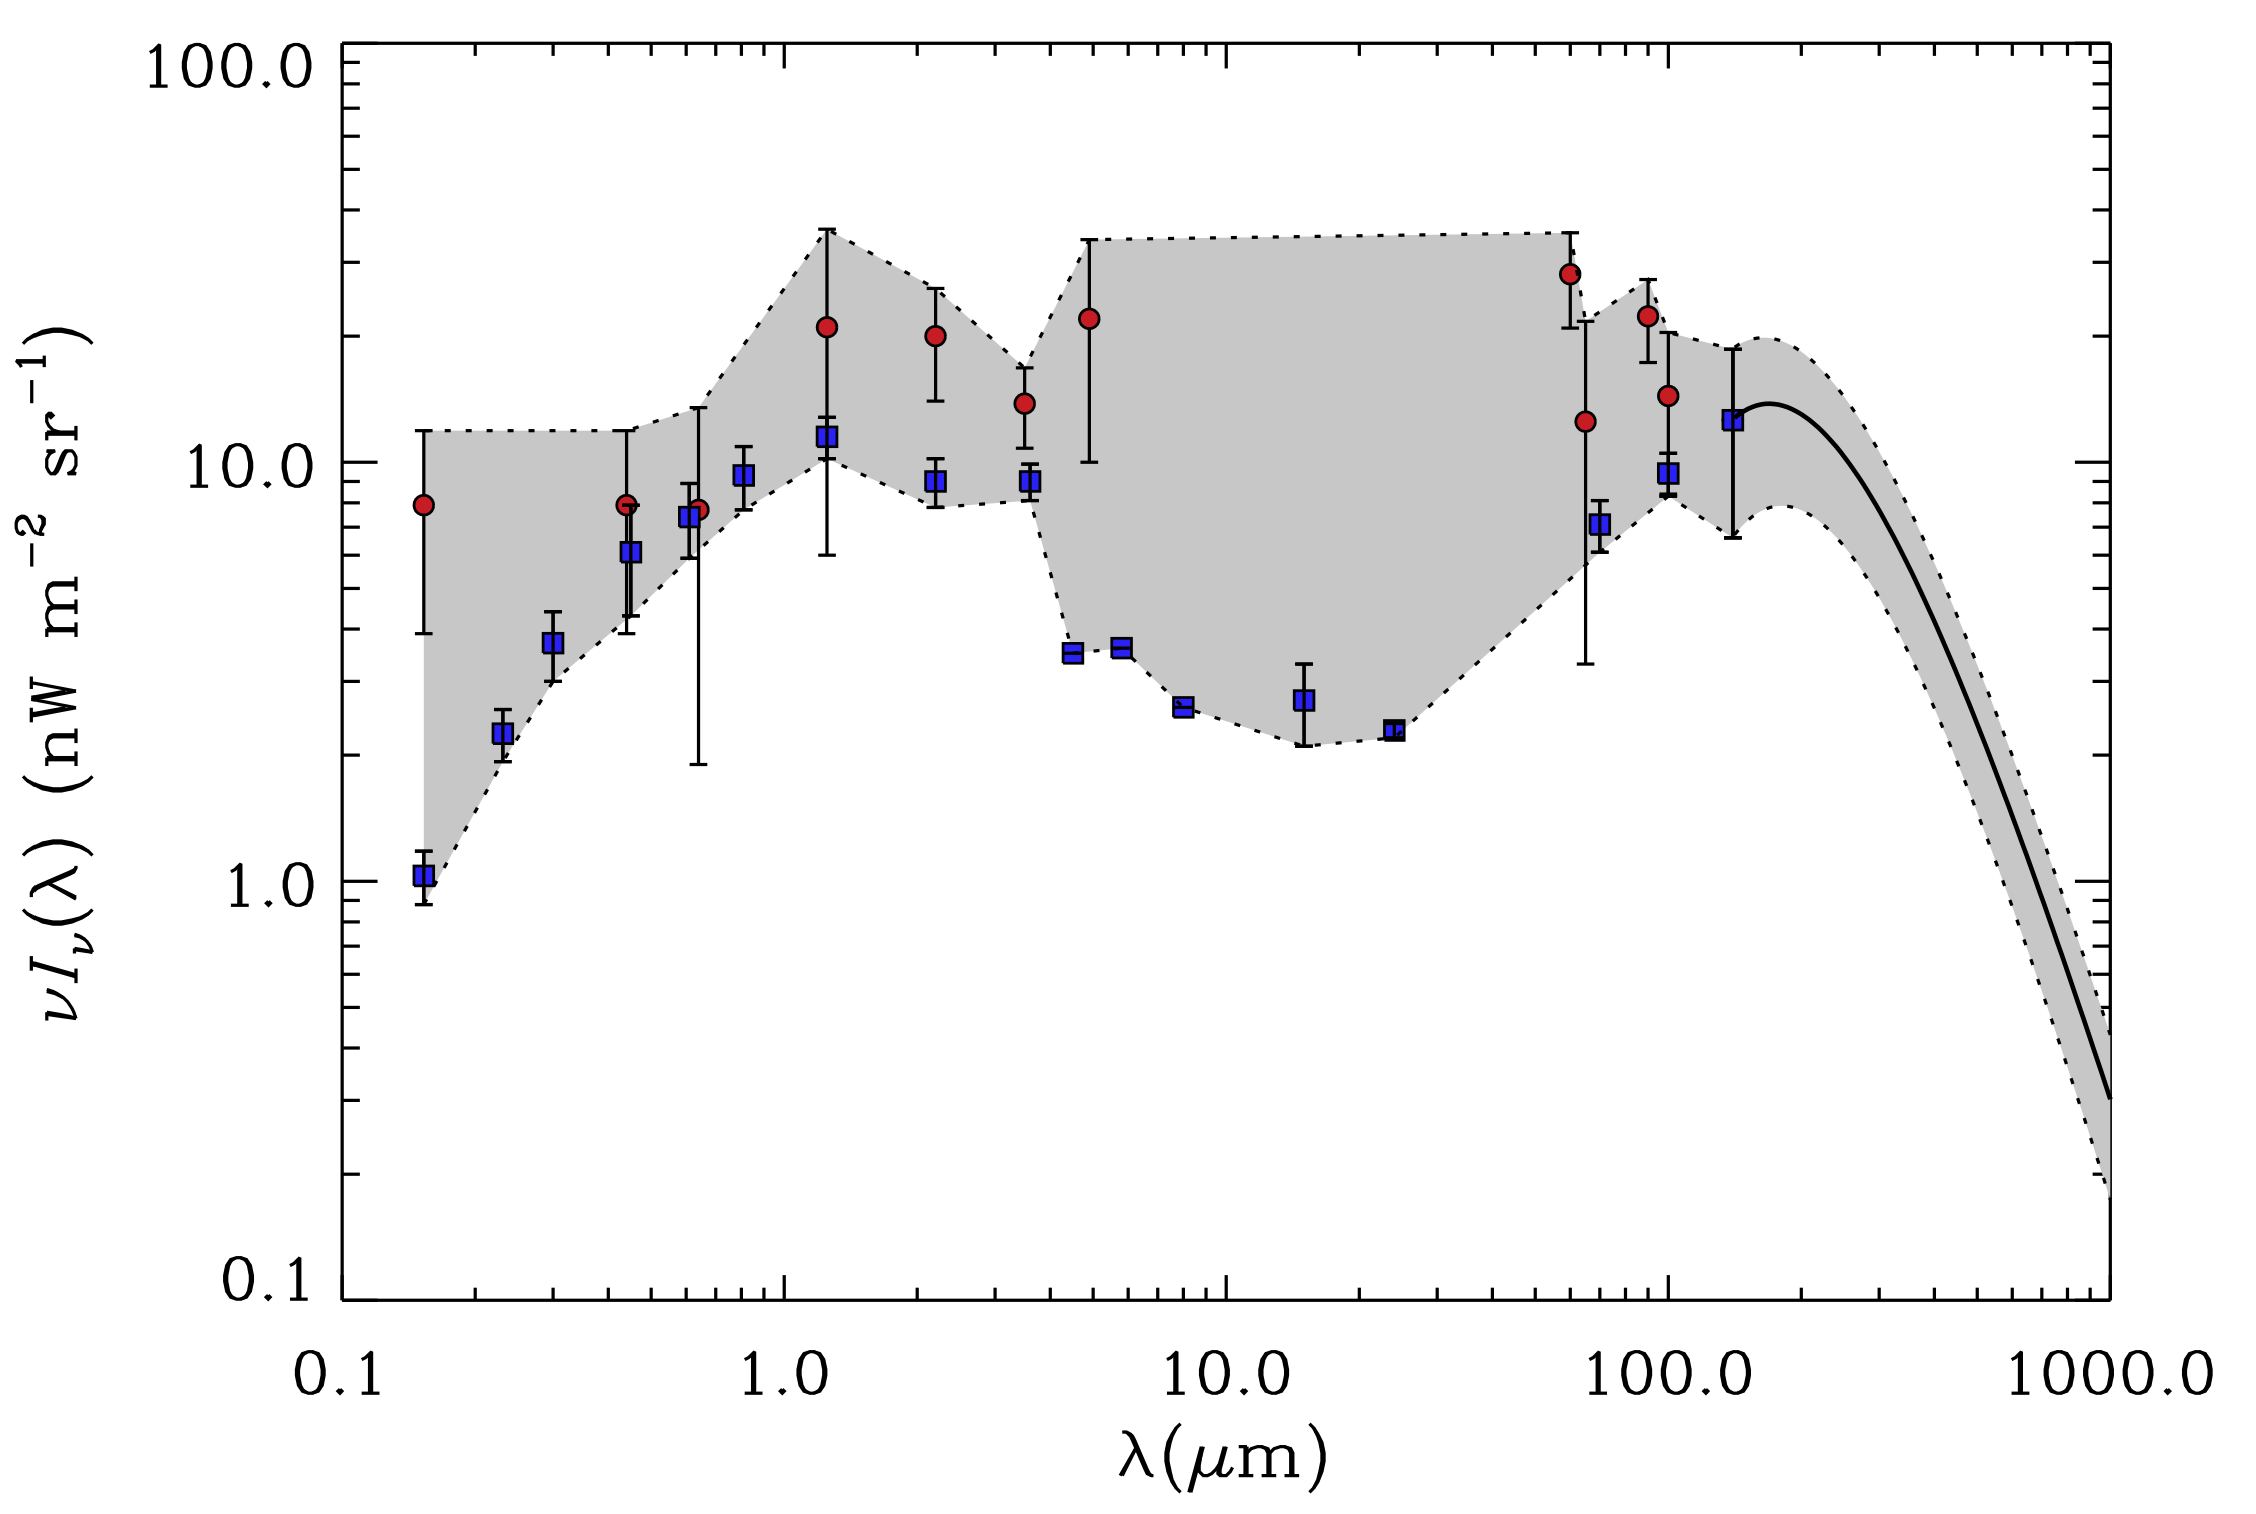
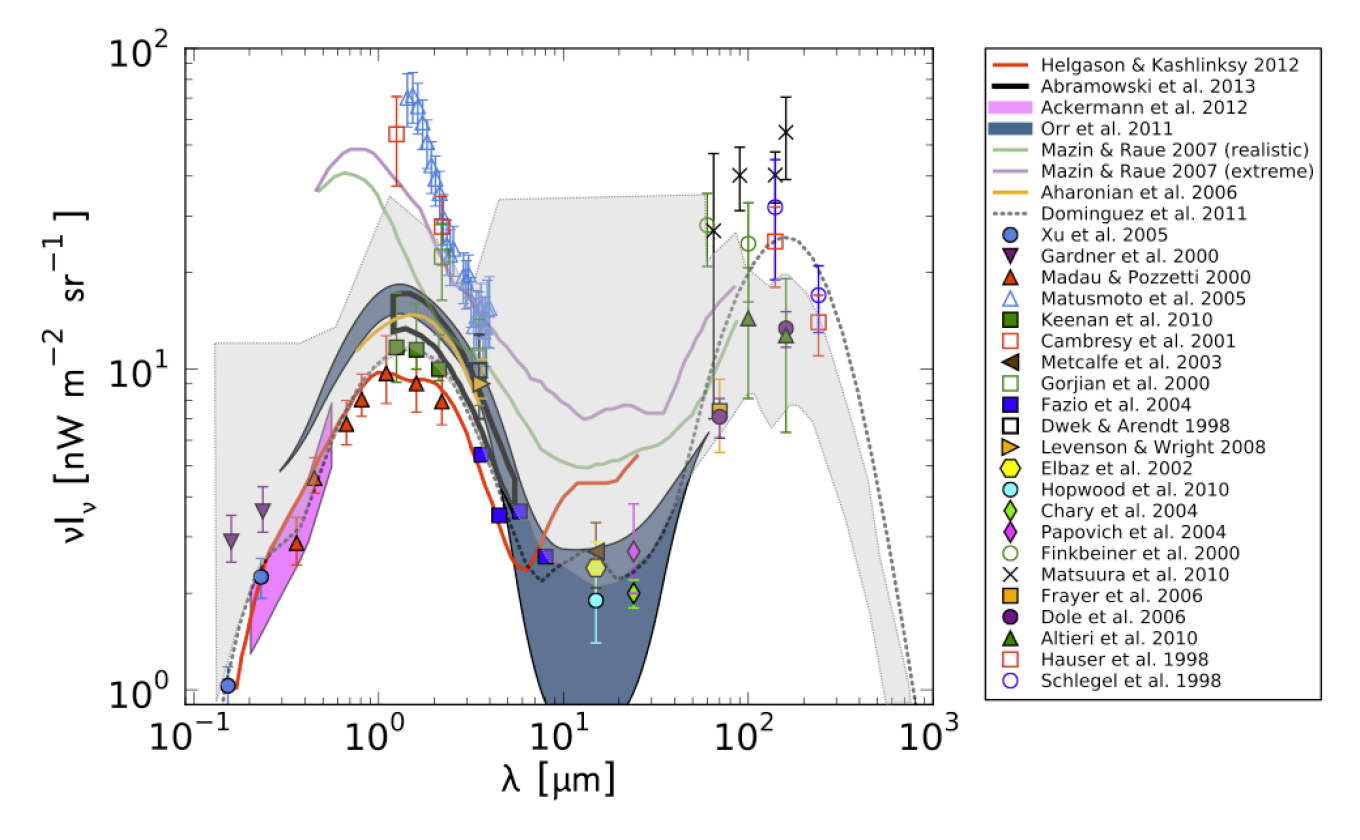
In a broader astrophysical context, the EBL is a depository of all radiative energy releases since the time of decoupling, and is the second-most dominant diffuse radiation component that permeates our universe, right after the cosmic microwave background. With star formation and accretion in active galactic nuclei (AGN) providing known contributions to the EBL, it also plays an important role in cosmic consistency tests, e.g., by comparing it with related diffuse radiation fields [10] including the X-ray background (AGN activity), the radio background and the cosmic supernova neutrino background (star formation). Its spectrum is bimodal (see Fig. 1) with one component peaking at m and comprising energy releases associated with the formation of heavy elements and the accretion of matter onto black holes in AGN. A second component peaking at m consists of absorbed UV and optical radiation that is re-radiated by dust at infrared (IR) wavelengths. The peaks are separated by a trough around m caused by the decrease of the stellar emission towards mid-IR wavelengths, and the rise in the dust emission spectrum towards far-IR wavelengths.
Absolute measurements of the EBL intensity continue to be complicated by the difficulties of subtracting the bright foreground radiation from zodiacal light and diffuse light from our galaxy [18]. A summary of absolute measurements is depicted in Fig. 1 as red circles with large uncertainties. Strict lower limits to the EBL are given by galaxy counts and constrain the minimal EBL intensity (blue squares in Fig. 1). As a result, the shaded area of possible EBL intensities in Fig. 1 is well constrained from below, but is very broad owing primarily to the difficulties in performing absolute measurements in the UV/optical/IR regime, and particularly in the mid-IR.
Independently, the large range of possible EBL intensities has been narrowed down substantially through recent analyses of the ray spectra of blazars. Upper limits to the EBL arise from the opacity of the Universe to rays of a wide range of energies. While they are somewhat dependent on assumptions about the intrinsic source spectra, the substantial increase of the catalog of extragalactic ray sources combined with a range of novel analysis methods [8, 4, 17, 19, 2, 1] have yielded strong constraints to the EBL intensity.
Besides improving our knowledge about the EBL, discerning the ray opacity of the universe offers a unique new opportunity for astroparticle physics at the intersection between non-thermal particle phenomena and thermal radiation fields. Anomalous features of the ray opacity have the potential to reveal physical processes that go beyond the standard models of particle physics and/or astrophysics. For example, a significant discrepancy between EBL lower limits from galaxy counts and ray opacity constraints (upper limits), could provide hints of physics beyond the current realm of particle physics and astrophysics. Such hints might include putative radiation components [7] due to primordial particle decay, or associated with Pop-III stars [9] or dark stars [16], which are not accounted for in current galaxy counts, and could persist as a residual background that increases the ray opacity, thus preventing upper limits from ray data and galaxy counts from converging.
Moreover, if the EBL derived from ray opacity measurements were to fall consistently below the lower limits from galaxy counts would be a tantalizing result, which could be explained either by interactions of photons with axion-like particles (ALPs) [14] or might result from secondary ray rays produced in cosmic-ray cascades [11] associated with the primary sources. While the possibility of detecting an ALP signature in ray opacity measurements contributes to dark matter searches, it is hypothetical at this stage (but see also [15]). The parameter space covered by these measurements includes the mass between and probes coupling constants between , which is complementary to other ALP searches. Similarly, the detection of secondary ray rays from ultra-high-energy cosmic-ray cascades from blazars implies two corollaries since their relativistic jets have to accelerate hadrons to 10s of PeV and secondary ray rays from these cascades are only detectable if the intergalactic magnetic fields are very small, of order G or less.
Due to the hypothetical nature of these processes we assume in the following that pair production from interactions is the only process relevant for the ray opacity of our Universe. This approach of using the minimal assumptions about the astrophysical contributors to the EBL and established physical processes allows one to perform cosmic consistency tests and in the genuine absence of any new physics alleviating the EBL opacity, also results in reliable EBL constraints.
2 Constraints of the Gamma-ray Opacity
The cross section for the interactions (see e.g., Dwek & Krennrich [10]) is broad compared to the energy resolution (15 - 20%) of space-based and ground-based ray telescopes. The cross section peaks at energies (TeV)(m), so TeV photons are effectively attenuated by m photons from the EBL.
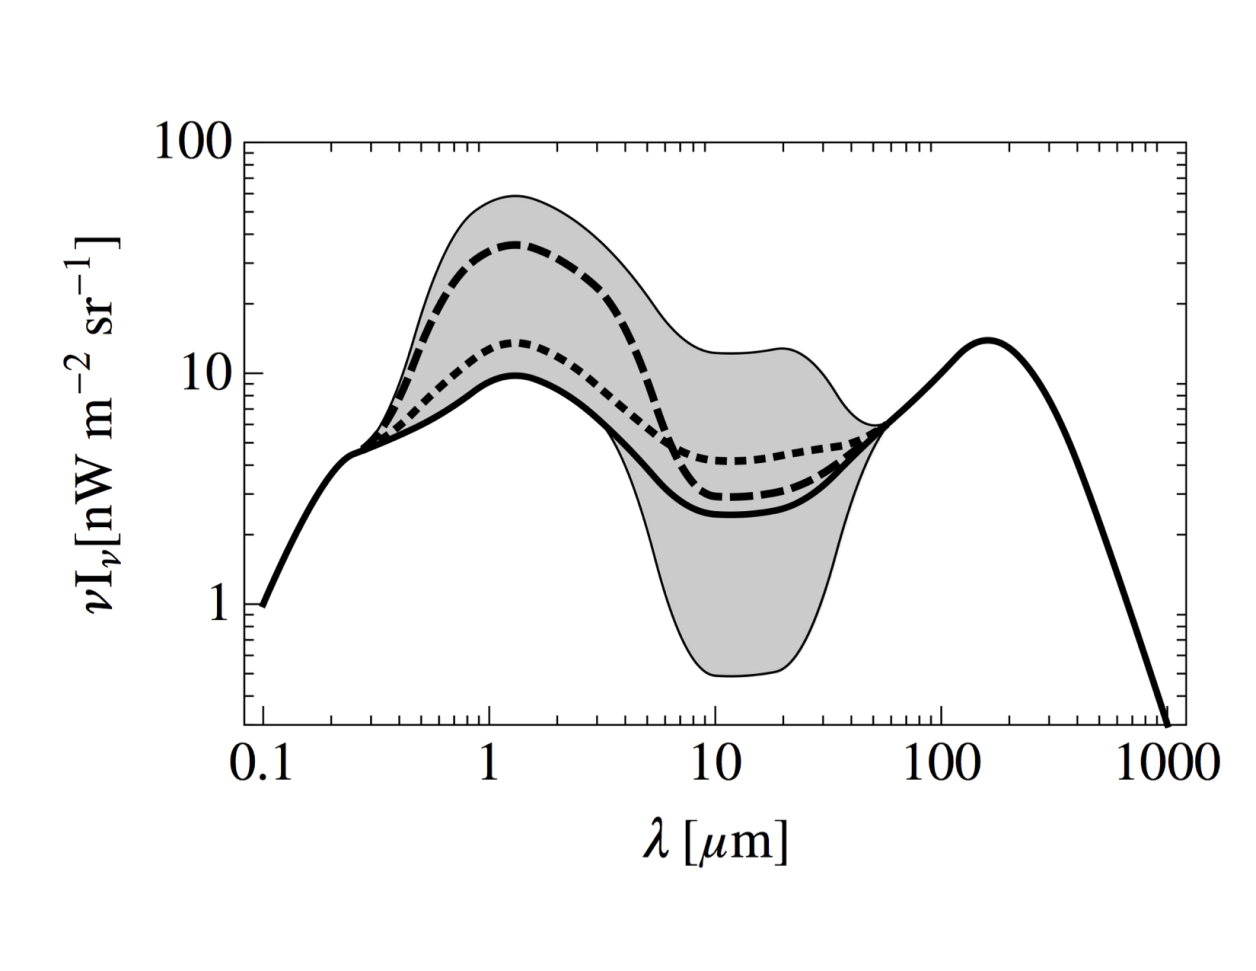
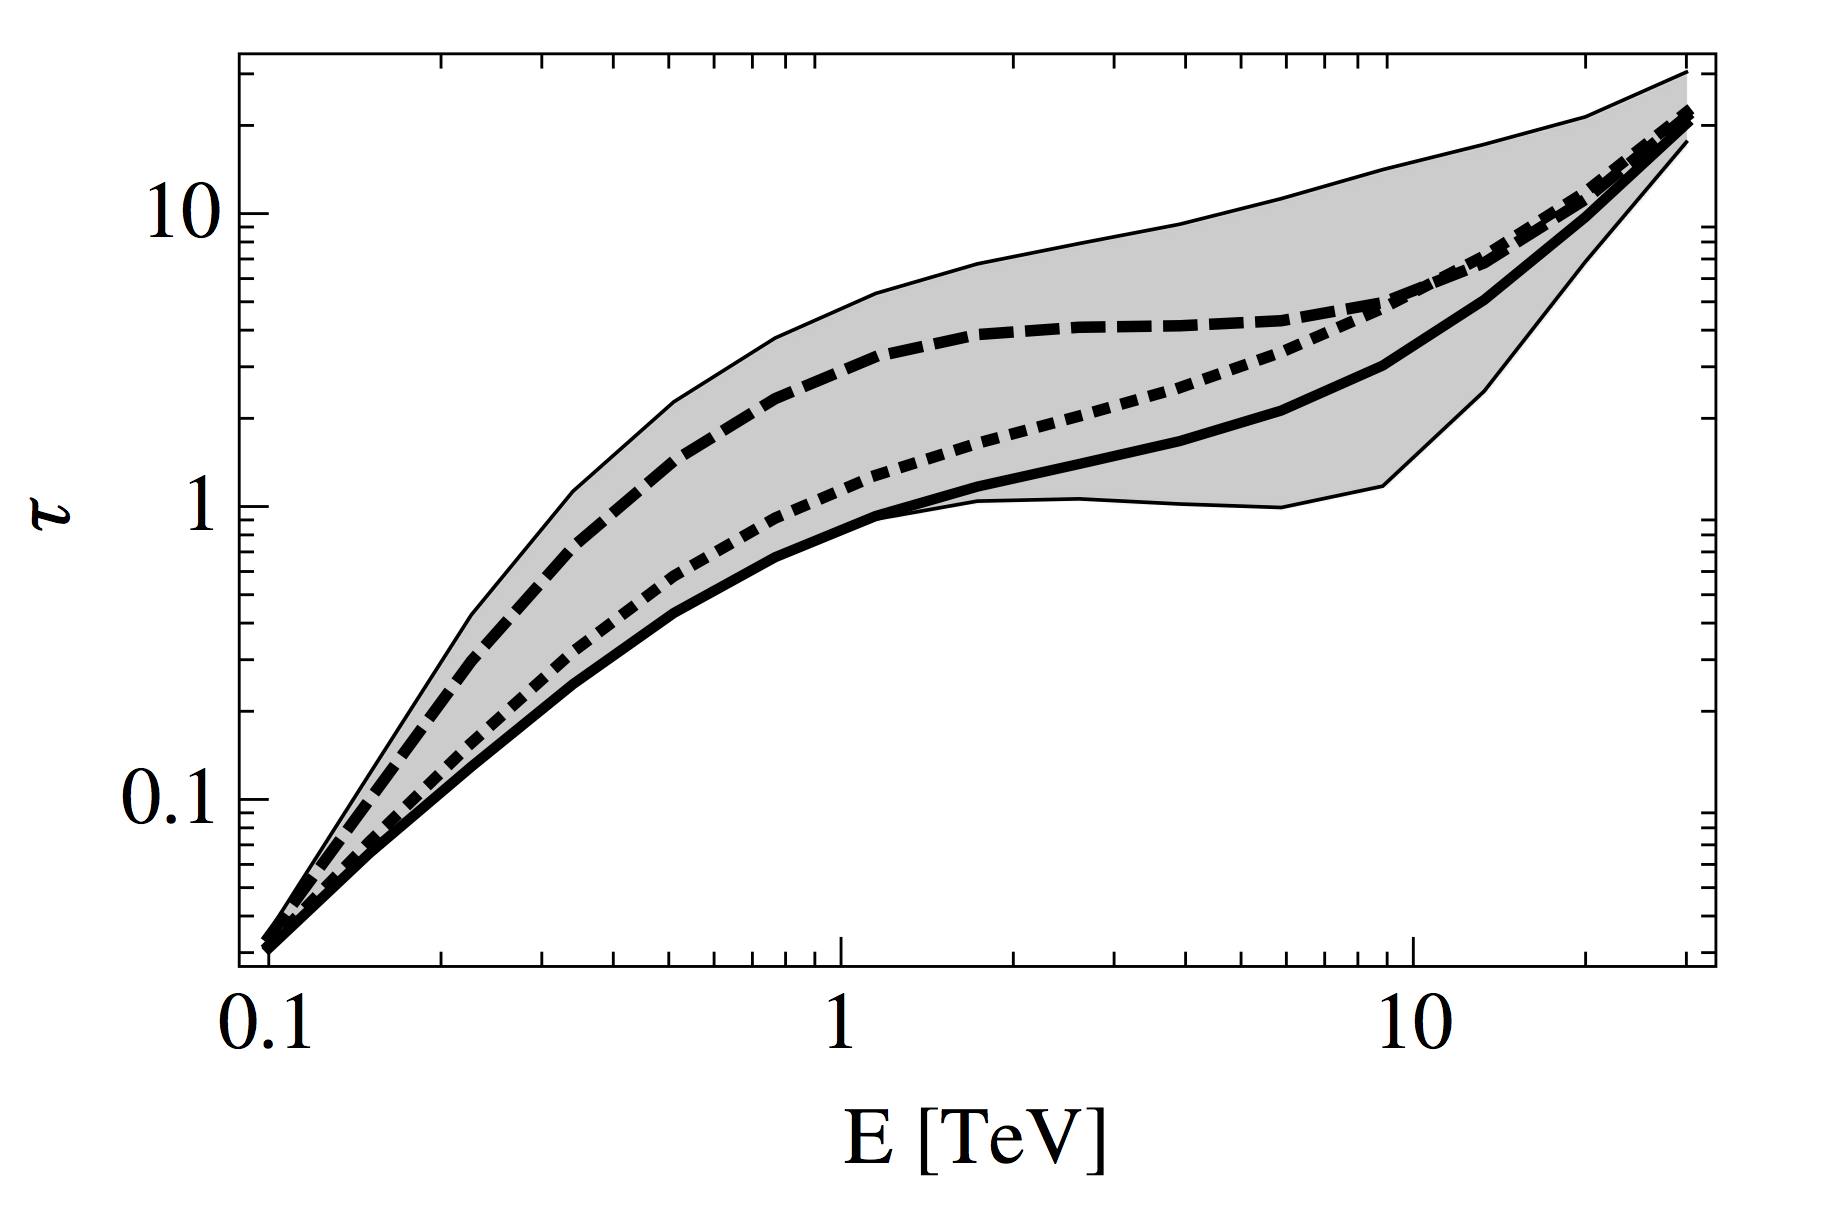
Multiple spectral imprints from absorption by the EBL are expected to occur between 10 GeV and 50 TeV. The magnitude of the ray opacity depends on the EBL intensity, and its energy dependence is determined by the spectral shape of the EBL. For an EBL intensity, that is given by a power law, e.g., , the energy dependence of the ray optical depth is . Therefore, changes in the slope of the EBL intensity with wavelength will give rise to changes in the slope of the ray opacity with energy (see Fig. 2, right).
For example, the rise in the EBL intensity between the UV/optical (0.1 – 0.5 m) to near-IR ( 1 m) amounts to a redshift dependent absorption feature detectable in ray spectra between 10 GeV to several 100 GeV, resulting in a gradually more prominent spectral break for higher redshift sources. A second and more subtle spectral break (softening or hardening) in ray spectra is expected at TeV. This feature arises from a substantial drop in the EBL photon number density between the stellar/AGN emission component at m towards the mid-IR ( m); the corresponding change in the slope (hardening in this case) of the ray optical depth occurs around TeV (dashed line in Fig. 2, right). A third spectral break is expected from the intensity rise between the mid-IR trough and the far-IR EBL and the associated rise in the opacity. The result would be a spectral softening in the 10 - 50 TeV energy regime.
3 Blazars for Searching for EBL Absorption
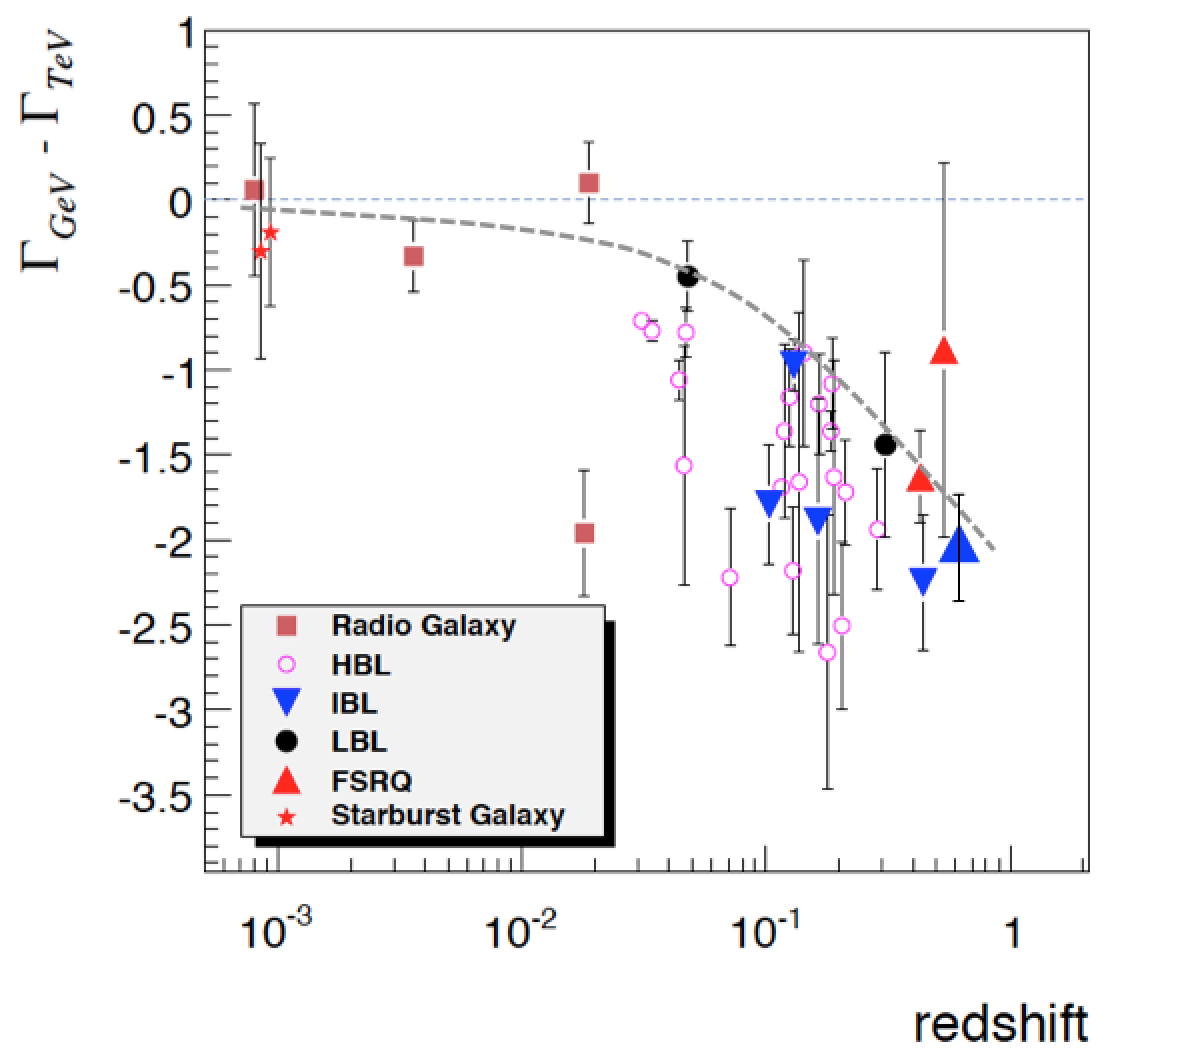
Blazars currently provide the largest sample of extragalactic ray sources to search for spectral signatures from EBL absorption. Collectively, the Fermi-LAT and imaging atmospheric Cherenkov telescopes (IACTs, such as H.E.S.S., MAGIC and VERITAS) provide EBL-relevant energy coverage from 10s of GeV to 10s of TeV. Fig. 3 shows the change of the spectral slope between the ray spectral index in the GeV regime and the spectral index in the TeV regime for a subset of 3 dozen extragalactic sources [10].
A clear trend showing spectral softening with increasing redshift (z = 0.0008 to 0.6.) is apparent. There is also a considerable variance in the magnitude of the spectral break for a given redshift. This arises from spectral steeping in the GeV to TeV regime intrinsic to some of the sources. Sources closest to the dashed line are the ones whose spectral break is dominated by EBL absorption, and exhibit little or no source intrinsic spectral steepening. The latter include hard spectrum blazars such as 1ES 1101-232, 1ES 1218+304, 1ES 0229+200, RGB J0710+59, already indicated by their unusually hard energy spectra [4, 10] given their substantial redshift.
Typical broad-band blazar spectra in the radio to the ray regime have two emission peaks in , one in the radio-to-X-ray waveband and a high energy peak in the GeV to TeV ray regime. In some cases, the blazar emission can be convincingly modeled as synchrotron-self-Compton (SSC) emission. In the SSC model, the high energy emission is produced by inverse-Compton scattering of synchrotron photons emitted by a common population of electrons. However ambient soft photons can also contribute to the target for inverse Compton scattering and complicate the modeling of the ray peak considerably. In addition, blazar variability combined with the difficulty of getting contemporaneous multi-wavelength coverage has prompted approaches that constrain the ray peak using general features.
Over a small energy regime ( magnitude in energy), the ray spectra are generally well approximated by power laws. On a larger energy scale they exhibit a concave shape (e.g. parabolic, broken power law, exponential cutoff) and it is this empirical feature that can be used to constrain the intrinsic spectra. The relation between the intrinsic, and the observed blazar spectrum is given by: . The equation implies that an overestimate of the opacity will lead to an exponential rise in the inferred intrinsic spectrum of the blazar. Such exponential rise is unphysical. It is inconsistent with our basic understanding of blazars, and is absent in the observed ray spectra of blazars for which is negligible. Similarly, a theoretical argument made by Aharonian et al. (2006) [4] that is based on theory of diffusive shock acceleration, suggests that the intrinsic energy spectra in the gray regime cannot be harder than .
4 Recent EBL Constraints from Opacity Measurements – Search for Unique Spectral Signatures
Several different methods for searching for evidence of EBL absorption in blazar spectra have been performed. The most recent ones, providing the strongest constraints, include results by the Fermi-LAT collaboration [2], and the H.E.S.S. collaboration [1] and results by Orr et. al. [19]. These results use different techniques. The Fermi-LAT result uses 150 BL Lacs (sub class of blazars) spanning a redshift range of z = 0.03 - 1.6 and a global fit function for the observed spectra that are modified by , with b being a free parameter that is constrained by the data to b=1 (), showing that EBL absorption is taking place. This result is most constraining for the EBL at 0.3 m. The energy dependent cutoff feature observed in the energy spectra of this large blazar sample can be regarded as a detection of an EBL signature in the 10 GeV - 100s GeV regime associated with the strong rise of the EBL intensity in the UV/optical toward larger wavelengths. These constraints are indicated in Fig. 5 as a shaded (magenta) band at short wavelengths.
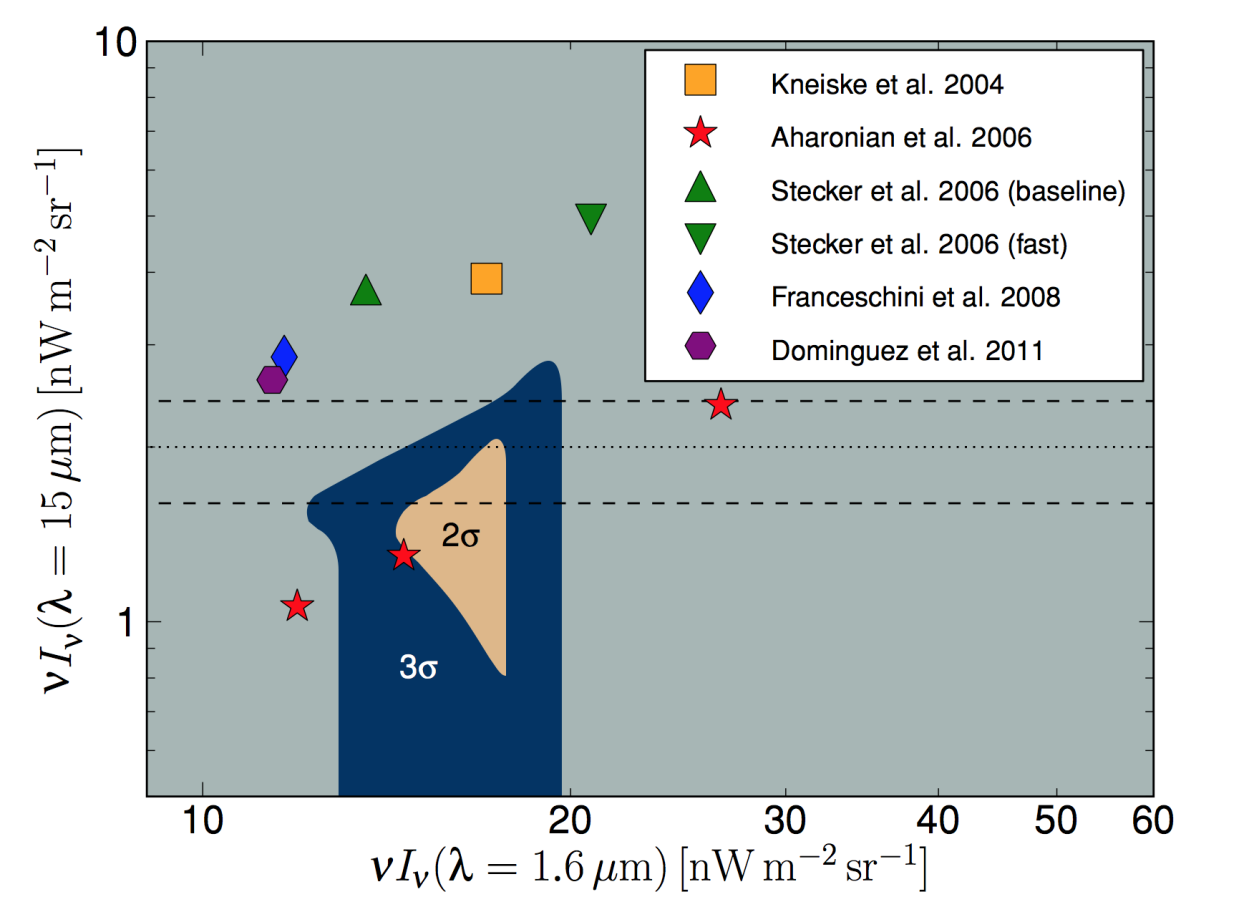
IACT results are based on substantially smaller samples. The work by Orr et al. (2011) [19] uses a sample of 12 blazars between redshifts of 0.044 - 0.186 to constrain the near-IR, and mid-IR EBL intensities and the near-IR to mid-IR ratio. The technique used consists of two parts. One is designed to constrain the second spectral break discussed in Section 2 of this paper by measuring the spectra below and above the expected break energy of 1 TeV, thereby constraining the near-IR to mid-IR ratio. Furthermore, by using the combination of Fermi-LAT and IACT data for 4 hard-spectrum blazars, the near-IR intensity is strongly constrained under the assumption that the energy cutoffs in these spectra are dominated by EBL absorption, which is well justified given their position in Fig. 2 close to the dashed gray line. This work led to a well-constrained region of the near-IR to mid-IR ratio shown in Fig. 4. These results also provide strong constraints to the absolute near-IR and mid-IR intensities and the possible range of EBL scenarios consistent with these data are also shown in Fig. 5 as a shaded blue regime.
Results presented by the H.E.S.S. collaboration [1] are based on a technique similar to the one applied by the Fermi-LAT collaboration using a variable that allows the EBL attenuation term to scale , and provide a significant detection of an EBL absorption feature. These results are also shown in Fig. 5 as a region bounded by the black solid line.
As can be seen, opacity measurements with ray telescopes have provided strong constraints on the EBL and have helped to substantially reduce the uncertainties affecting absolute EBL measurements. While the UV EBL discerned from ray data is consistent with lower limits from galaxy counts, the near-IR EBL leaves some room for additional EBL contributions not accounted for in galaxy surveys.
Further ray studies with substantially larger blazar samples and fully resolved galaxy counts are required to reduce the statistical and systematic uncertainties of both approaches. The next generation Cherenkov Telescope Array (CTA)[3] and the James Webb Space telescope (JWST)[12] will be required to achieve convergence between lower limits and opacity measurements. Large samples of blazars also have the potential to provide much-improved constraints on the EBL in the optical/near-IR and mid-IR through a better understanding of the blazar subclasses and their intrinsic spectra, as well as better photon statistics for the measurement of the redshift dependence of any spectral feature attributable to the EBL. The JWST will likely resolve the EBL sources at near-IR wavelengths due to its unprecedented resolution and sensitivity.
Acknowledgments
This research is supported by grants from the U.S. Department of Energy Office of Science, and by NASA Fermi Guest Investigator grant NNX11AO38G and by Iowa State University. Furthermore, I would like to thank Hugh Dickinson for proof-reading the manuscript.
References
References
- [1] A. Abramowski et al. Astronomy & Astrophysics 550, A4 (2013).
- [2] M. Ackermann et al. Science 338, 1190 (2012).
- [3] M. Actis et al. Exp. Astronomy 32, 193 (2011).
- [4] F.A. Aharonian et al. Nature 440, 1018 (2006).
- [5] C.D. Dermer, ArXiv: 1202.2814 (2012).
- [6] A. Dominguez, M.N.R.A.S 410, 2556 (2006).
- [7] E. Dwek et al. Astrophysical Journal 508, 106 (1998).
- [8] E. Dwek, F. Krennrich Astrophysical Journal 618, 657 (2005).
- [9] E. Dwek, F. Krennrich R.G. Arendt Astrophysical Journal 634, 155 (2005).
- [10] E. Dwek and F. Krennrich Astroparticle Physics 43, 112 (2013).
- [11] W. Essey and A. Kusenko Astroparticle Physics 33, 81 (2013).
- [12] J.P. Gardner Space Sci. Rev. 123, 485 (2006).
- [13] R.J. Gould and G.P. Schréder Phys. Rev. Lett. 155, 1404 (1967).
- [14] D. Hooper and P. Serpico Phys. Rev. Lett. 99, 231102 (2007).
- [15] D. Horns and M. Meyer Journal of Cosmology and Astroparticle Physics 2, 033 (2012).
- [16] A. Maurer et al. Astrophysical Journal 745, 166 (2012).
- [17] D. Mazin and M. Raue, Astronomy & Astrophysics 471, 439 (2007).
- [18] M.G. Hauser and E. Dwek ARA & A, 39, 249, 2001.
- [19] M. Orr, F. Krennrich and E. Dwek Astrophysical Journal 733, 77 (2011).