Multi-epoch study of the gamma-ray emission within the M87 magnetosphere model
Abstract
M87 is a nearby radio galaxy that has been detected at energies ranging from radio to very high energy (VHE) gamma-rays. Its proximity and its jet, misaligned from the line of sight allow detailed morphological studies. The imaging atmospheric Cherenkov technique (from 100 GeV to 10 TeV) provides insufficient angular resolution (few arc-minutes) to resolve the M87 emission region. However, the short time scale variability observed by MAGIC, HESS and VERITAS suggests the TeV emission is coming from a very small region, most likely close to the core. We propose that the variable TeV emission may be produced in a pair-starved region of the central black hole (BH) magnetosphere, i.e. a region where the density of the electron-positron plasma is not sufficient to completely screen the accelerating electric field. The funnel, a low density and magnetically dominated region around the poles, appears as a favourable site of low-density where a Blandford-Znajek process may explain the main properties of the TeV -ray emission from M87. We produce a broadband spectral energy distribution (SED) of the resulting radiation and compare the model with the observed fluxes from the nucleus of M87, for both low and high -ray activities. We finish with a brief discussion on the connection between the accretion rate and the intermittence in the formation of gaps in the magnetosphere.
1 Introduction
The Fanaroff-Riley (FR) class I giant radio galaxy M87, situated nearly at the center of the Virgo cluster, harbors the first observed extragalactic jet. It has been intensively studied at all wavelengths. The giant elliptical galaxy is also known to host one of the most massive black holes [1], and a prominent, non aligned jet detectable from radio to X-ray wavelengths. Its proximity, Mpc [2], makes it one of the two best objects, the other being Centaurus A, for testing and understanding extragalactic jets of radio-loud Active Galactic Nuclei (AGN) and their powerful engines.
VHE ( GeV) gamma-ray emission was first reported by the HEGRA collaboration in 1998/99 [3]. The emission was confirmed by the HESS collaboration in 2003-2006 [4]. Additionally, Aharonian et al. [4] also reported variability during a high state of gamma-ray activity in 2005 with a timescale of days. Timescale for these fluctuations may be related to the characteristic time of the central engine
| (1.1) |
where is the angular velocity of the BH, and is in order of hours. Therefore, the relativistic ejections, responsible for the observed flare, appear to be related to the phenomena on the event horizon. On the other hand, Chandra X-ray observations revealed a gradual increase in activity from HST-1 in the energy range 0.2-6 keV [5]. The maximum coincided with the TeV flare suggesting HST-1 knot as the more likely source of emission. However, X-ray timescale analysis presented by Harris et al. [6] ( days) is still significantly longer than the TeV variability (1-2 days) and VLBA observations of HST-1 could not identify substructures down to 0.15pc [7]. This upper limit should be compared to the constraint on the emission region size from the causality argument, which implies a compact region pc where is the Doppler factor of the relativistically moving source. We can neither claim nor reject the presence of such small features in HST-1 and the region remains a possible origin of the VHE emission. For the nucleus of M87, the data were severely affected by a "pileup" effect and are not reliable [53] . So the open question for the 2005 April TeV flaring episode is could it be that the strong flux of HST-1 have suppressed the detection of an enhanced flux coming from the X-ray core?
Between January and May 2008, the HESS, MAGIC and VERITAS collaborations took part in a joint multi-wavelength monitoring along with VLA and Chandra [9]. The VHE and Chandra X-ray light curves along with a coincident VLBA radio light curve are presented in Acciari et al. [51]. The flux reached the highest level ever observed, more than 10% of the Crab nebula. The observed day scale variability in the energy range between 0.1 TeV and 10 TeV, and the fact that the TeV emission appears to be correlated with the VLBA jet but not with emission from larger scale and, in particular HST-1, motivate the consideration that the observed TeV photons originate from the BH magnetosphere.
The magnetosphere is a region where a magnetized plasma (e.g., an accretion disk and its corona) surrounds a BH and where a wind/jet would be generated from the surrounding plasma. The Blandford-Znajek mechanism [11] (hereafter BZ), used here as a mean of extracting energy from the rotating BH, appears to be a plausible mean of harvesting spin energy. Despite some hints [12, 13] and the general consistency of the idea, there is no observational evidence for BH energy extraction. In this paper, we study the implication of the activation of the BZ mechanism in the magnetosphere and we present -ray spectral energy distribution (SED) for quiescent and flaring activities of M87. We show that the TeV activity may change significantly depending on the injection of the seed charges into the magnetosphere that, in turn, may be associated with the accretion rate.
The paper is organized as follows. In §2 existing models for VHE -ray emission from the M87 core are briefly reviewed and discussed. In §3 we briefly describe the numerical scheme adopted to simulate the above scenario. In §4 we describe the basic model pair production and TeV emission. In $ 5 we discuss the influence of the input parameters. In §6 we show results of Monte Carlo simulations for varying acceleration fields. In §7 we discuss the role of the hole spin parameter on the TeV luminosity. We summarise and discuss implications for M87 in §8.
2 Theoretical scenarios
Several theoretical scenarios have been invoked to account for the high energies () and VHE -ray emission from M87.
Georganopoulos et al. [16] showed that homogenous one-zone leptonic synchrotron self-Compton (SSC) models are unlikely to explain the observed TeV spectrum of M87. For an SED whose synchrotron and SSC components peak in the IR and the TeV band, high values of the Doppler factor, , should be inferred. A solution to this problem is to assume that the jet emission region is structured, as in the decelerating jet model of refs. [15] and [16] or as in the spine-layer model [17]. Both models are characterized by compact sizes of the VHE -ray emission and no obvious correlation between the low and high-energy emission (for instance the keV component will not exactly follow the TeV component). They also predict very strong gamma-ray absorption and relatively soft spectrum, and hard spectra are difficult to achieve.
Lenain et al. [18] present a modification of the one-zone SSC model. In that work, the bulk of the observed emission is proposed to be produced in compact sub-volumes of the main outflow. Such a scenario could in principle account for VHE high states; the individual blob radii of about is compatible with the short variability and the blobs are ejected from the core with reasonable bulk velocities. However, a low magnetic field in the emitting region is required which may be in disagreement with the fact that these regions of the jet are likely strongly magnetized. Giannios et al. [19] consider mini-jets of energetic particles moving relativistically within the jet. Depending on the direction of motion of the mini-jet, different variability patterns and various variability timescales could, in principle, be expected.
Recently, a different type of modelling has been brought forward to explain the observed VHE -ray emission. In ref. [20], the authors proposed a scenario where a red giant star interacts with the base of the jet. The VHE emission is due to the interaction of the protons from the jet with the disrupted red giant envelope. To accommodate the light curve and the energy spectrum of the April 2010 flare, a jet power of collimated into a narrow jet with semi-opening angle are assumed. At the distance from the hole at which the cloud crosses the jet , such a narrow jet would not concur with the VLBI observations showing that the jet opening angle reach within 1 milli-arcsecond of the core [21, 22, 23].
The compactness of the particle accelerators operating in the vicinity of the BH and the absence of a significant cutoff in the spectrum imply that the particle acceleration mechanism is highly efficient. Magnetospheric models [24, 25, 26, 27], where the non-thermal particle acceleration and emission processes occur at the base of the magnetosphere may then become particularly interesting.
3 Outline of the simulation
The reader should refer to [26] for the details of the simulation. We only give a brief overview. We carried out a Monte Carlo simulation of an electromagnetic cascade in a BH magnetosphere. The simulations use the exact cross-section of the full electron-photon cascade involving photon-photon pair production interactions and inverse Compton scattering. The number density of the target photon field is uniformly distributed into an infrared emission region of radius around the BH and the energy distribution is approximated as a function at energy . The electrons are assumed to be initially at rest with respect to the locally inertial observer and injected at the base of the gap. First, the mean interaction length is calculated, and then an interaction length is sampled from an exponential distribution with this mean. At the interaction point, the interactions are treated as described in Sections 3.3 and 3.5 in [26]. At each step of integration of the electron’s trajectory, the energy and power of synchrotron emission are calculated. If the interaction length is greater than or if the condition on the pair energy threshold for a head-on collision is not satisfied, the energy of the particle is printed out.
4 Properties of the central AGN
In what follows, we review the non-thermal particle acceleration and VHE emission processes that may occur in the vicinity of magnetized supermassive BH. We discuss the internal -ray opacity and the consequences for the TeV observations of M87. And, we finally note that the intermittence of the gap formation may be related to the changes in the accretion rate.
4.1 Particle acceleration close to the central black hole
In this scenario, the Kerr BH is threaded by an accretion-deposited magnetic field. The charged particles are electromagnetically accelerated to extreme relativistic velocities in a region with a potential drop created by the inefficiency of charge supply (BZ, [28]). The accelerated particles are usually postulated to be leptons [29, 30] but protons have also been proposed [31, 32]. The spectral and timing characteristics of the VHE emission are associated to the physics of the processes taking place close to the supermassive BH. The mass of the BH in M87 is well established and the expected minimal timescale variability for a non-rotating BH is , and the observed short timescale variability of TeV emission of days indicates that the emission originates within the last stable orbit unless the radiation is produced in a relativistic bulk motion.
In a stationary plasma-filled magnetosphere, the structure of the electromagnetic field satisfies the condition , where and are the electric and magnetic field respectively. Around a rotating BH, the electric field arises as a consequence of the coupling of the magnetic field to the frame dragging effect, see e.g. [33]. The characteristic charge density needed to neutralize the parallel component of the electric field in the magnetosphere is the so-called Goldreich-Julian density [34]. If the local value of the charge density differs significantly from in any region, a gap forms and an electric field with a component parallel to the magnetic field provides conditions for particle accelerations to arise. The change in energy of charged particles accelerated along in a region of the size of the gravitational radius is
| (4.1) |
where is the gap height of a size of order . The efficiency of the acceleration mechanism is related to the deviation from the ideal case, i.e. when can differ from zero but stays close to zero and how pairs can screen out the electric field.
Radiative energy losses always compete with acceleration and introduce additional constraints on the maximum achievable particle energies. In the hypothesis of the electronic origin of the TeV -ray emission in terms of high-energy electrons, the main emission mechanisms are synchrotron radiation and inverse Compton (IC) scattering. General relativistic magnetohydrodynamics simulations show that large scale radial magnetic field may form near the BH, e.g. [35, 36], and the energy losses of electrons are not expected to be dominant over curvature radiation. In the potential gap, the motion of the electron-positron pairs along the magnetic field is maintained by the field. The momentum component perpendicular to the magnetic field , owing to the IC scattering with the ambient photons, is rapidly lost, and the pitch angle is almost null. Therefore, the synchrotron radiation originates from the gyration of the charged particles in the component of the magnetic field . The requirement that the synchrotron energy loss is balanced with the acceleration rate gives the maximum Lorentz gamma factors
| (4.2) |
For IC scattering, the maximum energy of pairs is
| (4.3) |
where is the energy density of radiation, is the luminosity of the source coming from matter accreting onto the hole and for the infrared luminosity erg.s-1. Eq. (4.3) is determined under the assumption that the IC scattering takes place in the Thomson regime. The highest-energy electrons upscatter the background radiation into the Klein-Nishina regime, in which the efficiency of the IC scattering is reduced. A proper accounting of the decrease in IC loss efficiency would result in higher electron energies.
For an explanation of the observed TeV -ray radiation by IC scattering, one should assume that the energy losses of electrons are not dominated by synchrotron radiation. We can set an upper bound on the value of the magnetic field strength in the infrared region by equating the energy densities of the magnetic field and of radiation, i.e. , and
| (4.4) |
The size of the infrared emission region is taken to be , and if , the absorption of the first-generation of -rays will trigger an electromagnetic cascade.
4.2 Escape of the -ray photons
In this section, we examine the conditions under which the -ray photons in the energy range covered by VERITAS () escape from the regions where they are produced. The spectrum of the VHE photons observed by air Cerenkov detectors and the assumption that these photons originate from the magnetosphere imply that the pair production opacity at these energies does not exceed unity. The highest energy -rays produce pairs in interaction with the soft photon background inside the compact source. The cross-section of photon-photon pair-production depends on the center of mass energy of the colliding photons,
| (4.5) |
where and are the energies of the photons and is the colliding angle. The dominant source of IR-optical photons that can pair create with the TeV photons is the ambient nucleus emission. The observed luminosity of the M87 nucleus at Hz is [37, 38]. Starting from the threshold condition at , the pair-creation cross section peaks at for photons with total energy in the center-of-mass frame, and then decreases as . TeV photons interact mostly with target soft photons of energy . The number density of soft photons is , where . Thus the annihilation optical depth is
| (4.6) |
The considered region would be transparent to the photon if . Although infrared telescopes prevent us from resolving the size of the radiation source, HST spectroscopic observations constraints the size of the nuclear disk in M87 to [39]. M87’s proximity makes the absorption of -rays in the cosmic background radiation field insignificant.
4.3 The role of the inefficient accretion flow
As explained above, two properties of the central engine have some profound implications on the possible mechanisms of VHE -ray emission: the plasma density and the magnetic field environment. Matter density near the event horizon may be estimated from the hot interstellar medium at the Bondi radius, i.e. the radius at which the gravitational potential of the BH begins to dominate the dynamics of the hot gas and the gas starts to fall into the BH. Henceforth, we use the conventional notation that expresses the accretion rate in units of the Eddington rate , where is a scale factor and the Eddington accretion rate , is the rate necessary to sustain the Eddington luminosity. The accretion efficiency factor is noted and . Di Matteo et al. [40] gives an estimate of the Bondi accretion rate of the nucleus of M87 using the Chandra observations. The corresponding value is an upper limit of the accretion rate, . The Bondi accretion rate in this units is . Interestingly, this indicates that the accretion proceeds in a radiatively inefficient way and suggest that the density of the injected charges may not exceed the Goldreich-Julian charge density in at least some region of the magnetosphere. Consequently, a complete screening of the aligned electric field cannot be accomplished and a gap forms. Whereas at sufficiently large accretion rates, the seed charges density may exceed , giving rise to complete screening and leads to the formation of a force-free outflow ().
Independently from the uncertainty on the accretion regime, one can estimate the ion density near the BH,
| (4.7) |
where is the radial velocity. In ref. [41], the authors show that at lower radii (), the electron temperature becomes large, , and we assume in equation (4.7) that the accretion material moves at relativistic speeds, i.e. .
The magnetic field strength in the vicinity of the BH can be related to the accretion rate . We assume that the accreting gas is roughly in equipartition with the magnetic field, and we write the total pressure as
| (4.8) |
where is the gas pressure, the magnetic pressure, and we take . The equipartition magnetic field is then determined from the magnetic pressure, i.e, , and yields
| (4.9) |
giving a maximum acceleration energy
| (4.10) |
The Goldreich-Julian density111The given expression is the flat-space Goldreich-Julian charge number. A better estimate for would use the simulation derived currents density and the relation , where is the 4-velocity according to an observer at infinity. can be related to the accretion rate
| (4.11) |
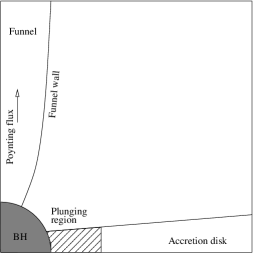
Mościbrodzka et al. [42] gave an estimate of the charge density for a monopole magnetosphere taking into account general relativistic effects. We have checked that our flat spacetime estimate is consistent with the Kerr spacetime estimate. For a maximally rotating BH with mass , the angular rotation speed is . The value of derived from equation (4.11) makes the possibility of creating gaps in the accretion disk or on the plunging region222The plunging region lies between the innermost stable circular orbit and the event horizon unlikely. However, magnetohydrodynamics simulations of models of zero obliquity BH accretion, in which the accretion flow angular momentum is parallel to the BH spin, exhibit a low density evacuated funnel region near the pole. This region looks favourable for the formation of gaps.
In ref. [43], the authors showed that the funnel region is nearly force-free and is well described by the stationary force-free magnetosphere model. But an important question remains: how to populate the funnel? Direct feeding of the funnel with plasma seems unlikely as charged particles would have to cross magnetic field lines. Moreover, funnel magnetic field lines are almost radial near the event horizon and then run in a smooth helicoidal shape, and do not intersect the disk [44, 35]. These structures are illustrated in figure 1.
Levinson & Rieger [27] propose a mechanism to feed the polar region by annihilation of MeV photons333such a scenario favours jet made pairs over jets made of electron-ion plasma, and restricts the production of neutrinos in AGN jets. that are emitted by the hot gas near the horizon. The corresponding number of pairs is
| (4.12) |
and
| (4.13) |
below an accretion rate , the injection of charges cannot provide complete screening of the magnetosphere. The dependence on the injection rate suggests that a gap may form during periods of low accretion and the emission from the gap may be intermittent.
5 Influence of the model parameters
In this section, we study the influence of several model parameters, such as the magnitude of the induced electric field. In the analysis of our results, we focus on the expected gamma-ray spectral signatures in a region of parameter space particularly well suited to reproduce the broadband spectral energy distributions of the radio galaxy M87. In each one of our simulations, we have assumed an infrared luminosity of at frequencies Hz. The parameters used for the individual runs are quoted in Table 1.
5.1 Structure of the potential gap
For a rotating Kerr BH of mass and angular , the Boyer-Lindquist spatial coordinate system is, with a parameter
| (5.1) | |||||
| (5.2) | |||||
| (5.3) |
where is the angular velocity of the local zero angular momentum observer (ZAMO) with
respect to infinity, representing the dragging of the local inertial frame, is the lapse function,
or the redshift factor between the ZAMO and infinity.
We consider a stationary axisymmetric flow of cold plasma around a rotating black hole.
Within this approach the magnetic field is expressed by
| (5.4) |
with is the magnetic flux function determining the poloidal magnetic field and is the electric current producing the toroidal magnetic field. The 3-gradient of a scalar function = in the Boyer-Lindquist coordinates is
| (5.5) |
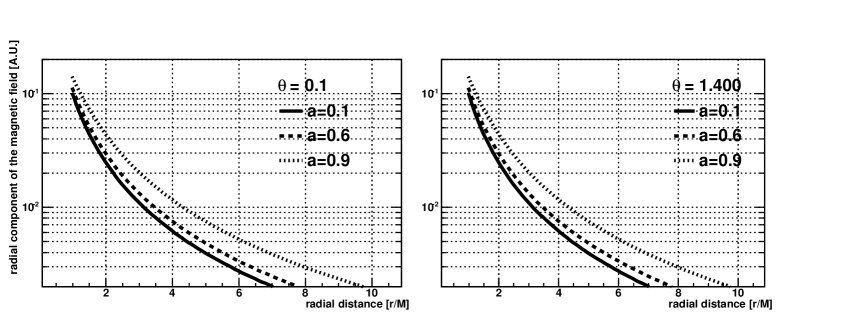
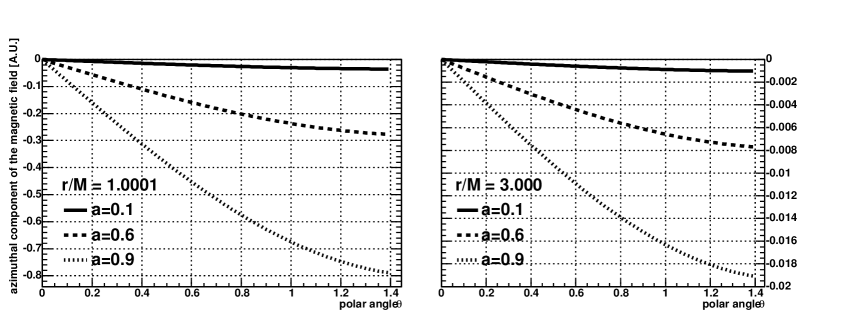
While the precise structure of the BH field is unclear, steady-state structure of spinning BH magnetosphere has been obtained through time-dependent general relativistic force-free numerical simulations (e.g. [45, 46, 47]). These works found that the numerical solution evolves toward a solution which is very close to the monopole solution
| (5.6) |
is called the angular velocity of magnetic field, and is the angular velocity of the BH.
In Fig. 2, we show the characteristic magnetic field configuration (top panel) and (lower panel) for near the BH horizon. Near the hole the magnitude of the potential drop along the field lines is .
5.2 Features of the non-thermal emission
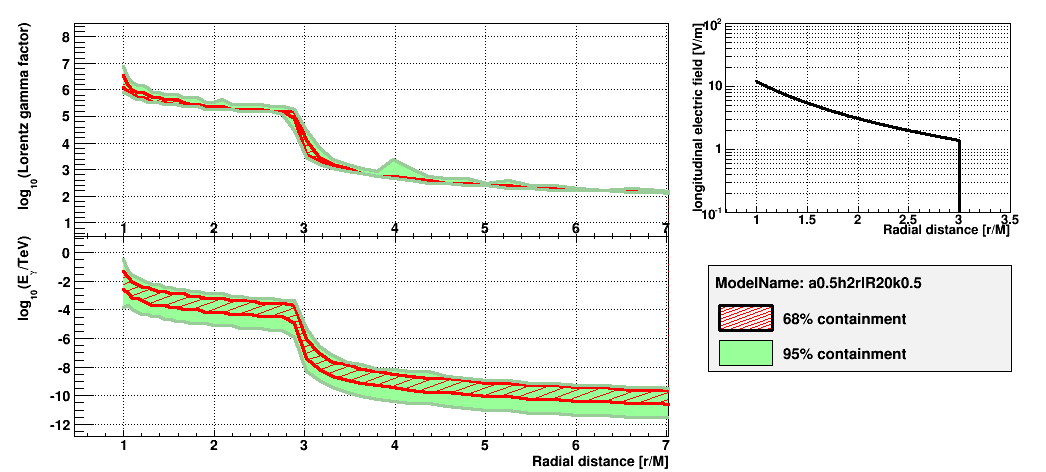
Fig. 3 illustrates the evolutions of the accelerated particles along the field line, which penetrate the gap. The top and the bottom panels show the evolutions of the Lorentz factor of the particles and the energy of the Comptonized photons. The shaded bands indicate the 95% and the 68% containment. The inset in the top panel of Fig. 3 shows the variation of the mean value of the accelerating electric field as a function of the radial distance. A charged particle introduced at the base of the gap is rapidly accelerated by the electric field and is boosted above on the Lorentz factor. This particle escape from the gap at where the accelerating field vanishes, and rapidly lose their energy via the Compton scattering.
An interesting qualitative change of the SED is illustrated in Fig. 4. The figures indicate that the peak luminosity of the gamma-ray spectra associated to inverse Compton emissions is related to the size of the vacuum gap. For example, a gap of size corresponding to a variability on timescale of day, produce a peak at GeV energy. For a thinner gap of corresponding to a timescale of mins, the peak luminosity is at hundredth of GeV.
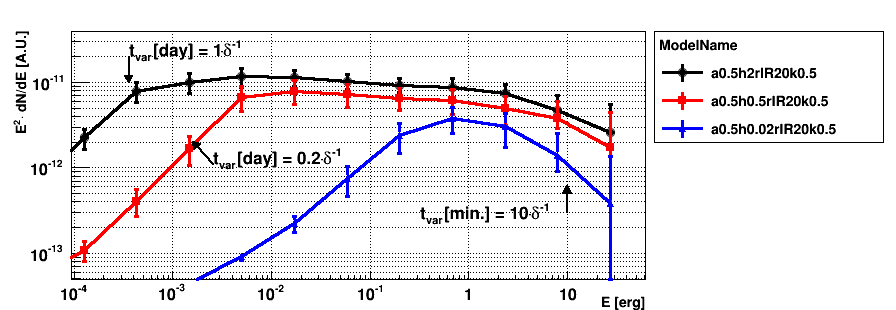
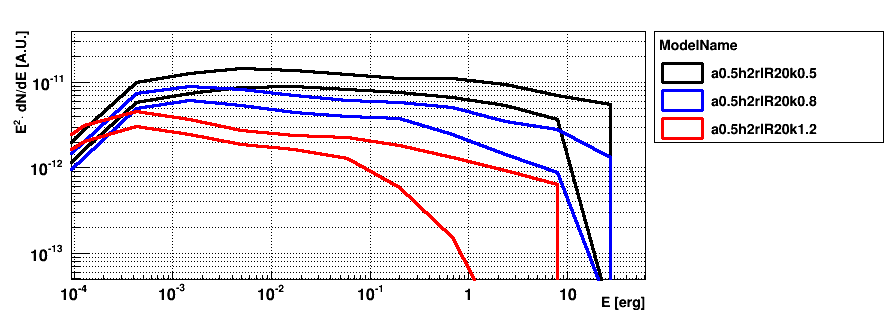
Subsequently, we investigate the influence of changing the value of the parameter that determines the strength of the electric field. Fig. 4 illustrates the hardening of the photon spectra at GeV and TeV energies with an increase of the magnitude of the accelerating field.
| ModelName | a/MBH | h/RG | RRG | |
|---|---|---|---|---|
| a0.5h2rIR20k0.5 | 0.5 | 2.0 | 20.0 | 10-0.5 |
| a0.5h2rIR20k0.8 | 0.5 | 2.0 | 20.0 | 10-0.8 |
| a0.5h2rIR20k1.2 | 0.5 | 2.0 | 20.0 | 10-1.2 |
| a0.5h0.5rIR20k0.5 | 0.5 | 0.5 | 20.0 | 10-0.5 |
| a0.5h0.02rIR20k0.5 | 0.5 | 0.02 | 20.0 | 10-0.5 |
6 Modelling the SED
Vincent & LeBohec [26] have developed a Monte-Carlo simulation that allows, for a given set of parameters (magnetic field strength, background radiation…) a quantitative study of the energy distribution of the electrons in the gap and the associated electromagnetic radiation. In the following we demonstrate that the vacuum gap model is capable of reproducing the observed VHE spectrum at low and high activity states.
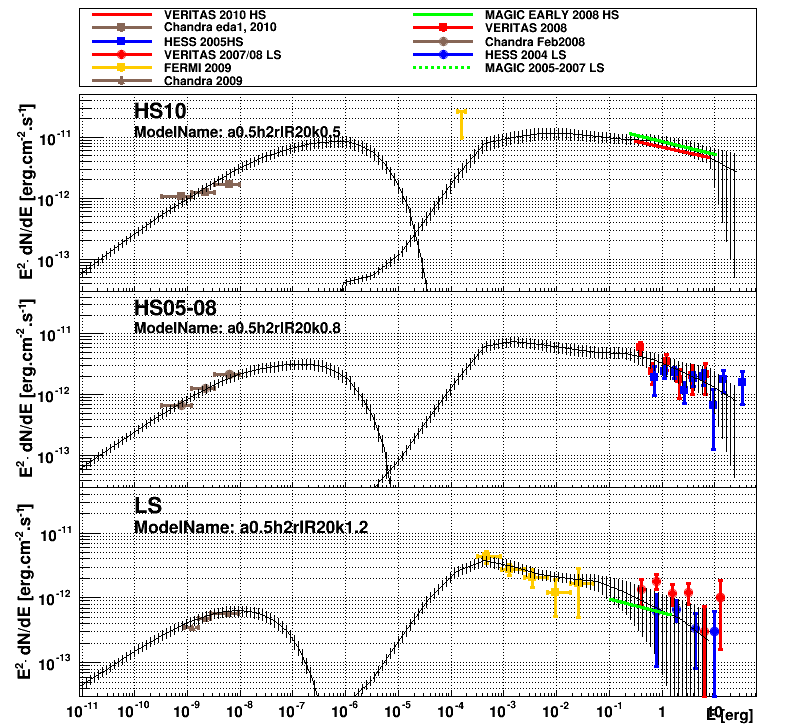
The radio galaxy M87 is normally a steady and weak source at TeV energies and to date, there have been three well documented flaring episodes: 2005 April, 2008 February and 2010 April. The spectra measured during the TeV flares did not show any evidence of a cut-off, suggesting a weak absorption. The long-term monitoring observations afford the opportunity of a more detailed look into the characteristics of the source at low emission level. In figure 5, we show both the spectral energy distribution (SED) of the synchrotron and the inverse Compton scattered radiation. We report (black lines) the emission from the magnetosphere model relative to the high states observed in 2005-2008 (denoted HS05-08) and 2010 (denoted HS10), together with the low emission state (denoted LS). The data from different VHE instruments have also been reproduced: The fit functions reported by MAGIC in early 2008 February (green line; [56]), and between 2005 and 2007 - characteristics to a low-emission state - (green dash-dotted lines; [49]), the fit function reported by VERITAS during the 2010 April flare (red line; [50]); the differential energy spectra measured by VERITAS [51] during the 2008 February flare (red filled squares) and between 2007 December and 2008 May - corresponding to a low state emission - (red filled circles); the differential energy spectrum obtained from the 2004 (red filled circles) and the 2005 (blue filled squares) HESS data [4]. In the high-energy gamma-ray range, the orange filled squares correspond to the Fermi-LAT energy spectrum from Abdo et al. [52], the orange arrow corresponds to the 95 confidence upper limits ( MeV) reported by Fermi-LAT and coincident with the announcement by MAGIC of a TeV flare in 2010 February (http://fermisky.blogspot.de/2010/02/lat-limit-on-m87-during-tev-flare.html). The brown filled squares reproduced the X-ray emission as measured by Chandra in 2008 and are contemporaneous to the joint MAGIC, HESS and VERITAS 2008 observation campaign, the brown filled circles report the nuclear emission on 2010 April 11 - this event was observed at a time when the TeV flaring was over [53], the brown filled triangles reproduce the images obtained in week intervals between 2008 and 2009 May observed (PI: D. E. Harris).
The magnetosphere model provides a satisfactory solution for both the high and the low states observed.
It is compatible with the initial assumption that the different phases of activity are originating from the
same emission region near the radio core.
And the strength of the induced electric field drives the acceleration efficiency of the charged particles.
A feature of the model is that the TeV and X-ray fluxes are correlated.
It should be emphasised that the 2010 April data are not simultaneous, in particular,
by the night when Chandra obtained the first observation, the TeV flaring was over.
This may explain the over-estimated X-ray flux level predicted by the magnetosphere model.
6.1 Estimate of the local value of the charge density
The longitudinal electric field in the accelerating gap arises due to deviation of the charge density from the local GJ charge density. When the absolute value of the local charge density is less than , an accelerating electric field is formed, leading to the cascade development. When || < ||, a decelerating electric field is formed suppressing the particle acceleration in the gap. Therefore the magnetosphere model is consistent if the local value of the charged density is weak enough to be responsible for the development of the instabilities. In this section, we calculate the Goldreich-Julian density and the local charge density. We then attempt to evaluate the accretion rate.
Estimate of the accretion rate in an inefficient accretion flow is about a factor lower than in a Bondi flow , where is the viscosity parameter [54], so that one expects the Goldreich-Julian density to be . Using the Poisson’s equation
| (6.1) |
one finds the local value of the density is related to the critical density by
| (6.2) |
More details are included in the Appendix A. For our standard model, we consider the strength of the magnetic field in the vicinity of the black hole and in the vacuum gap to be respectively and . For a split-monopole field geometry, the magnetic field scales as , which suggests the distance of the vacuum gap to the black hole to be . Assuming , the critical charge density at the gap’s location is , and for , the local value of the charge density .
However, these estimates are uncertain because of their dependence on the accretion rate , the electron-ion temperature ratio, and the standard BZ predictions [55]. But exploring these parameter dependencies are beyond the scope of this paper.
7 TeV luminosity and the hole’s spin
Using the observational data in the VHE regime (i.e. GeV), the -ray luminosity can be estimated. The photon spectral luminosity is given by [58]
| (7.1) |
here is the opening angle of the emission cone, is the differential photon spectrum in units of photons per unit time, unit area and energy , represents the optical depth for a photon traveling from the source with initial energy . The values used for were taken from [59]. The luminosity distance to the source is defined as
| (7.2) |
where is the Hubble parameter at redshift . Corrections for both adiabatic energy losses due to the redshift and attenuation due to interactions with the radiation are considered in equation 7.1.
For the differential photon spectrum detected at Earth, we use the values of the fit parameter measured by [50]
| (7.3) |
where the flux normalisation constant is and the spectral index is 2.19. The measured integral luminosity is obtained by integrating , and
| (7.4) |
For each electron propagating in the gap of height , the energy-loss rate is estimated as . The electric potential difference across a gap, with a magnetic field , generated by a black hole of angular momentum , can be expressed as,
| (7.5) |
Inside the gap, the field aligned electric field is unscreened and this implies that the density of electrons in the gap is limited by . The funnel is a strongly magnetised region that develops over the poles, and is nearly devoid of matter. Its geometry consists of a cone with an opening .
Taking into account that the volume of the gap is , the maximum gamma-ray power that can be produced by charged particles accelerating in the gap, regardless of the specific gamma-ray production mechanism is
| (7.6) |
where is the voltage drop across the gap height , and .
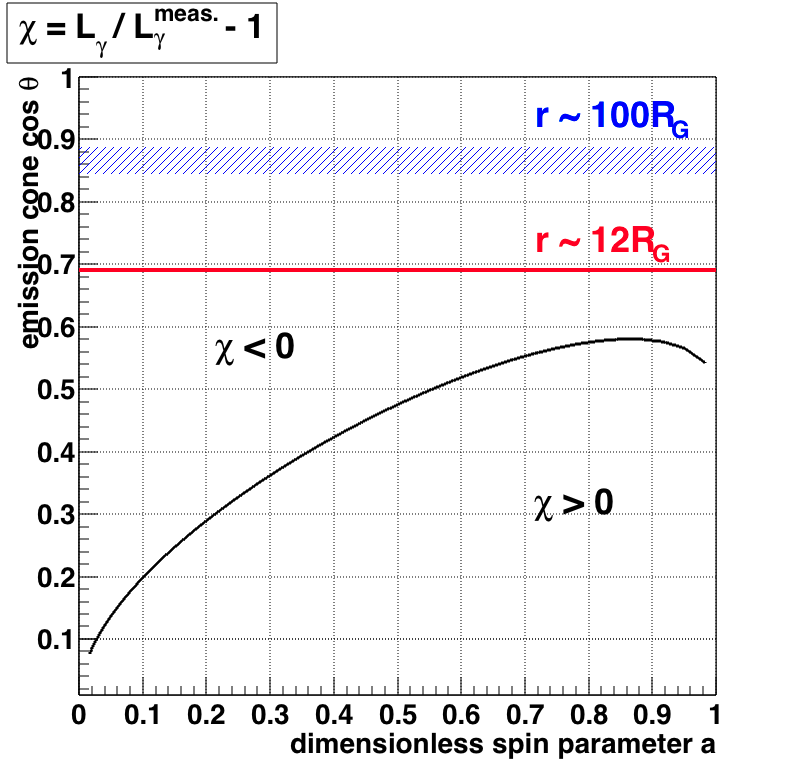
Figure 6 shows the allowed region that satisfies the condition . Thus, if the angular momentum of the BH is large enough, and the TeV -ray emission beamed into a cone with an opening angle , the non-thermal power of the gap can account for the observed TeV -ray luminosity. VLBI observations [21] show that the jet opening angle is continuously increasing as the core is approached, reaching within 0.04pc (). Furthermore, Doeleman et al. [61] resolves the base of the M87 jet. They show that the projected jet width fits with a power law , where is the jet width and is the separation from the core. At an apparent core distance of , the result of the fit gives . For comparison purposes, we find the jet width value to be at a distance of , i.e. . Our estimate is consistent with those based on radio observations for spin parameters .
8 Summary
Nearby under-luminous and mis-aligned AGN emerge as prime candidate sources where non-thermal VHE processes occurring close to the central BH are observable. The radio galaxy M87 is a unique source that harbours a substantially inclined jet with respect to the observer. The broadband emission originating near the supermassive black hole is not necessarily swamped by the relativistically boosted jet flux, and the high-energy emission signatures, e.g. the day-scale variability, have triggered new theoretical developments.
The particular picture developed in this paper considers a region which is magnetically dominated but not, in general, in a state of force-free equilibrium. The fluctuations - initiated by the intermittence of the accretion rate - in the outflow will be responsible for the formation of gaps. The charges injected into the gap are quickly accelerated by the large potential drop, and reach large Lorentz factor at which energy gain is balanced by synchrotron and inverse Compton losses. The exact location of the vacuum gap in the BH magnetosphere can only be found by numerically modelling the charge supply, the geometry of the accretion flow, and the formation of the force-free magnetosphere. Therefore, the gap model examined in this study should be considered a useful toy model for the gap geometry.
In the case of M87, we show that the 2008 and 2010 observed TeV -ray emission can be explained by electron acceleration and -ray production in a compact region close to the event horizon. The same mechanism, with a relatively weak rotation-induced electric fields, may also account for the 2009 low state. In this scenario, the intermittences of the gap potential are related to the changes of the charge density into the magnetosphere. We estimated these densities for the flare and the low states and we noted that the changes will be associated with the accretion rate fluctuations.
The magnetosphere model is applicable to variable TeV-emitting AGN that accrete at sufficiently low rates, in particularly Cen A. If Cen A hosts a radiatively inefficient inner accretion disk, it could thus be another primary in which VHE processes close to the black hole may allow a fundamental diagnosis of its immediate environment, offering important insights into the central engine in AGNs.
Acknowledgments
I wish to thank Stephan LeBohec for hepful discussions. I am grateful to Michelle Hui for her comments on the VERITAS observations and Dan Harris who provided the Chandra data. I acknowledge support through the Helmholtz Alliance for Astroparticle Particle.
Appendix A Derivation of equation 6.2
The electric potential difference across a gap height generated by a maximally rotating BH is [60]
| (A.1) |
For a split-monopole field geometry, the magnetic field scales as . Assuming that the gap height extends along the magnetic field lines to the height , the potential drop and the divergence of the electric field parallel to the magnetic field are given by
| (A.2) |
where is the magnetic field strength near of the horizon of the hole. We approximate the volume integral over the Poisson’s equation 6.1 by
| (A.3) | |||||
| (A.4) |
Using equations A.2, A.3 & A.4, we get
| (A.5) |
References
- [1] Gebhardt, K., & Thomas, J., The Black Hole Mass, Stellar Mass-to-Light Ratio, and Dark Halo in M87, ApJ 700 (2009) [arXiv:0906.1492]
- [2] Mei, S., et al., The ACS Virgo Cluster Survey. XIII. SBF Distance Catalog and the Three-dimensional Structure of the Virgo Cluster, ApJ 655 (2007) [astro-ph/0702510 ]
- [3] Aharonian, F., et al., Is the giant radio galaxy M87 a TeV gamma-ray emitter?, A&A 403 (2003) [astro-ph/0302155]
- [4] Aharonian, F., et al., Fast Variability of Tera-Electron Volt Rays from the Radio Galaxy M87, Science 314 (2006) [astro-ph/0612016]
- [5] Harris, D. E., Cheung, C. C., Biretta, J. A., Sparks, W. B., Junor, W., Perlman, E. S., & Wilson, A. S., The Outburst of HST-1 in the M87 Jet, ApJ 640 (2006) [astro-ph/0511755]
- [6] Harris, D. E., Cheung, C. C., Stawarz, Ł., Biretta, J. A., & Perlman, E. S., Variability Timescales in the M87 Jet: Signatures of E2 Losses, Discovery of a Quasi Period in HST-1, and the Site of TeV Flaring, ApJ 699 (2009) [arXiv:0904.3925]
- [7] Cheung, C. C., Harris, D. E., & Stawarz, Ł., Superluminal Radio Features in the M87 Jet and the Site of Flaring TeV Gamma-Ray Emission, ApJL 663 (2007) [arXiv:0705.2448]
- [8] Harris, D. E., Massaro, F., Cheung, C. C., et al., An Experiment to Locate the Site of TeV Flaring in M87, ApJ 743 (2011) [arXiv:1111.5343]
- [9] Beilicke, M., Hui, C. M., Mazin, D., Raue, M., Wagner, R. M., & Wagner, S., A joint H.E.S.S./MAGIC/VERITAS observation campaign on the radio galaxy M 87 to probe the origin of VHE -ray emission, American Institute of Physics Conference Series 1085 (2008)
- [10] Acciari, V. A., Aliu, E., Arlen, T., et al., Radio Imaging of the Very-High-Energy -Ray Emission Region in the Central Engine of a Radio Galaxy, Science 325 (2009) [arXiv:0908.0511]
- [11] Blandford, R. D., & Znajek, R. L., Electromagnetic extraction of energy from Kerr black holes, MNRAS 179 (1977)
- [12] Wilms, J., Reynolds, C. S., Begelman, M. C., et al., XMM-EPIC observation of MCG-6-30-15: direct evidence for the extraction of energy from a spinning black hole?, MNRAS 328 (2001) [astro-ph/0110520]
- [13] Maraschi, L., & Tavecchio, F., The Jet-Disk Connection and Blazar Unification, ApJ 593 (2003) [astro-ph/0205252]
- [14] Georganopoulos, M., Perlman, E. S., & Kazanas, D., Is the Core of M87 the Source of Its TeV Emission? Implications for Unified Schemes, ApJL 634 (2005) [astro-ph/0510783]
- [15] Georganopoulos, M., & Kazanas, D., Relativistic and Slowing Down: The Flow in the Hot Spots of Powerful Radio Galaxies and Quasars, ApJL 589 (2003) [astro-ph/0304256]
- [16] Georganopoulos, M., Perlman, E. S., & Kazanas, D., Is the Core of M87 the Source of Its TeV Emission? Implications for Unified Schemes, ApJL 634 (2005) [astro-ph/0510783]
- [17] Tavecchio, F., & Ghisellini, G., Spine-sheath layer radiative interplay in subparsec-scale jets and the TeV emission from M87, MNRAS 385 (2008) [arXiv:0801.0593]
- [18] Lenain, J.-P., Boisson, C., Sol, H., & Katarzyński, K., SSC scenario for VHE emission from 2 radiogalaxies: M 87 and Cen A, A&A 478 (2008) [arXiv:0807.2733]
- [19] Giannios, D., Uzdensky, D. A., & Begelman, M. C., Fast TeV variability from misaligned minijets in the jet of M87, MNRAS 402 (2010) [arXiv:0907.5005]
- [20] Barkov, M. V., Aharonian, F. A., & Bosch-Ramon, V., Gamma-ray Flares from Red Giant/Jet Interactions in Active Galactic Nuclei, ApJ 724 (2010) [arXiv:1005.5252]
- [21] Junor, W., Biretta, J. A., & Livio, M., Formation of the radio jet in M87 at 100 Schwarzschild radii from the central black hole, Nature 401 (1999)
- [22] Ly, C., Walker, R. C., & Junor, W., High-Frequency VLBI Imaging of the Jet Base of M87 ApJ 660 (2007) [astro-ph/0701511]
- [23] Asada, K., & Nakamura, M., The Structure of the M87 Jet: A Transition from Parabolic to Conical Streamlines, ApJL 745 (2012) [arXiv:1110.1793]
- [24] Neronov, A., & Aharonian, F. A., Production of TeV Gamma Radiation in the Vicinity of the Supermassive Black Hole in the Giant Radio Galaxy M87, ApJ 671 (2007) [arXiv:0704.3282]
- [25] Rieger, F. M., & Aharonian, F. A., Production of TeV Gamma Radiation in the Vicinity of the Supermassive Black Hole in the Giant Radio Galaxy M87 International Journal of Modern Physics D 17 (2008) [arXiv:0704.3282]
- [26] Vincent, S., & LeBohec, S., Monte Carlo simulation of electromagnetic cascades in black hole magnetosphere, MNRAS 409 (2010)
- [27] Levinson, A., & Rieger, F., Variable TeV Emission as a Manifestation of Jet Formation in M87?, ApJ 730 (2011) [arXiv:1011.5319]
- [28] MacDonald, D., & Thorne, K. S., Black-hole electrodynamics - an absolute-space/universal-time formulation, MNRAS 198 (1982)
- [29] Beskin, V. S., Istomin, Y. N., & Parev, V. I., Filling the Magnetosphere of a Supermassive Black-Hole with Plasma, Soviet Ast. 36 (1992)
- [30] Hirotani, K., & Okamoto, I., Pair Plasma Production in a Force-free Magnetosphere around a Supermassive Black Hole, ApJ 497 (1998)
- [31] Levinson, A., Particle Acceleration and Curvature TeV Emission by Rotating, Supermassive Black Holes, Physical Review Letters 85 (2000)
- [32] Aharonian, F. A., Belyanin, A. A., Derishev, E. V., Kocharovsky, V. V., & Kocharovsky, V. V., Constraints on the extremely high-energy cosmic ray accelerators from classical electrodynamics, Phys. Rev. D 66 (2002) [astro-ph/0202229]
- [33] Wald, R. M., Black hole in a uniform magnetic field, Phys. Rev. D 10 (1994)
- [34] Goldreich, P., & Julian, W. H., Pulsar Electrodynamics, ApJ 157 (1969)
- [35] Hawley, J. F., & Krolik, J. H., Magnetically Driven Jets in the Kerr Metric, ApJ 641 (2006) [astro-ph/0512227]
- [36] Beckwith, K., Hawley, J. F., & Krolik, J. H., Transport of Large-Scale Poloidal Flux in Black Hole Accretion, ApJ 707 (2009) [arXiv:0906.2784]
- [37] Kharb, P., & Shastri, P., Optical nuclei of radio-loud AGN and the Fanaroff-Riley divide, A&A 425 (2004) [astro-ph/0401042]
- [38] Whysong, D., & Antonucci, R., Thermal Emission as a Test for Hidden Nuclei in Nearby Radio Galaxies, ApJ 602 116 (2004) [astro-ph/0207385]
- [39] Macchetto, F., Marconi, A., Axon, D. J., et al., The Supermassive Black Hole of M87 and the Kinematics of Its Associated Gaseous Disk, ApJ 489 (1997) [astro-ph/9706252]
- [40] Di Matteo, T., Allen, S. W., Fabian, A. C., Wilson, A. S., & Young, A. J., Accretion onto the Supermassive Black Hole in M87, ApJ 582 (2003) [astro-ph/0202238]
- [41] Narayan, R., & Yi, I., Advection-dominated Accretion: Underfed Black Holes and Neutron Stars, ApJ 452 (1995) [astro-ph/9411059]
- [42] Mościbrodzka, M., Gammie, C. F., Dolence, J. C., & Shiokawa, H., Pair Production in Low-luminosity Galactic Nuclei, ApJ 735 (2011) [arXiv:1104.2042]
- [43] McKinney, J. C., & Gammie, C. F., A Measurement of the Electromagnetic Luminosity of a Kerr Black Hole, ApJ 611 (2004) [astro-ph/0404512]
- [44] Komissarov, S. S., Electrodynamics of black hole magnetospheres, MNRAS 350 (2004)
- [45] Komissarov, S. S., Time-dependent, force-free, degenerate electrodynamics, MNRAS 336 (2002) [astro-ph/0202447]
- [46] McKinney, J. C., General relativistic magnetohydrodynamic simulations of the jet formation and large-scale propagation from black hole accretion systems , MNRAS 368 (2006) [astro-ph/0603045]
- [47] Contopoulos, I., Kazanas, D., & Papadopoulos, D. B., The Force-free Magnetosphere of a Rotating Black Hole, ApJ 765 (2013) [arXiv:1212.0320]
- [48] Albert, J., Aliu, E., Anderhub, H., et al., Very High Energy Gamma-Ray Observations of Strong Flaring Activity in M87 in 2008 February, ApJL 685 (2008) [arXiv:0806.0988]
- [49] Aleksić, J., Alvarez, E. A., Antonelli, L. A., et al., MAGIC observations of the giant radio galaxy M 87 in a low-emission state between 2005 and 2007, A&A 544 (2012) [arXiv:1207.2147]
- [50] Aliu, E., Arlen, T., Aune, T., et al., VERITAS Observations of Day-scale Flaring of M 87 in 2010 April, ApJ746 (2012)
- [51] Acciari, V. A., Aliu, E., Arlen, T., et al., Veritas 2008-2009 Monitoring of the Variable Gamma-ray Source M 87, Science 325 (2009) [arXiv:1005.0367]
- [52] Abdo, A. A., Ackermann, M., Ajello, M., et al., Fermi Large Area Telescope Gamma-Ray Detection of the Radio Galaxy M87, ApJ 707 (2009) [arXiv:0910.3565]
- [53] Harris, D. E., Massaro, F., Cheung, C. C., et al., An Experiment to Locate the Site of TeV Flaring in M87, ApJ 743 (2011) [arXiv:1111.5343]
- [54] Narayan, R., Lighthouses of the Universe: The Most Luminous Celestial Objects and Their Use for Cosmology, 405 (2002)
- [55] Penna, R. F., Narayan, R., & Sadowski, A., emphGeneral relativistic magnetohydrodynamic simulations of Blandford-Znajek jets and the membrane paradigm, MNRAS 436 (2013) [arXiv:1307.4752]
- [56] Albert, J., Aliu, E., Anderhub, H., et al., Very High Energy Gamma-Ray Observations of Strong Flaring Activity in M87 in 2008 February, ApJL, 685 (2008)
- [57] Acciari, V. A., Aliu, E., Arlen, T., et al., Veritas 2008-2009 Monitoring of the Variable Gamma-ray Source M 87, ApJ, 716 (2010)
- [58] Gehrels, N., Use of Fν spectral energy distributions for multiwavelength astronomy., Nuovo Cimento B Serie 112 (1997)
- [59] Franceschini, A., Rodighiero, G., & Vaccari, M., Extragalactic optical-infrared background radiation, its time evolution and the cosmic photon-photon opacity, A&A, 487 (2008)
- [60] Thorne, K. S., Price, R. H., & MacDonald, D. A. 1986, Black Holes: The Membrane Paradigm,
- [61] Doeleman, S. S., Fish, V. L., Schenck, D. E., et al. 2012, Science, 338, 355