SNSN-XXX-YY
Fermionic decays of SM Higgs
Andrey Pozdnyakov
on behalf of the ATLAS and CMS collaborations
Department of Physics and Astronamy
Northwestern University, Evanston, IL, USA
In this document I present an overview of the recent results published by ATLAS and CMS collaborations on the searches for SM Higgs boson decay to fermions. The document summarizes the status of the analyses up to September of 2014 and contains the results of pp collision Data at 7 and 8 TeV. Searches for , , and processes are presented.
PRESENTED AT
XXXIV Physics in Collision Symposium
Bloomington, Indiana, September 16–20, 2014
1 Introduction
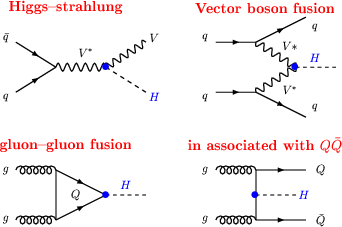
The existence of the scalar boson with mass of 125 GeV has been established. The properties of this new particle thus far are consistent with the standard model (SM) Higgs boson. Decay modes for its discovery, and , provide an indirect evidence for Higgs coupling to top quark due to its production in gluon-gluon fusion process (Fig. 1). Nevertheless a direct evidence for its decay to fermions is crucial in order to uncover the true nature of the new particle. Standard Model predicts that the coupling of the Higgs to fermions is proportional to the mass of the fermion, hence one expects larger branching fraction of the decay to heavier leptons. For example for a 125 GeV Higgs SM predicts , .
In proton-proton collisions at LHC leading Higgs boson production mechanisms are (Fig. 1): gluon-gluon fusion (ggF) – about 88% for SM Higgs with GeV at TeV; Vector Boson Fusion (VBF) – 7%; associated production with a Z or W boson (VH) – 5%; and a fusion (ttH) – 0.4%.
Even though ggF process dominates, there are experimental advantages of VBF and VH modes: tagging events with extra particles and reducing the backgrounds. In VH production the tag is based on the leptonic decays of the Z/W bosons: missing transverse energy from neutrinos () and/or leptons – W()H, Z()H and Z()H. Let me note the branching ratios of those decays: per lepton, , .
Typical VBF tag requires an event with two jets with GeV and .
This Note summarizes recent results released by ATLAS and CMS experiments up to September of 2014. It includes analyses of the pp Data sets at TeV with and TeV with .
2
The search for decay is challenging experimentally due to several reasons: (1) reconstruction of the from neutrinos, which is difficult at hadronic colliders; (2) jet reconstruction and energy resolution in hadronic final states; (3) large irreducible background from process.
In addition the analysis complicates by three different final states due to decay modes of the taus: (12%), (46%), (42%).
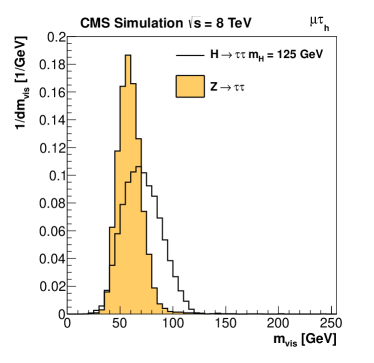
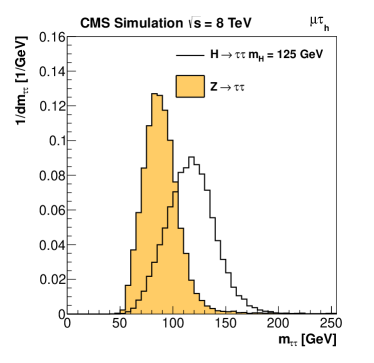
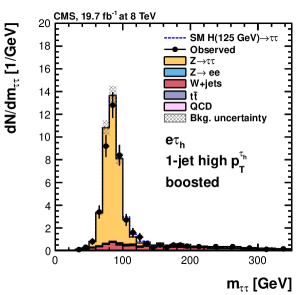
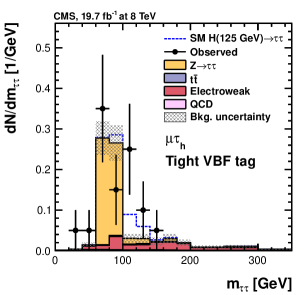
Reconstruction of the Higgs boson candidate mass, , from the visible decay products of the -lepton is one of the key ingredients of the analysis. Both ATLAS and CMS accomplish this with similar methods: ATLAS makes use of Missing Mass Calculator algorithm [2], while CMS does matrix element Likelihood Function minimization [3]. See Fig. 2 for the validation of this procedure from CMS.
Both ATLAS and CMS estimate the contribution from background using so-called embedding technique: they take well identified events in Data and insert the -leptons instead of the muons in those events. Tau particles are then decayed by TAUOLA program (which takes into account polarization) and detector simulation of those decays is inserted into the Data events. This technique is shown to perform very well with various validation tests both in Data and Monte Carlo (MC).
2.1 ATLAS Analysis
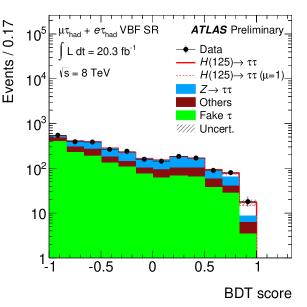
In order to increase sensitivity of the analysis events are separated into mutually independent categories based on the presence of jets and their topology (VBF), and of the Higgs candidate. Major backgrounds (besides already mentioned ) are estimated from Data (different methods used in different final states).
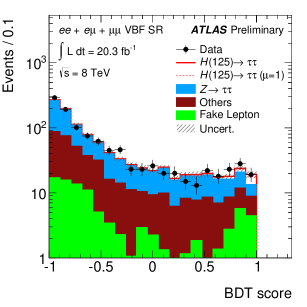
After basic pre-selection of events BDT training is performed with 6-9 most important variables (including ). Separate BDTs are trained for each final state and event category. Then, a global likelihood fitting is done using the BDT scores and event rates in the control regions.
2.2 CMS Analysis
Additional categories are introduced (compared to the ATLAS analysis) based on the number of jets, VBF and VH topology, and . Shape and yield of major backgrounds are estimated from Data: from the embedding method; QCD from same-sign lepton events. For some other backgrounds the shape is taken from MC while normalization is from Data: , W+jets, .
A global fit is performed using variable for most categories (while BDT is used for final states).
2.3 Results for
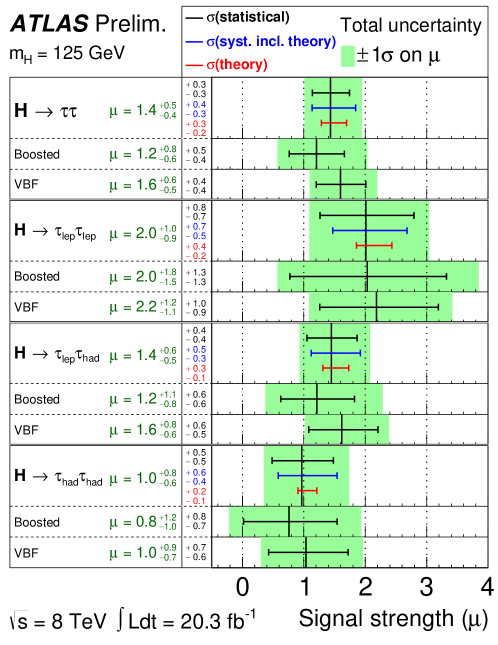
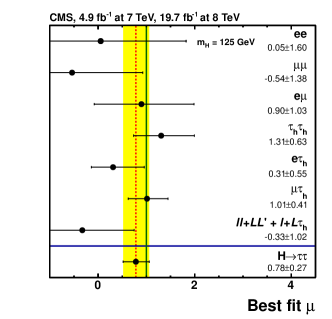
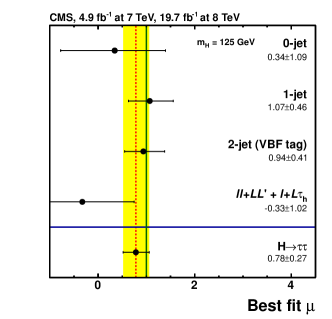
Once the final background composition is determined from the global fit in control regions one looks into the signal region to determine the amount of excess (if any). Both experiments do see an excess of events over the backgrounds with significance greater than and the signal strength of (ATLAS) and (CMS), which constitutes the evidence for decay!
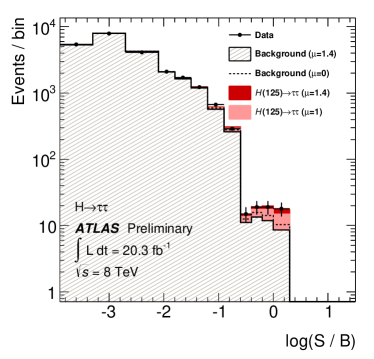
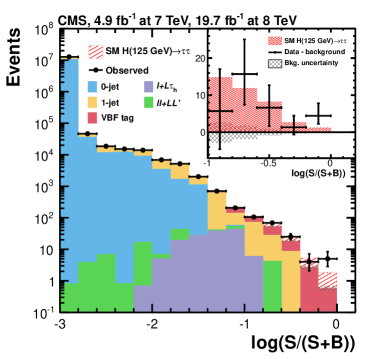
See Figs. 5 and 6 for the details on the signal strength across all the analysis categories. The breakdown of uncertainties from ATLAS is instructive – systematics dominate and the largest one is the theoretical uncertainty (due PDFs, “scale”, NNLO corrections). Another visually attractive way to present the results is the distributions in Fig. 4, where events are binned according to their expected Signal-to-Background (S/B) ratio.
3
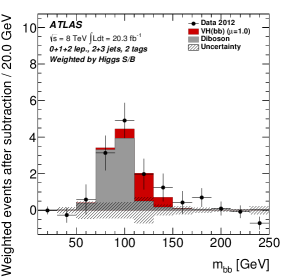
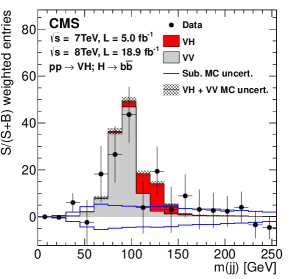
Very large background rate prevents doing this search in ggF channel. However, tagging events with an extra lepton and/or enables the analysis in VH channel, which is the way both ATLAS and CMS experiments go [5, 6]. (VBF channel is also possible but has lower sensitivity than VH (CMS); it is not presented here.) Besides the VH tagging, a key feature of the analysis is the possibility to identify the jets from b-quarks due to a displaced vertex. Efficiency of the b-jet ID varies but one can think of for simplicity.
4
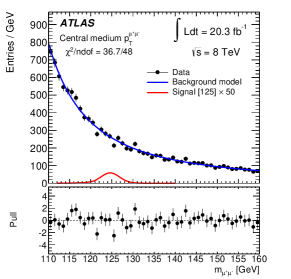
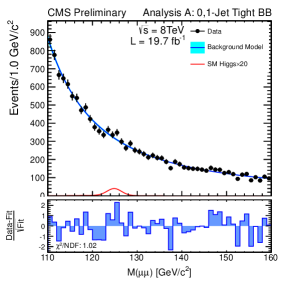
Decay of the Higgs to a pair of muons provides a clean final state and requires a rather simple analysis: one looks for a bump in the dimuon invariant mass, , spectrum. It is however a very small signal in SM, , and has large irreducible background from events.
Both experiments enhance the sensitivity of the search with event categorization [7] [8]. Here, for example, is a basic set up by ATLAS: (1) VBF tag, (2) Non-VBF category which is split further into 2 subcategories based on and 3 subcategories based on . (Both muons in or otherwise; three bins: (0–15), (15–50) and GeV.)
Background is estimated from a smooth fit to Data events. In non-VBF categories the background model is the sum of a Breit-Wigner (BW) function convoluted with a Gaussian (GS), and an exponential function divided by : ; while for VBF events it is the product of a Breit-Wigner and an exponential function: , where .
Signal model is obtained from MC via a fit to a Crystal Ball plus Gaussian function with the same mean value.
5 ttH
Search for ttH decay is the hardest among all, not only because of a tiny signal rate expected from SM, but also because of the experimentally difficult final state due to top quarks decay, .
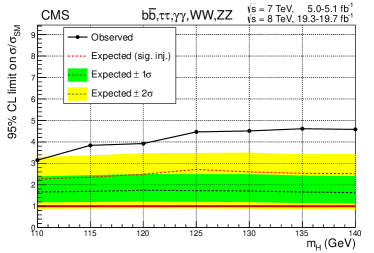
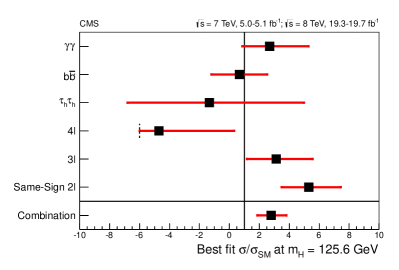
In order to see any events from Higgs boson one has to look first for the dominant decay, , which is the analysis done by ATLAS [9] (for GeV only). They put an upper limit of SM with the expected of SM. CMS analysis combines modes. The upper limit by CMS is set to SM with the expectation of SM [10]. A broad excess across is observed and found to be coming from same-sign di-muon events, see Fig. 11.
6 Summary
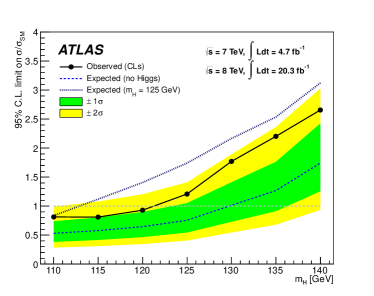
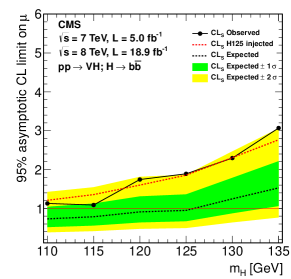
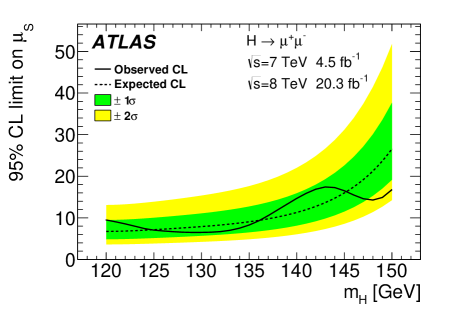
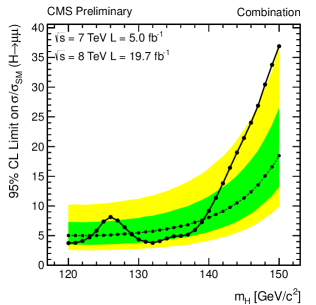
In spite of the very challenging analyses, both ATLAS and CMS experiments achieved significant progress in exploring decays. An excess of events with more that significance is reported in channel by both experiments – evidence for decay. The boundaries of search are pushed tremendously: expected limit on the signal strength is below one times the SM prediction.
decay and ttH production channel are still waiting for the right time (or better to say: more statistics) – we hope to see those peaks in the future!
So far everything is consistent with the Standard Model.
References
- [1] A. Djouadi, “Higgs Physics: Theory,” Pramana 79, 513 (2012) [arXiv:1203.4199 [hep-ph]].
- [2] ATLAS Collaboration, “Evidence for Higgs boson Yukawa couplings in the decay mode with the ATLAS detector”, ATLAS-CONF-2014-061, https://atlas.web.cern.ch/Atlas/GROUPS/PHYSICS/CONFNOTES/ATLAS-CONF-2014-061
- [3] CMS Collaboration, “Search for the Standard-Model Higgs boson decaying to tau pairs in proton-proton collisions at = 7 and 8 TeV”, CMS-PAS-HIG-13-004, https://twiki.cern.ch/twiki/bin/view/CMSPublic/Hig13004PubTWiki
- [4] ATLAS Collaboration, “Measurement of the cross section of high transverse momentum production in proton–proton collisions at = 8 TeV with the ATLAS Detector”, Phys. Lett. B 738, 25 (2014) [arXiv:1404.7042 [hep-ex]].
- [5] ATLAS Collaboration, “Search for the decay of the Standard Model Higgs boson in associated production with the ATLAS detector”, [arXiv:1409.6212 [hep-ex]].
- [6] CMS Collaboration, “Search for the standard model Higgs boson produced in association with a W or a Z boson and decaying to bottom quarks”, Phys. Rev. D 89, no. 1, 012003 (2014) [arXiv:1310.3687 [hep-ex]].
- [7] ATLAS Collaboration, “Search for the Standard Model Higgs boson decay to with the ATLAS detector”, Phys. Lett. B 738, 68 (2014) [arXiv:1406.7663 [hep-ex]].
- [8] CMS Collaboration, “Search for the standard model Higgs boson in the dimuon decay channel in pp collisions at = 7 and 8 TeV”, CMS-PAS-HIG-13-007, https://twiki.cern.ch/twiki/bin/view/CMSPublic/Hig13007TWiki
- [9] ATLAS Collaboration, “Search for produced in association with top quarks and constraints on the Yukawa coupling between the top quark and the Higgs boson using Data taken at 7 TeV and 8 TeV with the ATLAS detector”, [arXiv:1409.3122 [hep-ex]].
- [10] CMS Collaboration, “Search for the associated production of the Higgs boson with a top-quark pair”, JHEP 09, 087 (2014) [arXiv:1408.1682 [hep-ex]].