Extended, Dusty Star formation Fueled by a Residual Cooling Flow
in the Cluster of Galaxies Sérsic 159-03
Abstract
While the cooling of the hot intra-cluster medium (ICM) in the cores of galaxy clusters is mostly counteracted by heating from the central active galactic nucleus (AGN), the balance is not perfect. This can lead to residual cooling flows and low-level star formation, the physics of which is not well understood. Here we present a detailed study of the residual cooling flow in the center of the low mass galaxy cluster Sérsic 159-03 (A S1101) using far-ultraviolet imaging from the Hubble Space Telescope and far-infrared (FIR) spectroscopy and photometry from the Herschel space observatory, along with a wealth of archival data. We detect extended emission at UV, FIR, and [C ii], indicating a star formation rate of 1–3 yr-1, depending on the indicator and assumptions made. The most recently formed stars appear spatially coincident with the lowest entropy ICM. We speculate that this low-entropy gas has been displaced by the central AGN 7.5 kpc north of the cD galaxy. These data demonstrate that the displacement of the cooling core from the direct vicinity of the central AGN can temporarily break the feedback cycle and lead to cooling and star formation that is offset from the center of the galaxy. We find an abundance (107 M⊙) of cold (20 K) dust in the center of the cluster and a second FIR peak 30 kpc to the north of the central galaxy. If confirmed to be associated with the cooling filaments, this would be the most extended complex of dust yet found in a cool core cluster.
Subject headings:
cooling flows – galaxies: elliptical and lenticular, cD – galaxies: clusters: individual: Sérsic 159-03 – galaxies: inter-galactic medium – X-rays: galaxies: clusters1. Introduction
Groups and clusters of galaxies, with central cooling times of the hot X-ray emitting plasma shorter than the Hubble time, often host central dominant galaxies surrounded by bright, extended, filamentary optical emission-line nebulae (e.g., Johnstone et al., 1987; Crawford et al., 1999; Edwards et al., 2007; McDonald et al., 2010). These filaments of ionized gas are usually associated with both warm (1000–2000 K) molecular hydrogen seen in the near-infrared (e.g. Jaffe & Bremer, 1997; Falcke et al., 1998; Donahue et al., 2000; Edge et al., 2002; Hatch et al., 2005; Jaffe et al., 2005; Johnstone et al., 2007; Oonk et al., 2010; Lim et al., 2012) and with cold (30–100 K) atomic and molecular gas traced by [C II] (Edge et al., 2010a; Mittal et al., 2011, 2012; Werner et al., 2014) and CO (e.g. Edge, 2001; Edge & Frayer, 2003; Salomé & Combes, 2003; McDonald et al., 2012b). This cold gas is most likely produced by thermally unstable cooling from the hot phase (e.g. Voit et al., 2008; Gaspari et al., 2012; Sharma et al., 2012; Werner et al., 2014).
Many of these systems are experiencing star formation at rates of a few M⊙ year-1 (e.g. Hicks & Mushotzky, 2005; O’Dea et al., 2008; McDonald et al., 2011b). In rare, extreme cases, star formation can reach rates of up to 800 M⊙ year-1 (McDonald et al., 2012c). However, the global star-forming efficiency of the cold gas clouds at the centers of cool core clusters is relatively low, of order 10% (McDonald et al., 2011b, 2014). Star-forming brightest cluster galaxies are also often experiencing powerful outbursts of their central active galactic nuclei (AGN; e.g., McNamara et al., 2000, 2009; Ehlert et al., 2011). The detailed knowledge of the mechanisms that connect cooling, AGN feedback, and star formation is key for our understanding of the formation and evolution of early type galaxies.
Here we explore the relation between cooling, AGN feedback, and star formation in the low mass cooling-core cluster of galaxies Sérsic 159-03 (A S1101). The thermal properties and chemical composition of its hot intra-cluster medium (ICM) have been studied in detail using all current, major X-ray observatories: XMM-Newton (Kaastra et al., 2001; de Plaa et al., 2006), Suzaku (Werner et al., 2007) and Chandra (Werner et al., 2011). While the large scale X-ray morphology of the cluster is relatively relaxed, its core is strongly disturbed. The cluster center displays signs of powerful AGN feedback, which has mostly cleared the central kpc of the dense, X-ray emitting ICM (Werner et al., 2011). The relatively modest (factor of 1.5) temperature drop in the core of the cluster also indicates exceptionally powerful AGN activity in this system (Sun et al., 2009). The central dominant galaxy of the cluster shows dust lanes, molecular gas, excess UV emission, and a bright, 44 kpc long H+[N II] filamentary nebula, associated with low entropy, high metallicity, cooling X-ray emitting gas (Werner et al., 2011; Oonk et al., 2010; McDonald et al., 2012a; Farage et al., 2012). Werner et al. (2011) propose that the low entropy ICM has been uplifted by the powerful ‘radio mode’ AGN, and subsequently, because it has been removed from the direct influence of the AGN jets, it cools, falls back and forms stars.
In this paper, we study the cooling and star formation in Sérsic 159-03 using new far-ultra violet (FUV) images from the Hubble Space Telescope (HST) and far-infrared (FIR) data from Herschel, along with a wealth of archival data. Throughout the paper we assume for Sérsic 159-03, and CDM cosmology with H0 = 73 km s-1 Mpc-1, = 0.27, and = 0.73.
2. Data
In this paper, we utilize data across a wide range of wavelengths in an effort to explain the multiphase gas in the core of Sérsic 159-03. Below, we describe the acquisition and reduction of new data from the Herschel and Hubble space telescopes, along with supporting data at X-ray, optical, and radio wavelengths published in previous works.
2.1. HST ACS/SBC Far UV Imaging
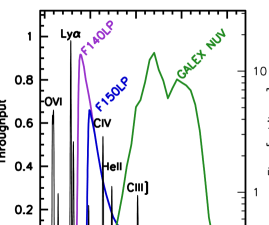
Far-UV imaging was acquired using the Advanced Camera for Surveys Solar Blind Channel (herafter ACS/SBC) on the Hubble Space Telescope (hereafter HST) in both the F140LP and F150LP bandpasses (PID #12570; PI Veilleux). The total exposure time in each filter was 1302s. Both pointings were centered at () = 348.49384∘, -42.7251∘, which provided overlap with the full extent of the complex H emission presented in McDonald et al. (2010). The choice of two far-UV filters was made for two reasons. First, the use of two filters allows us to remove the known ACS/SBC red leak, which has a non-negligible contribution due to the fact that the underlying BCG is very red and luminous. Since both F140LP and F150LP are long-pass filters, they have approximately the same throughput at 1500Å. Thus, the difference of these two filters yields a narrow effective bandpass from 1400–1500Å, which is free from any red leak emission. Secondly, as we show in Figure 2, this narrow bandpass is free of contamination from bright UV emission lines such as Ly, C iv, and He ii. Thus, we can conclude that any emission in the differenced image is most likely due to UV continuum.
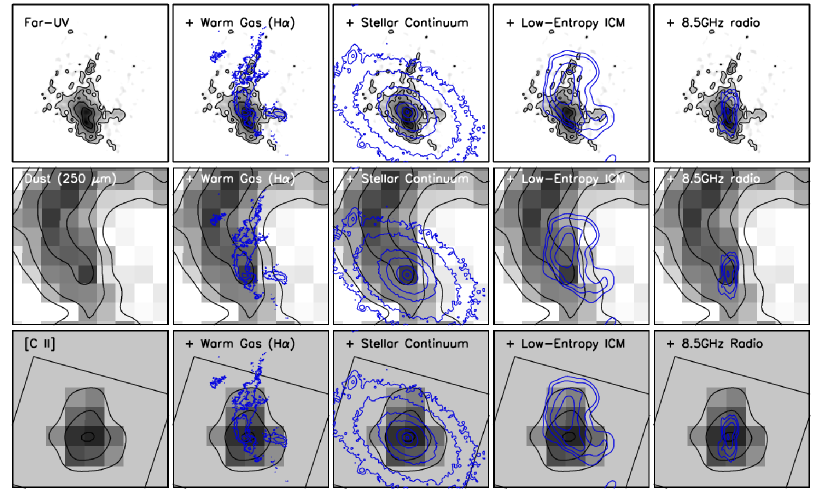
Following the differencing of the F140LP and F150LP images, we bin the images and smooth with a 1.5 pixel smoothing radius, yielding matching angular resolution at far-UV and H (see also McDonald et al., 2011b). This process improves the relatively poor quality of the raw data, allowing the detection of extended, filamentary features in the binned data. The final processed (differenced, binned, smoothed) image is shown in Figure 1, compared to imaging at a variety of other wavelengths.
2.2. Herschel PACS & SPIRE Imaging
We observed the FIR continuum emission in Sérsic 159-03 with the Photodetector Array Camera and Spectrometer (PACS; Poglitsch et al., 2010) and the Spectral and Photometric Imaging Receiver (SPIRE; Griffin et al., 2010).
PACS imaging observations (OBSIDs: 1342232470, 1342232471, 1342232472, 1342232473) were conducted in large-scan mapping mode with a medium speed of 20 arcsec/s in the blue-short (BS; 70 m), blue-long (BL; 100 m) and the red (R; 160 m) filters. At these wavelengths a resolution of about 5, 8 and 12 arcsec, respectively, is obtained. Each of the scans consisted of 10 scan line legs of 2 arcmin length with a cross-scan step of 4 arcsec. The scan and orthogonal cross-scan observations were reduced using the HIPE software version 8.2.0, using the PACS pipeline scanmap script for extended emission. Default settings for high-pass filter and the photometric projection task (PhotProject) were used. The script processes the data from level 0 (raw data) to level 2 (flux calibrated maps). The reduced and calibrated PACS maps have a size 3.5 arcmin by 7.3 arcmin. The uncertainty on the absolute flux scale is estimated to be less than 5 percent in all three PACS bands (Balog et al., 2014; Müller et al., 2014).
The SPIRE imaging observations (OBSID: 1342232366) were conducted in small-scan mapping mode. Simultaneous data at 250, 350 and 500 m was taken. At these wavelengths a resolution of about 18, 25 and 36 arcsec, respectively, is obtained. The observations were reduced using the HIPE software version 8.2.0, using the SPIRE POF10 pipeline script with default settings. This script processes the data from level 0 (raw data) to level 2 (flux calibrated maps). The reduced and calibrated SPIRE maps have a size 9.4 arcmin by 12.2 arcmin. The uncertainty on the absolute flux scale is estimated to be less than 5 percent in all three SPIRE bands (Bendo et al., 2013).
2.3. Herschel PACS Spectroscopy
We observed the FIR [C II]157m cooling line in Sérsic 159-03
with the PACS integral-field spectrometer (Poglitsch et al., 2010)
on the Herschel Space Observatory (OBSID: 1342234062). The observations were taken
in line spectroscopy mode with chopping-nodding to remove
the telescope background, sky background and dark current.
A chopper throw of 6 arcmin was used. The observations were
taken in pointed mode, targeting the center of the CC BCG.
The observations were reduced using the HIPE software
version 8.2.0, using the PACS ChopNodLineScan pipeline
script. This script processes the data from level 0 (raw channel
data) to level 2 (flux calibrated spectral cubes). The
uncertainty on the absolute flux scale for PACS spectroscopy is
estimated to be less than 30 percent111http://herschel.esac.esa.int/twiki/pub/Public/PacsCalib
rationWeb/PacsSpectroscopyPerformanceAndCalibration_v2_4.pdf.
During the final stage of the reduction, the data was spectrally and spatially rebinned into a 5 5 cube. This we will refer to as the rebinned cube. Each spatial pixel, termed spaxel, in this cube has a size of 9.4 9.4 arcsec2 and thus provides us with a field of view of 47 47 arcsec2. The wavelength regridding parameters oversample and upsample were set to 2 and 1, respectively. This means that one spectral bin corresponds to the native resolution of the PACS instrument. The integrated [C II] line flux was obtained by spatially integrating the rebinned cube.
To visualize the extent of the [C II] emission in Sersic 159-03, we created a sky map using the specProject task in HIPE and the hrebin task in IDL222http://idlastro.gsfc.nasa.gov/ftp/pro/astrom/hrebin.pro. We will refer to this cube as the projected cube. A pixel size of 6 arcsec was chosen in order to Nyquist sample the beam (12 arcsec FWHM) at the observed wavelength. We only consider spatial bins where the signal-to-noise ratio of the integrated line flux is greater than 2. We have compared the integrated line fluxes obtained from the rebinned and projected cube and find that they are consistent. Velocity and velocity width maps were constructed by fitting a single Gaussian to the projected cube data.
| Region | f | f | SFR | SFR | SFR | SFR/SFR |
|---|---|---|---|---|---|---|
| [10-28 erg/s/cm2/Hz] | [10-15 erg/s/cm2] | [M⊙ yr-1] | [M⊙ yr-1] | [M⊙ yr-1] | ||
| Center | 2.10 0.04 | 3.82 0.13 | 0.24 0.004 | 1.09 0.02 | 0.24 0.01 | 0.98 |
| North | 1.17 0.03 | 9.07 0.16 | 0.13 0.003 | 0.60 0.01 | 0.58 0.01 | 0.23 |
| East | 0.55 0.01 | 0.16 0.08 | 0.06 0.002 | 0.29 0.01 | 0.16 0.01 | 0.40 |
| Southeast | 1.65 0.07 | 0.04 0.04 | 0.19 0.007 | 0.85 0.03 | 0.04 0.002 | 4.25 |
| West | 0.35 0.02 | 0.50 | 0.04 0.003 | 0.18 0.01 | 0.03 | 9 |
| Northwest | 0.03 0.01 | 0.57 0.02 | 0.003 0.001 | 0.015 0.001 | 0.04 0.001 | 0.09 |
| Total | 5.9 0.09 | 16.03 0.23 | 0.66 0.01 | 3.03 0.04 | 1.02 | 0.65 |
2.4. Supporting Data
Throughout the remaining analysis, we compare these new data to previously-published data at a variety of wavelengths. We briefly describe these data below, directing the reader to earlier publications for a more complete description of the data acquisition and reduction.
Narrow-band H and continuum imaging was presented in McDonald et al. (2010, 2011a) on the central galaxy in Sérsic 159-03. These data were obtained using the Maryland-Magellan Tunable filter (Veilleux et al., 2010) on the Magellan Baade Telescope. The tunable narrow-band filter was centered on rest-frame H (6563Å) and 6463Å, with a width of 12Å. These two exposures were differenced in order to make a continuum-free map of H. Due to the narrow width of this filter, some fraction of the total gas may be missing if it is at high/low velocity. These losses are expected to be small, as wider filters do not reveal any additional structures (Jaffe et al., 2005; Werner et al., 2011). The MMTF H image revealed a complex, extended (35 kpc) filament to the north of the central cluster galaxy, along with a more narrow filament to the west and an isolated cloud to the northeast. Both the H and stellar continuum maps are shown in Figure 1.
In addition to the narrow-band continuum image, we use a 300 s exposure in the Bessel R-band from the Focal Reducer and Spectrograph (FORS1) camera on the Very Large Telescope (VLT). This image has a slightly higher angular resolution than the MMTF continuum image. A more detailed description of these broadband data are provided by Oonk et al. (2010).
X-ray data were obtained in 2009 using the Advanced Camera for Surveys (ACIS) on the Chandra X-ray Observatory, and presented in Werner et al. (2011). As part of their analysis, Werner et al. (2011) generated temperature, pressure, and entropy maps, along with unsharp masked images to highlight various substructures, which we utilize here. This earlier work found that the H emission was preferentially located in regions of high density and low entropy, which we demonstrate in Figure 1. For a complete description of the reduction and analysis of these data, we direct the reader to Million et al. (2010a, b) and Werner et al. (2011).
Radio data for the central galaxy in Sérsic 159-03 is available at a large range of frequencies from 244 MHz to 8.5 GHz. These data are summarized in Werner et al. (2011). Here we primarily utilize the 8.5 GHz data from the Very Large Array (VLA) in order to determine the direction of the radio jets. The 8 GHz maps have angular resolution of , and reveal a powerful radio source centered on the BCG with a jet direction nearly aligned in the north-south direction, as can be seen in Figure 1.
In addition to the data described above, we note the availability of spatially-resolved optical spectroscopy along the two brightest H filaments from McDonald et al. (2012a) and near-IR spectroscopy from Oonk et al. (2010). These data provide kinematics, reddening, and ionization information for the warm ionized and warm molecular gas phases in the extended emission line nebula. While these data are not explicitly utilized in this work, we lean on results from both of these works in our interpretation of the newly-acquired UV and IR emission.
3. Results
Below, we summarize new results based on these deep Herschel and HST data. We defer a discussion of the greater context of these results to the following section.
3.1. Young Stellar Populations
We detect extended UV emission both to the north and west of the galaxy center (see Figures 1, 3), overlapping well with the H in these regions. The maximal extent of the UV emission is 30 kpc to the north and 15 kpc to the west. The UV emission to the north and west is clumpy, consistent with what is found in other cool core clusters (e.g., McDonald & Veilleux, 2009; O’Dea et al., 2010). Roughly 10% of the total UV emission in the northern filament comes from a single point source – likely a massive, young star cluster (see discussion section below). As was discussed in §2.1, the narrow bandpass (F140LP-F150LP) does not contain any bright emission lines, suggesting that this is continuum UV emission. Johnstone et al. (2012) show that such continuum emission could come from hydrogen two-photon interactions in the particle heating model of Ferland et al. (2009). However, this model predicts a ratio of the UV flux to the H flux of 0.0082, while we measure a value of 0.05 (see Table 1). Correcting for intrinsic extinction would further increase the difference between the model and data in this case, suggesting that particle heating is not producing the UV continuum here. Further, the clumpiness of the UV continuum emission favors a stellar origin. In general, the majority of the H emission is accompanied by UV emission, with the exception of the faint cloud to the northeast. In addition to being coincident with H emission, the northern and western UV-bright filaments are coincident with both warm molecular gas (Oonk et al., 2010) and low-entropy intracluster plasma (Werner et al., 2011).
 |
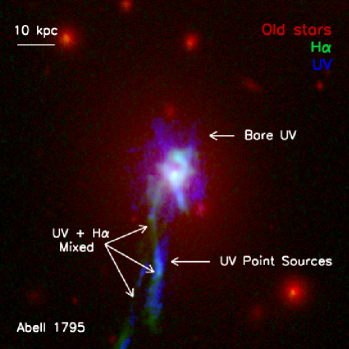 |
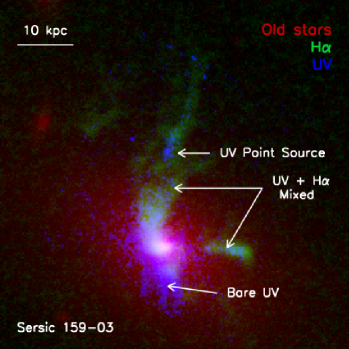
To the south and east of the central galaxy, we detect extended UV continuum emission in the absence of H emission. The UV peak is offset by 5 kpc to the south of the central galaxy. This offset may be due to the fact that the dust emission peaks on the central galaxy, which may be obscuring much of the UV emission at this position. Figure 3 highlights the H-free UV emission to the south, with two distinct filaments extending radially in this direction (Figure 3). These short, H-free filaments are similar to what we observe north of the central galaxy in Abell 1795. Both of these clusters have extended filaments of mixed H and UV emission in one direction, with “bare” UV filaments in the counter direction. This may indicate that recently-formed stars have fallen back onto the central galaxy, with the stars over-shooting the galaxy and the gas accumulating in the center. Given the freefall time at the entropy minimum (40 Myr), the youngest stars that make it to the galaxy center ought to be B stars, which may be another explanation for the lack of H emission. To the east, the UV emission is relatively diffuse and has a similar morphology to the old stellar population (see Figure 1). However, the fact that this emission is not symmetric around the center suggests that this is not UV emission from old stars (e.g., Hicks & Mushotzky, 2005), but rather diffuse emission from a young stellar population.
In Table 1 we show the integrated UV flux in the F140LP passband for various morphologically-defined regions. The total UV flux in this system is 5.9 0.09 10-28 erg s-1 cm-2 Hz-1. Assuming no intrinsic extinction and that all of the UV flux comes from young stars, this corresponds to a star formation rate (SFR) of 0.66 M⊙ yr-1, following Kennicutt (1998). This is most likely an underestimate of the total SFR, given that we measure significant reddening via optical spectroscopy (McDonald et al., 2012a) and IR continuum emission (Figure 1). Assuming an empirically-calibrated relation between intrinsic extinction and UV luminosity (Rosa-González et al., 2002), we estimate an extinction-corrected star formation rate of M⊙ yr-1. This is slightly higher than the H-derived star formation rate of 1 M⊙ yr-1, where we have again assumed that the H flux is entirely due to photo-ionization by young stars. This difference may be, in part, due to the narrow bandpass of the MMTF – Werner et al. (2011) quote an H flux 35% higher than our measured value, using a wider bandpass. Unfortunately, this wider bandpass is contaminated by emission from the [N ii] doublet, meaning that the true H flux most likely lies somewhere between these two measurements.
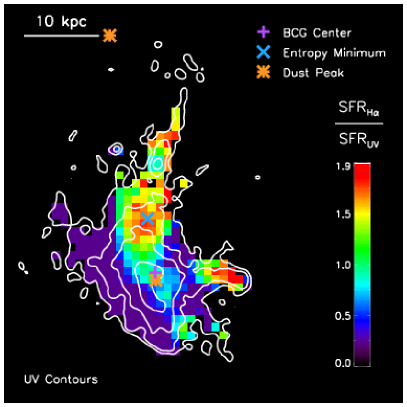
We measure a broad range of UV/H ratios across the full extent of the central galaxy, suggesting that simple continuous star formation is insufficient to explain the UV and H morphologies. To the west and southeast of the galaxy center, there is a dearth of H emission. This can not be explained by extinction or by including an additional source of ionization. The likely explanation is that the stellar populations in these regions are older than in the more extended filaments. If we carry this explanation further and assume that the H/UV ratio probes the age of the young stars – where recently-formed stars have an abundance of ionizing O stars, and older stellar populations have their UV flux dominated by weakly-ionizing B stars – we can make a pseudo-age map by simply dividing these two images. This is demonstrated in Figure 4. We find that the H/UV ratio peaks to the north of the central galaxy, precisely where the ICM entropy is minimized. Given that the IR emission is relatively faint at this position (see Figure 1), we expect that this high ratio is not a result of intrinsic extinction. Instead, we propose that this northern region, along with the bright western filament, are sites of ongoing star formation. In contrast, the southern and western regions have low H/UV ratios, suggesting an older stellar population. We will return to this discussion of stellar ages in §4.
3.2. IR Morphology – Extended Gas and Dust Emission
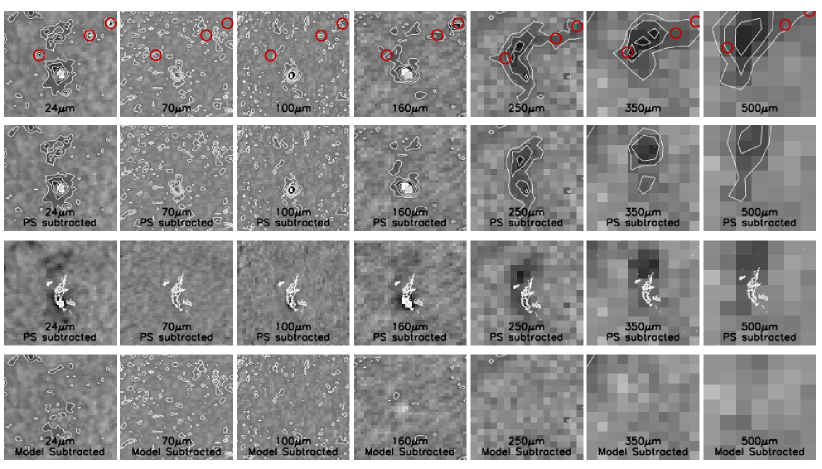
In Figure 1 we show that the 250m emission peaks on the central cluster galaxy and extends to the northwest, out to the maximum extent of the H filaments. In Figure 5 we show that this dust emission is present at all wavelengths 24m, while the central galaxy is brightest at 250m. Modeling and subtracting emission from three nearby point sources, we can isolate the extended dust emission. This emission is peaked just north of the H filament. The brightness of this dust at such long wavelengths suggests that it is cold (12 K; see §3.3), if it is located at the distance of Sérsic 159-03. The amount of dust in the extended region to the north and northeast is sufficient to prevent the detection of any UV emission from this region, perhaps explaining why the UV emission is not as extended in this direction as the H emission.
3.3. Dust Temperature & Mass
The relative lack of extended emission at shorter wavelengths suggests that the dust to the north of the galaxy is significantly cooler than that in the center. This is confirmed in Figure 6, which shows the IR spectral energy distributions (SEDs) for the core emission (centered on the BCG) and the extended emission to the north of the central galaxy. A pair of modified blackbody models were fit to these SEDs, assuming and normalizing the absorption cross section to (250m) = 4.0 cm2 g-1 (Weingartner & Draine, 2001). We note that this normalization term is known to be quite uncertain (e.g., Bianchi, 2013). In the inner 20 kpc, the dust has a mix of temperatures with a total dust mass of 107 M⊙. The majority of the flux comes from a cool 20 K component, likely associated with the star formation in the central galaxy. A second, warmer (54 K), component in the core is likely attributed to the central AGN. These two dust temperatures are consistent with typical values for star-forming galaxies and central AGN (e.g., Clemens et al., 2013).
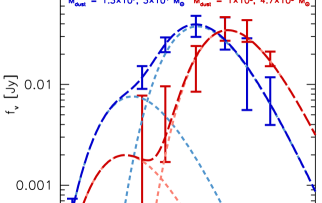
The extended emission originates predominantly from cold dust (12 K), with M M⊙. Interestingly, this suggests that the vast majority of the dust, by mass, is at large radii (30 kpc). The total dust mass in this system is similar to that observed in Abell 1068 and Zw 3146 (Edge et al., 2010b), despite the fact that these clusters have star formation rates more than a factor of ten times higher than that measured in the center of Sérsic 159-03. We measure a small secondary peak at 60 K, suggesting that some of the dust in this cloud is being heated, perhaps by interaction with the ICM.
Considering only the cool dust in the central region, where we see evidence for star formation, the total infrared luminosity is L L⊙, corresponding to a star formation rate of 2.3 M⊙ yr-1, following (Bell, 2003). The total infrared luminosity from cool dust in the extended region is L L⊙, suggesting that there may be an additional 1 M⊙ yr-1 in obscured star formation in the extended northern filament.
3.4. Cold gas
Figure 1 demonstrates that [C ii] 157m emission is present along the full extent of the UV/H filaments, suggesting that there is a substantial amount of cold (100 K) gas in the core of Sérsic 159-03. Similar to the UV emission, the cool gas is significantly more extended to the south and west of the central galaxy than the H emission. We measure an integrated [C ii] flux of erg s-1 cm-2, corresponding to a luminosity of erg s-1. Roughly 40% of this emission is coming from the central spaxel. Following Herrera-Camus et al. (2014), we estimate a SFR derived from the [C ii] of M⊙ yr-1, which is within a factor of 2 of the H-, UV-, and FIR-derived estimates.
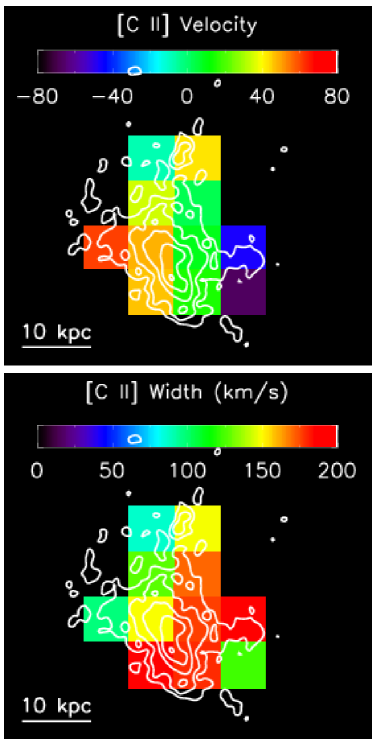
The pixel-to-pixel detection of [C ii] emission is only marginally significant, preventing us from performing a detailed kinematic analysis of the cold gas. Broadly speaking (Figure 7) the kinematics of the cold gas appear consistent with those of the warm molecular (Oonk et al., 2010) and ionized (McDonald et al., 2012a) gas. The velocity dispersion peaks at a value of 200 km s-1 toward the galaxy center, dropping to 100 km s-1 in the more extended filaments. There is very little variation in the line-of-sight velocity along the extended filaments ( 50 km s-1), suggesting that the filaments lie (primarily) in the plane of the sky.
4. Discussion
Below, we discuss possible interpretations of the UV, IR, and [C ii] 157m emission presented in §3. This is, by no means, an exhaustive list of possible contributing sources, but is meant to provide a broad, coherent picture of what may be occurring in the core of Sérsic 159-03.
4.1. Star Formation in Condensing, Low-Entropy ICM
In §3 and previous works (McDonald et al., 2010, 2012a; Werner et al., 2011; Oonk et al., 2010) we show significant evidence for star formation in the central galaxy of Sérsic 159-03. The measured star formation rate of 1–3 M⊙ yr-1 (derived from UV, H, far-IR, and [C ii]) is concentrated in the center of the galaxy, but extends in all directions for 10–15 kpc and to the north for 35 kpc. Werner et al. (2011) showed that the extended northern filament is coincident with an offset cool core, suggesting that star formation may be triggered by whatever process has dislodged the cool core from the minimum of the gravitational potential.
Sloshing of the cool core following an interaction with another massive system is the most common explanation for offset cool cores (e.g., ZuHone et al., 2010, 2011; Blanton et al., 2011; Ehlert et al., 2014). The large-scale X-ray emission of the ICM is, however, extremely smooth in this system (Werner et al., 2011), with no obvious indications of sloshing (i.e., cold fronts, spiral structure, asymmetric isophotes). An alternative explanation, for which there is some evidence, is that a burst of radio-mode feedback has dislodged the cool core to the north. This hypothesis is consistent with the direction of the radio jet (Figure 1) which is aligned along the north-south direction. Following the strategy described in Sun (2009), we can estimate whether or not the current AGN power is sufficient to displace the cool core. Requiring an energy outburst of to remove the cool core yields an estimate of erg s-1, assuming a timescale of 108 yr ( s), a cool core radius of 30 kpc ( cm3), and a core pressure of 0.012 keV cm-3 ( erg cm-3; Werner et al., 2011). Following Bîrzan et al. (2008), and using the measured 1.4 GHz luminosity of erg s-1 Hz-1 (Werner et al., 2011), we estimate a mechanical power of 1044erg s-1 from the radio-loud AGN. Thus, it appears that the current outburst of AGN feedback is sufficient, both in power and direction, to displace the cool core to its current, observed position.
In this scenario, the hot gas is displaced most easily by the radio-mode feedback – the molecular gas, warm gas, and dust are not as easily pushed around by the AGN jets. We speculate then that the filaments of young stars and ionized gas are, instead, due to recent star formation as the cool core moves from the center to the north – not unlike a passing raincloud leaving everything in its path wet. Werner et al. (2011) estimate that the age of the extended filament is 108 yr. Removed from the direct influence of the central AGN, and compressed by the AGN jets/lobes, the displaced cool core should cool rapidly. This scenario is corroborated by the peak in the H/UV ratio at precisely the location of the entropy minimum. This seems to indicate that the youngest, strongly-ionizing O stars are located at the entropy minimum, regardless of whether or not that minimum lies in the cluster center. There are, of course, other possible explanations for a high H/UV ratio. Reddening due to dust would reduce the observed UV flux considerably more so than the H flux. However, both the dust map (Figure 5) and the reddening map (McDonald et al., 2012a) show minimal dust at the position of the entropy minimum. Alternatively, the H/UV ratio could be increased by including a secondary ionization source such as shocks (e.g., McDonald et al., 2012a), particle heating (e.g., Ferland et al., 2009), or mixing with the hot ICM (e.g. Fabian et al., 2011). We note that both the [O i]/H ratio and the velocity dispersion are minimized at the position of the entropy minimum, suggesting that turbulent mixing and/or shocks are probably not strong contributors. Given that the spectral signatures of cooling and mixing are, for the most part, indistinguishable, it is difficult to rule out the possibility that the H may peak due to the cooling enhancement at this position. In either case (cooling, mixing, star formation), the H/UV peak appears to be signaling the presence of rapid cooling at the position of the entropy minimum, leading to the formation of the stars in the northern filament.
Following these same lines of arguments, the low values of the H/UV ratio in the center, south, and western regions would indicate that the stars here are slightly older. These stars were likely formed when the cool core was still centered on the BCG, and the cooling/feedback loop was closed. The recent burst of AGN feedback has disrupted this loop, halting star formation in the central regions and relocating it to the northern filament.
Star formation from extended filaments produced by AGN uplift may contribute significantly to the formation of the outer stellar haloes and massive star-clusters surrounding cD galaxies (Canning et al., 2010, 2014). About 10% of the observed UV emission in the northern filament of Sérsic 159-03 comes from a single massive, young star cluster (see Figure 3). This is consistent with the star forming filaments in the outskirts of the Perseus Cluster, where 10% of the young star light is in star-clusters (Canning et al., 2014).
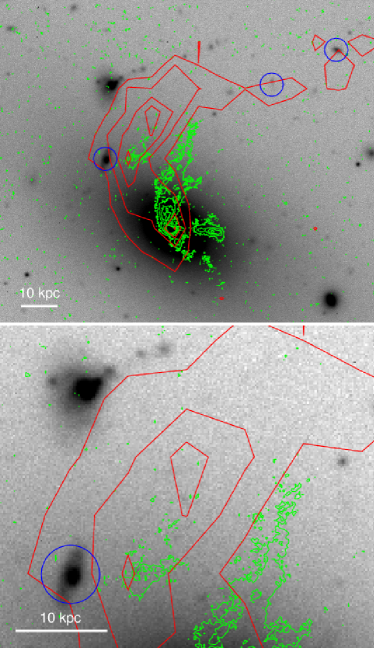
Shock heating and compressing the cold gas by a galaxy falling through the core of the cluster might also have triggered and enhanced the star formation rate in the filament (e.g. Roediger et al., 2014). Optical images of the cluster core show a pair of small, perturbed galaxies 30–40 kpc northeast of the cD galaxy (see Figure 8). It is unclear whether either of these galaxies are cluster members (we lack redshift information), although their apparent size and magnitude are appropriate given the distance to Sersic 159-03. If these galaxies passed through the cluster core (the core passage would have occurred 60 Myr ago) they might have interacted with the cold gas in the cluster center, triggering some of the observed star formation and contributing to the disturbed distribution of the cold gas. Further, some of the warm, ionized gas, specifically in the northeast filament, may have been stripped from the satellite galaxy during this interaction. Given the morphology of the bulk of the H and UV emission (corresponding well with the X-ray morphology), we do not expect that a significant fraction of the gas or stars were stripped from these galaxies, but their passage may aid in the triggering of star formation and the “stretching out” of additional filaments via tidal interactions.
4.2. Origin of Dusty Filament
We find a significant amount of extended, cold dust to the north of the central galaxy in Sérsic 159-03 (Figure 5). This massive (108 M⊙ yr-1) cloud of cold (12 K) dust extends to the north of the central galaxy for 30 kpc, making it the most extended complex of dust yet found in a cool core cluster. If truly associated with the star-forming filaments, it suggests that these filaments extend further to the north than is observed, and would explain why the UV emission is less extended than the H emission. There is, however, the possibility that this dust is associated with background galaxies, in an unfortunate alignment with both the central galaxy and the extended filament.
Attributing this dust to background galaxies would help alleviate the issue of sustaining such a large quantity of cold dust surrounded by hot intracluster gas. Deep optical imaging along the 250 m filament reveals three galaxies which may be contributing to the IR flux (Figure 8) and are coincident with peaks in the extended northern filament. Emission from these sources were subtracted and removed (see Figure 5). In the residual IR peak, highlighted in Figure 8, we see no evidence for background galaxies. This would, conservatively, put a lower limit of on 0.1L∗ galaxies that may be contributing to the cold dust peak to the north of the central galaxy in Sersic 159-03. If this IR emission did, indeed, come from galaxies at it would imply L L⊙, which is a factor of 10 times larger than the typical luminosity of an “ultraluminous infrared galaxy” (Gao & Solomon, 1999; Klaas et al., 2001).
In the absence of an alternative, viable explanation for the source of the dust, we conclude that it is most likely associated with the northern star-forming filament. It is unclear how dust this cold (12 K) can avoid being heated by the hot ICM, but the fact that we see a warm (60 K) component in the extended emission suggests that the dust cloud may be in the process of heating up along the outer surface. Future observations with ALMA will allow us to both confirm that the dust is indeed linked to the cooling filament, and look for cold molecular gas along its full extent.
5. Summary
Cooling and star formation in the cores of clusters of galaxies appear to be regulated by feedback from the central AGN. Here, we studied the properties of the dusty, filamentary cold gas and star formation in the core of the galaxy cluster Sérsic 159-03 using new FUV images from HST and FIR data from Herschel, along with a wealth of archival data. We find:
-
•
Extended, filamentary and clumpy UV emission, indicating a star formation rate of –3 yr-1 and an abundance () of cold (20 K) dust in the center of the cluster. The morphology of the UV, H, [C ii], and IR emission are all broadly consistent with one another.
-
•
The most recently formed stars, indicated by the peak H/UV ratio, are spatially coincident with the lowest entropy ICM, that has been displaced by the AGN 7.5 kpc north of the center of the cD galaxy. This suggests that the displacement of the cooling core from the direct vicinity of the central AGN can temporarily break the feedback cycle and lead to cooling and star formation that is offset from the center of the galaxy.
-
•
Extended FIR continuum emission is observed north to north-east of the central galaxy. If this FIR emission is located at the distance of the cluster then this implies that large amounts (108 M⊙) of cold (12 K) dust may be associated with the H filament 30 kpc north of the central galaxy. This would be the most extended complex of dust yet found in a cool core cluster. If associated with the cooling flow, this would imply an additional 1 M⊙ yr-1 of obscured star formation.
These results, and our interpretation, could be corroborated by high angular resolution sub-mm observations, both of cold molecular gas and far-IR continuum. If the “focus” of cooling has really been relocated from the cluster center, then we would expect the cold gas reservoir to be depleted on the central galaxy, and enhanced to the north.
Acknowledgements
Herschel is an ESA space observatory with science instruments provided by European-led Principal Investigator consortia and with important participation from NASA. M. M. acknowledges support by NASA through a Hubble Fellowship grant HST-HF51308.01-A awarded by the Space Telescope Science Institute, which is operated by the Association of Universities for Research in Astronomy, Inc., for NASA, under contract NAS 5-26555. We also acknowledge support from grant HST-GO-12570.01-A. NW thanks Rebecca Canning for helpful discussions.
References
- Balog et al. (2014) Balog, Z., Müller, T., Nielbock, M., et al. 2014, Experimental Astronomy, 37, 129
- Bell (2003) Bell, E. F. 2003, ApJ, 586, 794
- Bendo et al. (2013) Bendo, G. J., Griffin, M. J., Bock, J. J., et al. 2013, MNRAS, 433, 3062
- Bianchi (2013) Bianchi, S. 2013, A&A, 552, A89
- Bîrzan et al. (2008) Bîrzan, L., McNamara, B. R., Nulsen, P. E. J., Carilli, C. L., & Wise, M. W. 2008, ApJ, 686, 859
- Blanton et al. (2011) Blanton, E. L., Randall, S. W., Clarke, T. E., et al. 2011, ApJ, 737, 99
- Canning et al. (2010) Canning, R. E. A., Fabian, A. C., Johnstone, R. M., et al. 2010, MNRAS, 405, 115
- Canning et al. (2014) Canning, R. E. A., Ryon, J. E., Gallagher, J. S., et al. 2014, MNRAS, 444, 336
- Clemens et al. (2013) Clemens, M. S., Negrello, M., De Zotti, G., et al. 2013, MNRAS, 433, 695
- Crawford et al. (1999) Crawford, C. S., Allen, S. W., Ebeling, H., Edge, A. C., & Fabian, A. C. 1999, MNRAS, 306, 857
- de Plaa et al. (2006) de Plaa, J., Werner, N., Bykov, A. M., et al. 2006, A&A, 452, 397
- Donahue et al. (2000) Donahue, M., Mack, J., Voit, G. M., et al. 2000, ApJ, 545, 670
- Edge (2001) Edge, A. C. 2001, MNRAS, 328, 762
- Edge & Frayer (2003) Edge, A. C., & Frayer, D. T. 2003, ApJ, 594, L13
- Edge et al. (2002) Edge, A. C., Wilman, R. J., Johnstone, R. M., et al. 2002, MNRAS, 337, 49
- Edge et al. (2010a) Edge, A. C., Oonk, J. B. R., Mittal, R., et al. 2010a, A&A, 518, L46
- Edge et al. (2010b) —. 2010b, A&A, 518, L47
- Edwards et al. (2007) Edwards, L. O. V., Hudson, M. J., Balogh, M. L., & Smith, R. J. 2007, MNRAS, 379, 100
- Ehlert et al. (2014) Ehlert, S., McDonald, M., Miller, E. D., David, L. P., & Bautz, M. W. 2014, ArXiv e-prints, arXiv:1406.4352
- Ehlert et al. (2011) Ehlert, S., Allen, S. W., von der Linden, A., et al. 2011, MNRAS, 411, 1641
- Fabian et al. (2011) Fabian, A. C., Sanders, J. S., Williams, R. J. R., et al. 2011, MNRAS, 417, 172
- Falcke et al. (1998) Falcke, H., Rieke, M. J., Rieke, G. H., Simpson, C., & Wilson, A. S. 1998, ApJ, 494, L155
- Farage et al. (2012) Farage, C. L., McGregor, P. J., & Dopita, M. A. 2012, ApJ, 747, 28
- Ferland et al. (2009) Ferland, G. J., Fabian, A. C., Hatch, N. A., et al. 2009, MNRAS, 392, 1475
- Gao & Solomon (1999) Gao, Y., & Solomon, P. M. 1999, ApJ, 512, L99
- Gaspari et al. (2012) Gaspari, M., Ruszkowski, M., & Sharma, P. 2012, ApJ, 746, 94
- Griffin et al. (2010) Griffin, M. J., Abergel, A., Abreu, A., et al. 2010, A&A, 518, L3
- Hatch et al. (2005) Hatch, N. A., Crawford, C. S., Fabian, A. C., & Johnstone, R. M. 2005, MNRAS, 358, 765
- Herrera-Camus et al. (2014) Herrera-Camus, R., Bolatto, A. D., Wolfire, M. G., et al. 2014, ArXiv e-prints, arXiv:1409.7123
- Hicks & Mushotzky (2005) Hicks, A. K., & Mushotzky, R. 2005, ApJ, 635, L9
- Jaffe & Bremer (1997) Jaffe, W., & Bremer, M. N. 1997, MNRAS, 284, L1
- Jaffe et al. (2005) Jaffe, W., Bremer, M. N., & Baker, K. 2005, MNRAS, 360, 748
- Johnstone et al. (2012) Johnstone, R. M., Canning, R. E. A., Fabian, A. C., et al. 2012, MNRAS, 425, 1421
- Johnstone et al. (1987) Johnstone, R. M., Fabian, A. C., & Nulsen, P. E. J. 1987, MNRAS, 224, 75
- Johnstone et al. (2007) Johnstone, R. M., Hatch, N. A., Ferland, G. J., et al. 2007, MNRAS, 382, 1246
- Kaastra et al. (2001) Kaastra, J. S., Ferrigno, C., Tamura, T., et al. 2001, A&A, 365, L99
- Kennicutt (1998) Kennicutt, Jr., R. C. 1998, ARA&A, 36, 189
- Klaas et al. (2001) Klaas, U., Haas, M., Müller, S. A. H., et al. 2001, A&A, 379, 823
- Lim et al. (2012) Lim, J., Ohyama, Y., Chi-Hung, Y., Dinh-V-Trung, & Shiang-Yu, W. 2012, ApJ, 744, 112
- McDonald et al. (2014) McDonald, M., Roediger, J., Veilleux, S., & Ehlert, S. 2014, ApJ, 791, L30
- McDonald & Veilleux (2009) McDonald, M., & Veilleux, S. 2009, ApJ, 703, L172
- McDonald et al. (2011a) McDonald, M., Veilleux, S., & Mushotzky, R. 2011a, ApJ, 731, 33
- McDonald et al. (2012a) McDonald, M., Veilleux, S., & Rupke, D. S. N. 2012a, ApJ, 746, 153
- McDonald et al. (2010) McDonald, M., Veilleux, S., Rupke, D. S. N., & Mushotzky, R. 2010, ApJ, 721, 1262
- McDonald et al. (2011b) McDonald, M., Veilleux, S., Rupke, D. S. N., Mushotzky, R., & Reynolds, C. 2011b, ApJ, 734, 95
- McDonald et al. (2012b) McDonald, M., Wei, L. H., & Veilleux, S. 2012b, ApJ, 755, L24
- McDonald et al. (2012c) McDonald, M., Bayliss, M., Benson, B. A., et al. 2012c, Nature, 488, 349
- McNamara et al. (2009) McNamara, B. R., Kazemzadeh, F., Rafferty, D. A., et al. 2009, ApJ, 698, 594
- McNamara et al. (2000) McNamara, B. R., Wise, M., Nulsen, P. E. J., et al. 2000, ApJ, 534, L135
- Million et al. (2010a) Million, E. T., Allen, S. W., Werner, N., & Taylor, G. B. 2010a, MNRAS, 405, 1624
- Million et al. (2010b) Million, E. T., Werner, N., Simionescu, A., et al. 2010b, MNRAS, 407, 2046
- Mittal et al. (2011) Mittal, R., O’Dea, C. P., Ferland, G., et al. 2011, MNRAS, 418, 2386
- Mittal et al. (2012) Mittal, R., Oonk, J. B. R., Ferland, G. J., et al. 2012, MNRAS, 426, 2957
- Müller et al. (2014) Müller, T., Balog, Z., Nielbock, M., et al. 2014, Experimental Astronomy, 37, 253
- O’Dea et al. (2008) O’Dea, C. P., Baum, S. A., Privon, G., et al. 2008, ApJ, 681, 1035
- O’Dea et al. (2010) O’Dea, K. P., Quillen, A. C., O’Dea, C. P., et al. 2010, ApJ, 719, 1619
- Oonk et al. (2010) Oonk, J. B. R., Jaffe, W., Bremer, M. N., & van Weeren, R. J. 2010, MNRAS, 405, 898
- Poglitsch et al. (2010) Poglitsch, A., Waelkens, C., Geis, N., et al. 2010, A&A, 518, L2
- Roediger et al. (2014) Roediger, E., Brüggen, M., Owers, M. S., Ebeling, H., & Sun, M. 2014, MNRAS, 443, L114
- Rosa-González et al. (2002) Rosa-González, D., Terlevich, E., & Terlevich, R. 2002, MNRAS, 332, 283
- Salomé & Combes (2003) Salomé, P., & Combes, F. 2003, A&A, 412, 657
- Sharma et al. (2012) Sharma, P., McCourt, M., Quataert, E., & Parrish, I. J. 2012, MNRAS, 420, 3174
- Sun (2009) Sun, M. 2009, ApJ, 704, 1586
- Sun et al. (2009) Sun, M., Voit, G. M., Donahue, M., et al. 2009, ApJ, 693, 1142
- Veilleux et al. (2010) Veilleux, S., Weiner, B. J., Rupke, D. S. N., et al. 2010, AJ, 139, 145
- Voit et al. (2008) Voit, G. M., Cavagnolo, K. W., Donahue, M., et al. 2008, ApJ, 681, L5
- Weingartner & Draine (2001) Weingartner, J. C., & Draine, B. T. 2001, ApJ, 548, 296
- Werner et al. (2007) Werner, N., Kaastra, J. S., Takei, Y., et al. 2007, A&A, 468, 849
- Werner et al. (2011) Werner, N., Sun, M., Bagchi, J., et al. 2011, MNRAS, 415, 3369
- Werner et al. (2014) Werner, N., Oonk, J. B. R., Sun, M., et al. 2014, MNRAS, 439, 2291
- ZuHone et al. (2010) ZuHone, J. A., Markevitch, M., & Johnson, R. E. 2010, ApJ, 717, 908
- ZuHone et al. (2011) ZuHone, J. A., Markevitch, M., & Lee, D. 2011, ApJ, 743, 16