The Search for a Complex Molecule in a Selected Hot Core Region: A Rigorous Attempt to Confirm trans-Ethyl Methyl Ether toward W51 e1/e2
Abstract
An extensive search has been conducted to confirm transitions of trans-ethyl methyl ether (tEME, C2H5OCH3), toward the high mass star forming region W51 e1/e2 using the 12 m Telescope of the Arizona Radio Observatory (ARO) at wavelengths from 2 mm and 3 mm. In short, we cannot confirm the detection of tEME toward W51 e1/e2 and our results call into question the initial identification of this species by Fuchs et al. (2005). Additionally, reevaluation of the data from the original detection indicates that tEME is not present toward W51 e1/e2 in the abundance reported by Fuchs and colleagues. Typical peak-to-peak noise levels for the present observations of W51 e1/e2 were between 10 - 30 mK, yielding an upper limit of the tEME column density of 1.5 1015 cm-2. This would make tEME at least a factor 2 times less abundant than dimethyl ether (CH3OCH3) toward W51 e1/e2. We also performed an extensive search for this species toward the high mass star forming region Sgr B2(N-LMH) with the NRAO 100 m Green Bank Telescope (GBT). No transitions of tEME were detected and we were able to set an upper limit to the tEME column density of 4 1014 cm-2 toward this source. Thus, we are able to show that tEME is not a new molecular component of the interstellar medium and that an exacting assessment must be carried out when assigning transitions of new molecular species to astronomical spectra to support the identification of large organic interstellar molecules.
1 Introduction
It is quite clear that our understanding of the molecular complexity of interstellar and circumstellar environments is rapidly growing. It is also apparent that our understanding of interstellar molecular synthesis is presently incomplete; observations of new interstellar molecules are currently outpacing the model predictions as to how these interstellar species are formed in astronomical environments. In addition, many searches for interstellar species have focused on complex organic molecules of biological significance, (e.g. Zaleski et al. (2013), Loomis et al. (2013), Belloche et al. (2008)). Since the detection of glycolaldehyde (HOCH2CHO) there have been 60 new molecular species claimed in interstellar and circumstellar environments. Furthermore, a majority of these claimed detections have involved complex organic species including alcohols (vinyl alcohol (CH2CHOH), Turner & Apponi (2001); ethylene glycol (HOCH2CH2OH), Hollis et al. (2002)); aldehydes (propenal (CH2CHCHO), propanal (CH3CH2CHO), Hollis et al. (2004)); amino acids (glycine (NH2CH2COOH), Kuan et al. (2003)) sugars (dihydroxyacetone (CH2OHCOCH2OH), Widicus Weaver & Blake (2005)) and ethers (C2H5OCH3, hereafter tEME, Fuchs et al. (2005)).
Large organic molecules typically have high line strength (S 50 D2), low energy transitions ( 50 K) that span the millimeter and submillimeter spectrum (e.g. Carroll et al. (2010)). Thus, it appears that the unambiguous identification of large molecules would be straightforward given the number of transitions available to search. Yet, the detection of new molecules becomes difficult at millimeter and submillimeter wavelengths due in large part to the line confusion of more well-known interstellar species, including isotopic variants. It has been estimated that in the 2 mm and 3 mm windows, there are approximately 10 lines per 100 MHz at sensitivity levels of 10 mK, toward high mass hot molecular cores (HMCs) (Halfen et al., 2006). In the case of Sgr B2(N-LMH), perhaps the most well studied region to search for new interstellar species, the chance of finding a line at a particular LSR velocity ( 2 km s-1) of a measured spectral line frequency is 40%, assuming simple Gaussian line profiles (Halfen et al., 2006). Searching a less complicated source than Sgr B2(N-LMH) can partially mitigate this obstacle; however, the problem of coincident spectral features interfering with the detection of a new interstellar molecule still persists toward any chemically rich source.
The challenges in the identification of a new interstellar species have been reported by Snyder et al. (2005). The authors suggest ways to overcome these challenges by assigning a set of criteria that must be met before the identification of a new interstellar molecules is confirmed. These criteria can be summarized as follows: 1) The transition frequencies searched for must be accurate to within a few kHz. In addition, the most favorable transitions to search for are multiply degenerate (if possible), high line strength, and low energy. The criteria of high line strength and low energy depends on the molecule. 2) The LSR velocities between transitions must be consistent. 3) If possible, the transitions of a new molecular species must be separated by any interfering features by the Rayleigh criterion in order to claim that transition. 4) The relative intensities between transitions must be consistent with radiative transfer based on the physical conditions of the region. Finally 5), if possible, connecting transitions at higher and lower quantum numbers to the claimed transition should be detected. These criteria were applied to the claimed detections of glycine (Kuan et al. 2003) and dihydroxyacetone (Widicus Weaver & Blake 2005) and both of the claimed detections were rejected (Snyder et al. 2005 and Apponi et al. 2006, respectively). Conversely, the criteria were utilized to confirm the detection of glycolaldehyde (Halfen et al. 2006) toward Sgr B2(N-LMH) at the 99.8% confidence level. As demonstrated by Snyder et al. (2005) and Apponi et al. (2006), the detection of a large organic molecule based on even 10 to 20 transitions can be tenuous.
In 2005, an extensive survey was performed by Fuchs and colleagues to search for interstellar trans-ethyl methyl ether, C2H5OCH3, toward several high mass HMCs (Fuchs et al., 2005). This work was motivated by the previously reported observation of a single tEME transition towards Orion KL and W51 e1/e2 (Charnley et al. 2001). As a result of their survey, a detection of tEME was claimed toward the high mass star forming region W51 e2.
This would make tEME the fourth largest molecule to be detected in the interstellar medium (ISM). The three molecules larger than tEME, HC11N, C60, and C70, posses symmetry that greatly facilitates their detection. However, tEME lacks such symmetry. Determination of the tEME abundance therefore has important implications for the limits of chemical complexity and detection in the ISM. Additionally, tEME is believed to be produced by the same chemical reactions, summarized in Equation 1, that produce dimethyl ether, a molecule detected in numerous environments in the ISM 111R = CH3 for dimethyl ether formation and CH3CH2 for tEME. Therefore, tEME is the next logical progression in ether synthesis from dimethyl ether. If confirmed, the detection of tEME would represent a significant advance in our understanding of complex molecule formation.
| (1) | ||||
In this work, we attempted and failed to confirm the detection of tEME toward W51 e1/e2 using the 12 m Telescope of the Arizona Radio Observatory (ARO) in the 2 mm and 3 mm atmospheric windows, and further report on an extensive search for this species toward the high mass star forming region Sgr B2(N-LMH) with the GBT. We additionally reanalyzed the original detection in the context of the Snyder et al. (2005) criteria and show that the reported column density and temperature of Fuchs et al. (2005) are not reproducible based on their observations. Furthermore, no transitions of tEME were conclusively observed toward either W51 e1/e2 or Sgr B2(N-LMH) in the present ARO and GBT data. Our work therefore calls into question the initial detection of tEME toward W51 e1/e2.
2 Observations
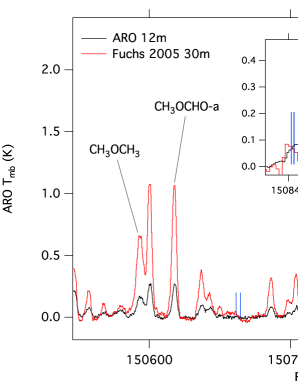
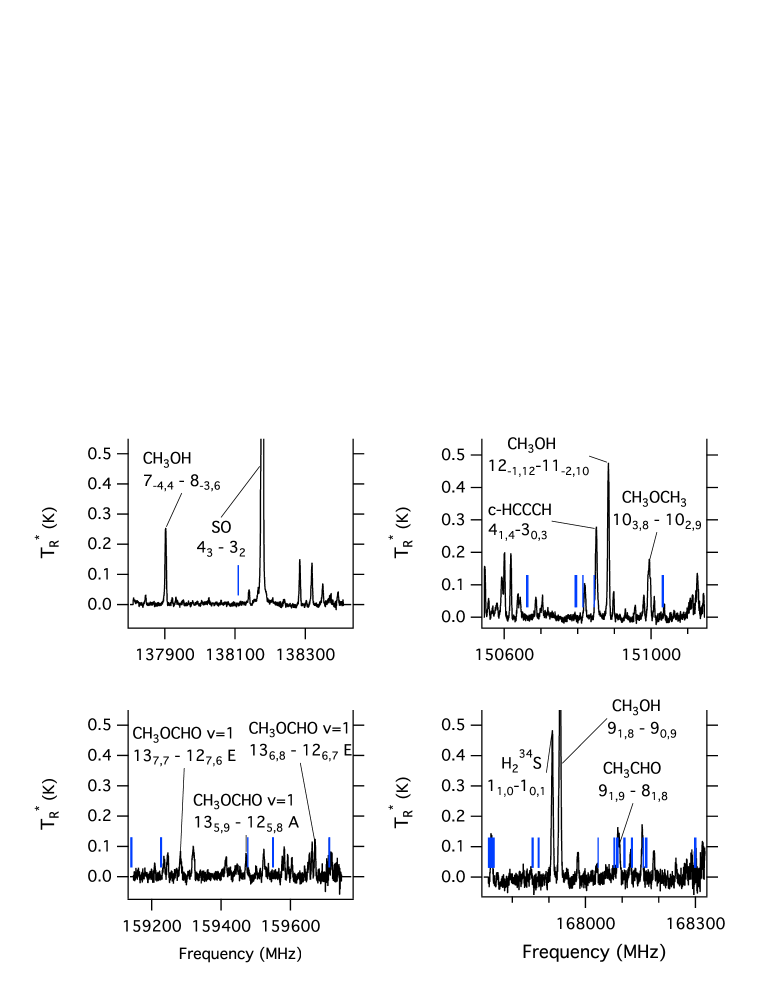
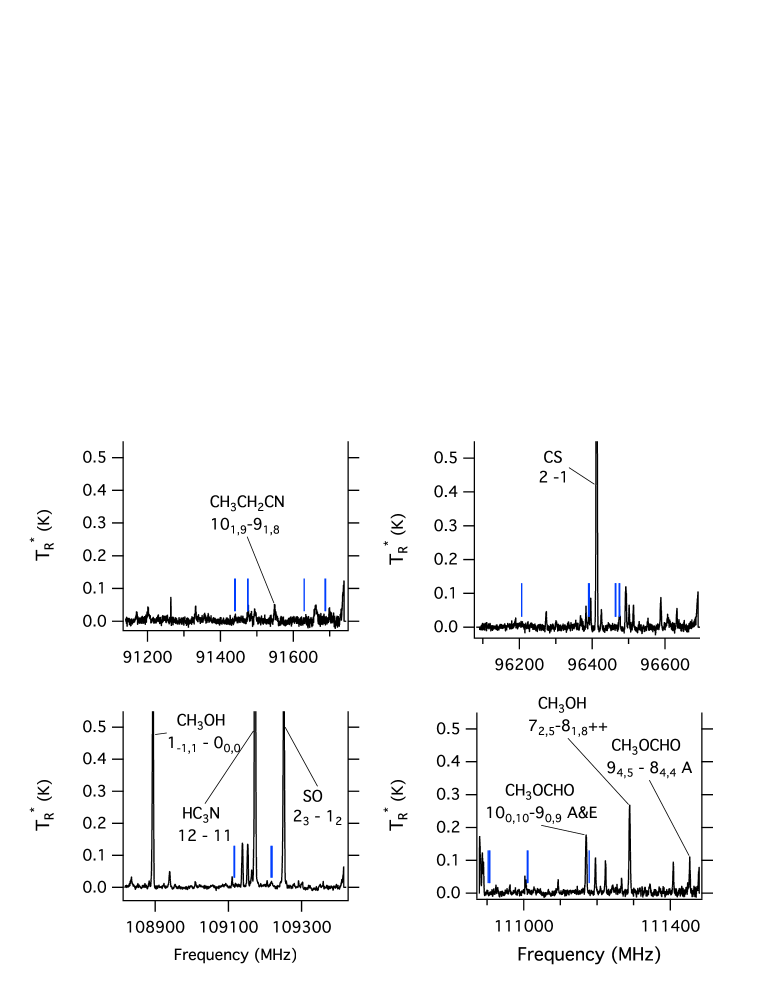
The observations using the ARO 12 m telescope, located on Kitt Peak, were conducted during the period of October 2006 to April 2007. The receivers used were dual-channel, cooled SIS mixers, operated in single-sideband mode with at least 20 dB of image rejection. The back ends used were (1) 256-channel filter banks with 500 kHz and 1 MHz resolution, and (2) a millimeter autocorrelator in the 390.5 kHz resolution mode. All spectrometers were configured in parallel mode to accommodate both receiver channels. The temperature scale, T , was determined by the chopper-wheel method, corrected for forward spillover losses. Conversion to radiation temperature TR is then TR = T/, where is the corrected beam efficiency. Twelve new transitions of tEME covering the range 91 GHz to 168 GHz were studied; over this frequency range, the beam size was 73 to 38 and the beam efficiency varied from 0.9 to 0.7. A comparison of the present observations and those from Fuchs et al. (2005) is given in Figure 1. A key concern is that the larger beam size of the ARO 12 m telescope may result in beam dilution of potential tEME flux. To assess this possibility, observational frequencies were chosen to partially overlap with those from Fuchs et al. (2005). From Figure 1, it is likely that both observations sample similar regions, however, the 12 m ARO beam weights more heavily to larger spatial scales than does the IRAM 30 m. The fact that the feature at 150845 MHz attributed by Fuchs et al. (2005) to the 200,20 - 191,19 transition of tEME is slightly stronger in the ARO data indicates a non-compact source size. The complete observations from the ARO 12 m are shown in Figure 2 and 3.
and = 0.75.
The observations of Sgr B2 (N) were taken using the National Radio Astronomy Observatory (NRAO) Robert C. Byrd 100 m Green Bank Telescope as part of the PRebiotic Interstellar MOlecular Survey (PRIMOS). Observations began in 2008, and are continually updated.222The PRIMOS data set is available at <http://www.cv.nrao.edu/~aremijan/PRIMOS/> These observations provide nearly continuous high-sensitivity, high-resolution data from 1 GHz to 50 GHz of the Sgr B2(N-LMH) region ([J2000] = 17h47m19.8s, [J2000] = -28∘2217). A complete description of the PRIMOS observations can be found in Neill et al. (2012). Two tEME transitions at 25.3 GHz and 30.5 GHz were fortuitously covered while searching for other molecules; the telescope beamwidths were 30 and 25, with corresponding beam efficiencies of 0.7 and 0.6, at those frequencies, respectively.
3 Results and Discussion
3.1 Analysis of Previous tEME Observations
Following the criteria of Snyder et al. (2005), we begin by attempting to verify the previously-reported detection of tEME toward W51 e2. We first consider the possibility that tEME is not well described by an LTE model. While experimental collisional cross-sections are not available, a rough collisional cross section based on molecular geometry and Van der Waals radii gives critical densities of order 103 - 104 cm-3. Reported densities toward W51 e2 are 103 - 107 cm-3 (Young et al., 1998; Shi et al., 2010), suggesting that tEME transitions should be well described by an LTE approximation. This is supported by the observation that emission from many large species toward W51 is well described by LTE (Kalenskii & Johansson, 2010). We therefore conclude that an LTE model is appropriate.
A simple first test is to compare the expected local thermodynamic equilibrium (LTE) antenna temperatures with the reported intensity of tEME transitions. From Remijan et al. (2005), the LTE antenna temperature is related to column density and temperature by Equation 2, where is the upper state energy of the transition (K), is the rotational partition function, is the transition frequency (MHz), is the line strength, is the dipole moment of the molecule (Debye), is the peak observed intensity (mK) times the full width half max (FWHM) of the line (km s-1), B is the beam dilution factor, is the source size, is the beam size, and is the beam efficiency of the telescope at . That is,
| (2) |
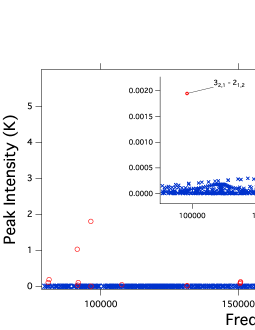
The transition strengths, frequencies, upper state energies, as well as the rotational partition function (Q = 2027.617 T3/2) and dipole moment ( = 0.146 D & = 1.165 D) are taken from Fuchs et al. (2003). While the assumed velocity width is not explicitly given, from Figure 4 of Fuchs et al. (2005) a FWHM of 1.4 MHz at 150.8 GHz, or 2.7 km s-1, may be inferred, in good agreement with previous observations toward W51 e2 (e.g. Remijan et al., 2002). Using the reported column density of 21014 cm-2 and a rotational temperature of 70 K from Fuchs et al. (2005), as well as a velocity width of 3 km s-1, = 1, a beam filling factor of B = 1, and background temperature of Tbg = 2.7 K, the peak intensity values are calculated in the Tmb scale using Equation 2 and plotted (blue crosses) against their corresponding observed values (red circles) from Fuchs et al. (2005) in Figure 4. The complete list of parameters used and calculated integrated intensities is given in Table 1.
It is immediately apparent the reported transitions from Fuchs et al. (2005) do not match their predicted values. Indeed, every reported transition should have a peak intensity at least an order of magnitude less than its reported value. As shown in Table 1, the discrepancy is 2 - 4 orders of magnitude for most transitions. In order to be considered valid, the observed intensity of all transitions should match their predicted values, in accordance with criteria 3 from Snyder et al. (2005). Accounting for the possibility that the five tEME spin components are blended into a single peak, the greatest peak intensity observed at the column density and temperature reported by Fuchs et al. (2005) would be the 200,20 – 191,19 transition with a peak intensity of 1.4 mK, well below the previously reported intensity of Fuchs et al. (2005) as well as the RMS of both the present and previous observations. Reexamining the data as a whole, we performed an iterative least-squares fit of the data used in Fit II of Fuchs et al. (2005) used to determine the reported column density. This yields a best fit column density of 61016 cm-2. We therefore conclude that the column density of 21014 cm-2 derived by Fuchs et al. (2005) is not valid.
A probable explanation for the reported transitions from Fuchs et al. (2005) is interference from coincident transitions of other species. W51 e1/e2 is a rich molecular source and from the present observations of W51 e1/e2, on average there is a transition with peak intensity 25 mK every 6.3 MHz and a transition with peak intensity 15 mK every 3.2 MHz. For transitions near the noise level, this means that there is a strong probability that there will be a coincident transition within twice the FWHM that may be falsely attributed to the new molecule. Fuchs et al. (2005) note that of their observed transitions, only two are free of any interfering transitions. This however is based only on comparison with previously detected species and does not account for the possibility of interference from previously unidentified transitions.
Examining the reported transition frequencies, the difference in the observed and laboratory frequencies varies from -2.0 MHz to 1.46 MHz with a root mean squared value of 926 kHz and a standard deviation of 896 kHz. As these values span a wide range of positive and negative velocity offsets, this cannot be attributed to a systematic difference in the velocity of a single carrier relative to the reported LSR velocity of W51 e2. The laboratory measurements from Fuchs et al. (2003) have uncertainties on the order of tens of kHz, thus this also cannot be attributed to uncertainty in the laboratory frequencies. A possible explanation is low spectral resolution. The previously reported astronomical observations have a resolution that varies from 0.3 MHz to 1.25 MHz. Many of the observed transitions have an observed minus calculated value at or below some or all of these spectral resolutions however, because the resolution of the individual spectra used to calculate these values is not specified, it is impossible to evaluate this possibility for many transitions. It can however be noted that four ( 21 %) of the transitions have an observed frequency that differs from its laboratory measurement by 1.25 MHz and are therefore likely not associated with tEME emission.
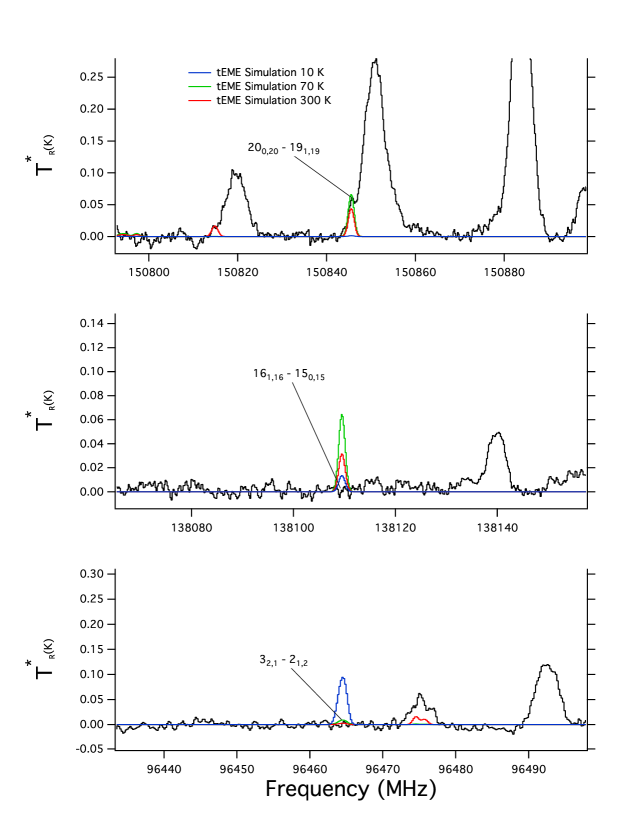
3.2 Analysis of ARO Observations
An alternative approach is to examine all tEME transitions covered by the present ARO observations. As a starting point, we assume a column density of 1.31016 cm-2 such that the emission at the 200,20 – 191,19 tEME transition is reproduced for an excitation temperature of 70 K. A simulation can be made of the resulting tEME line intensities, as shown in Figure 5. It is clear in this modeling that several transitions with predicted peak intensities well above the RMS of the observations are clearly absent. To satisfy criteria 4 of Snyder et al. (2005), there should be no absent transitions. In fact, an excitation temperature of 70 K cannot satisfy this criteria unless the column density is sufficiently low that all observed transitions have peak intensities below the RMS of the observations. Considering other excitation temperatures (10 K - 300 K) and column densities (11012 cm-2 - 11016 cm-2) does not improve the situation. It becomes apparent that, in order not to have “missing” lines, the tEME column density must be sufficiently low that all observed transitions are below the RMS of the observations from Fuchs et al. (2005) as well as the present observations, and thus not detectable in either observation.
An additional concern is the effect of beam dilution. Fuchs et al. assume a source size of 5. At 145 GHz, the ARO beam is 43, corresponding to a beam dilution factor 6.67 times higher than that of the IRAM 30 m at the same frequency. If this source size is correct, the present ARO observations would be up to a factor of 6.67 less sensitive. However, examining the only transition covered by both observatories, the 200,20 – 191,19 tEME transition and 150845 MHz (Figure 1), after comparing both ARO and IRAM 30 m observations in the Tmb scale, assuming a 5″source size, it is clear that the flux observed at this frequency does not decrease when observed with a larger beam, indicating that it cannot arise from a compact source. Therefore a beam dilution factor of 6.67 cannot apply. Furthermore, the column density from Fit II of Fuchs et al. (2005) would still produce transitions clearly visible in the ARO observations.
With no reliably identified tEME transitions, we determine an upper limit to the column density towards W51 e1/e2 using the current observations. As dimethyl ether and tEME are thought to form from similar processes, it is plausible to assume that they should have similar excitation conditions in a source. From Kalenskii & Johansson (2010), the derived rotational temperature of dimethyl ether towards W51 e1/e2 is 85 K. The strongest tEME transition in the current observations at 85 K that has no obvious interfering transitions is the 120,12 – 110,11 transition. This transition is not detected, but the RMS at this frequency can be used to determine an upper limit. Using Equation 2 and a velocity width of 3 km s-1, an upper limit of 11015 cm-2 can be derived for tEME, assuming all five components are blended into a single transition.
Finally we assess the possibility of detecting tEME in Sagittarius B2 (N-LMH). Using data from the PRIMOS project toward Sgr B2 (N-LMH), we have searched for possible tEME transitions. Several peaks coincident with tEME transitions were located, however several tEME transitions of similar predicted intensity show no emission, indicating that these features are simply coincidental. We therefore use the RMS at the strongest predicted transition to set an upper limit. Molecules detected toward Sgr B2 (N-LMH) show a wide range of excitation temperatures. No tEME transitions are detected, making it impossible to determine an excitation temperature. We therefore compute the upper limit at 10 K and 85 K. At 10 K, the strongest transition with no interfering features is the 41,3 – 40,4 transition, while at 85 K the strongest feature would be the 91,8 – 90,9 transition. The RMS at each transition frequency in the PRIMOS data is 4.5 mK and 11 mK, respectively. Using Equation 2 and assuming a beam efficiency of 0.8, the molecular parameters given in Table 1, and a velocity width of 13 km s-1, the upper limits for the column density of tEME towards Sgr B2 (N-LMH) are 2.1 1015 cm-2 and 1.7 1016 cm-2, respectively.
| Transition | Sij | Eu | NLines | Observed d bbObserved integrated intensities are taken from Fuchs et al. (2005) | Calculated dccComputed integrated intensities are for a single transition. The maximum observable integrated intensity can be obtained by d = dNLines | |
|---|---|---|---|---|---|---|
| (MHz) | (K) | K km s-1 | K km s103 | |||
| 112,10 – 111,11 | 80881.71 - 80883.6 | 5.195 | 30.1 | 5 | 0.09 | 0.3695 |
| 241,23 – 240,24 | 81198.23 - 81199.22 | 10.268 | 118.5 | 5 | 0.16 | 0.2073 |
| 353,32 – 352,33 | 91439.39 - 91441.26 | 27.608 | 255.2 | 5 | 1.0 | 0.0891 |
| 342,32 – 341,33 | 91630.26 - 91631.17 | 21.850 | 237.1 | 5 | 0.03 | 0.09149 |
| 373,34 – 372,35 | 91811.70 - 91813.40 | 29.637 | 283.7 | 5 | 0.1 | 0.06386 |
| 293,26 – 292,27 | 96390.20 - 96392.55 | 20.487 | 179.1 | 5 | 1.85 | 0.2067 |
| 32,1 – 21,2 | 96463.73 - 96464.85 | 1.545 - 1.639 | 6.9 | 5 | 0.002 | 0.1936ffComputed using the average value of Sij |
| 223,19 – 222,20 | 107655.40 - 107658.06 | 13.199 | 108.3 | 5 | 0.05 | 0.4089 |
| 72,5 – 61,6 | 131349.80 - 131351.62 | 2.306 | 15.4 | 5 | 0.02 | 0.3284 |
| 151,15 – 140,4 | 131372.62 - 131373.11 | 9.858 | 46.7 | 5 | 0.02 | 0.8986 |
| 344,30 – 343,31 | 150661.35 - 150664.55 | 20.064 | 248.7 | 5 | 0.12 | 0.1170 |
| 136,x – 145,ydd x-y deontes 7-9, 7-10, 8-9, or 8-10. | 150793.24 - 150797.40 | 1.289 | 76.6 | 10 | 0.17 | 0.088 |
| 200,20 – 191,19 | 150845.28 - 150845.58 | 14.283 | 80.4 | 5 | 0.20 | 0.9231 |
| 195,z – 194,15eez denotes either 14 or 15. | 215324.99 - 215327.56 | 3.487 - 9.519 | 102.2 | 6 | 0.28 | 0.6436ffComputed using the average value of Sij |
| 280,28 – 271,27 | 217940.65 - 217940.76 | 22.586 | 154.7 | 5 | 3.66 | 0.7299 |
| 163,14 – 152,13 | 245103.55 - 245106.43 | 4.994 | 62.9 | 5 | 0.46 | 0.6735 |
| 311,31 – 300,30 | 245274.09 - 245274.22 | 25.712 | 188.8 | 5 | 0.87 | 0.5748 |
| 173,15 – 162,14 | 252188.29 - 252191.14 | 5.191 | 69.5 | 5 | 0.70 | 0.6556 |
| 282,27 – 271,26 | 253307.71 - 253308.94 | 12.415 | 161.0 | 5 | 16.01 | 0.4264 |
| 41,3 – 40,4ggParameters used to derive upper limits for PRIMOS data | 25335.53 - 25336.17 | 4.386 | 5.1 | 5 | ||
| 91,8 – 90,9 | 30561.87 - 30562.54 | 8.335 | 18.2 | 5 |
4 Conclusions
Rigorous application of the criteria for detection of a new molecule as outlined in Snyder et al. (2005) has again been applied to a claimed detection. As in the case of dihydroxyacetone Apponi et al. (2006) and glycine Snyder et al. (2005), these criteria underline the need for a thorough analysis when evaluating the possible detection of new molecules. In the present case, analysis of the previously reported detection of tEME (Fuchs et al. 2005) calls into question the original detection. Both the LSR velocities and LTE intensities reported in Fuchs et al. (2005) are shown to be inconsistent with the reported column density and temperature, casting doubt on the claimed detection of tEME. Based on previous observations of W51 e1/e2, we instead derive an upper limit five times higher than the previously reported value. We also derive similar upper limits toward Sgr B2 (N-LMH).
P.B.C & G.A.B. gratefully acknowledge funding from the NASA Astrophysics Research and Analysis and Herschel Guaranteed Time Observer programs. B.A.M. gratefully acknowledges funding by an NSF Graduate Research Fellowship. The Arizona Radio Observatory is operated by Steward Observatory, University of Arizona, with partial support through the NSF University Radio Observatories program (URO: AST-1140030). The National Radio Astronomy Observatory is a facility of the National Science Foundation operated under cooperative agreement by Associated Universities, Inc.
References
- Apponi et al. (2006) Apponi, A. J., Halfen, D. T., Ziurys, L. M., et al. 2006, ApJ, 643, L29
- Belloche et al. (2008) Belloche, A., Menten, K. M., Comito, C., et al. 2008, A&A, 492, 769
- Carroll et al. (2010) Carroll, P. B., Drouin, B. J., & Widicus Weaver, S. L. 2010, ApJ, 723, 845
- Charnley et al. (2001) Charnley, S. B., Ehrenfreund, P., & Kuan, Y.-J. 2001, Spectrochimica Acta, 57, 685
- Crockett et al. (2014) Crockett, N. R., Bergin, E. A., Neill, J. L., et al. 2014, ApJ, 787, 112
- Fuchs et al. (2005) Fuchs, G. W., Fuchs, U., Giesen, T. F., & Wyrowski, F. 2005, A&A, 444, 521
- Fuchs et al. (2003) Fuchs, U., Winnewisser, G., Groner, P., De Lucia, F. C., & Herbst, E. 2003, ApJS, 144, 277
- Halfen et al. (2006) Halfen, D. T., Apponi, A. J., Woolf, N., Polt, R., & Ziurys, L. M. 2006, ApJ, 639, 237
- Hollis et al. (2004) Hollis, J. M., Jewell, P. R., Lovas, F. J., Remijan, A., & Møllendal, H. 2004, ApJ, 610, L21
- Hollis et al. (2002) Hollis, J. M., Lovas, F. J., Jewell, P. R., & Coudert, L. H. 2002, ApJ, 571, L59
- Kalenskii & Johansson (2010) Kalenskii, S. V., & Johansson, L. E. B. 2010, Astronomy Reports, 54, 1084
- Kuan et al. (2003) Kuan, Y.-J., Charnley, S. B., Huang, H.-C., Tseng, W.-L., & Kisiel, Z. 2003, ApJ, 593, 848
- Loomis et al. (2013) Loomis, R. A., Zaleski, D. P., Steber, A. L., et al. 2013, ApJ, 765, L9
- Neill et al. (2012) Neill, J. L., Muckle, M. T., Zaleski, D. P., et al. 2012, ApJ, 755, 153
- Remijan et al. (2002) Remijan, A., Snyder, L. E., Liu, S.-Y., Mehringer, D., & Kuan, Y.-J. 2002, ApJ, 576, 264
- Remijan et al. (2005) Remijan, A. J., Hollis, J. M., Lovas, F. J., Plusquellic, D. F., & Jewell, P. R. 2005, ApJ, 632, 333
- Shi et al. (2010) Shi, H., Zhao, J.-H., & Han, J. L. 2010, ApJ, 710, 843
- Snyder et al. (2005) Snyder, L. E., Lovas, F. J., Hollis, J. M., et al. 2005, ApJ, 619, 914
- Turner & Apponi (2001) Turner, B. E., & Apponi, A. J. 2001, ApJ, 561, L207
- Widicus Weaver & Blake (2005) Widicus Weaver, S. L., & Blake, G. A. 2005, ApJ, 624, L33
- Young et al. (1998) Young, L. M., Keto, E., & Ho, P. T. P. 1998, ApJ, 507, 270
- Zaleski et al. (2013) Zaleski, D. P., Seifert, N. A., Steber, A. L., et al. 2013, ApJ, 765, L10