Activation cross-sections of deuteron induced nuclear reactions on neodymium up to 50 MeV
Abstract
In the frame of a systematic study of activation cross sections of deuteron induced nuclear reactions on rare earths, the reactions on neodymium for production of therapeutic radionuclides were measured for the first time. The excitation functions of the natNd(d,x) 151,150,149,148m,148g,146,144,143Pm, 149,147,139mNd, 142Pr and 139gCe nuclear reactions were assessed by using the stacked foil activation technique and high resolution -spectrometry. The experimental excitation functions were compared to the theoretical predictions calculated with the modified model codes ALICE-IPPE-D and EMPIRE-II-D and with the data in the TENDL-2012 library based on latest version of the TALYS code. The application of the data in the field of medical isotope production and nuclear reaction theory is discussed.
keywords:
Nd target, deuteron activation, Pm, Nd and Ce radioisotopes, yield curves1 Introduction
Activation cross-sections data of deuteron induced nuclear reactions on neodymium are important for development of nuclear reaction theory and for different practical applications. This study was performed in the frame of the following ongoing research goals:
-
1.
To check the predictive power and benchmarking of the different model codes of the nuclear reaction theory. To contribute to the improvement of models for description of deuteron induced reactions and to selection of more appropriate input parameters.
-
2.
To investigate the alternative production possibilities of standard and emerging therapeutic and diagnostic lanthanide radionuclides via charged particle induced reactions. In a search for new nuclides suitable for therapeutic purposes [1, 2, 3, 4, 5, 6, 7, 8] the radionuclide 149Pm (T1/2 = 53.1 h), 141Nd (T1/2) and 140Nd (T1/2 = 3.37 d), were found to offer some unique properties suitable for therapy and the daughter nuclide 140Pr (T1/2 = 3.4 min) brings the additional advantage of in-vivo localization via positron emission tomography (PET).
-
3.
To contribute to the extension of the database by a systematic study of activation cross-sections of deuteron induced nuclear reactions for biological and industrial applications (accelerator technology, thin layer activation, activation in space technology, etc.).
Here we present our results on activation cross-sections on deuteron induced nuclear reactions on neodymium. No earlier experimental data on natNd were found in the literature. Only one earlier set of experimental cross-section data was found on highly enriched 148Nd for investigation the isomeric ratios of the (d,2n) reactions [9]. Thick target yield data for production of 143,144,148Pm at 22 MeV were reported by Dmitriev et al. at 22 MeV [10].
2 Experiment and data evaluation
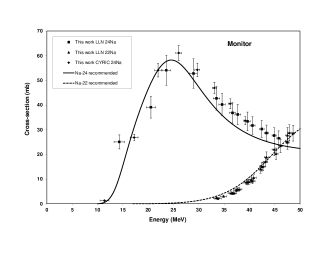
For measurements, the well-known activation method, stacked foil irradiation technique and high resolution -spectrometry was used. Nd metal foils and NdO pellet targets, interleaved with Al foils for monitoring of beam characteristics, were stacked and irradiated at CYRIC (Sendai) and UCL (LLN) cyclotrons. Complete excitation function was measured for the monitor reactions to control the beam intensity and the energy. The main experimental parameters, methods of data evaluation are collected in Table 1 and Table 2. The comparison of the re-measured monitor reactions and the recommended data are shown in Fig. 1. The decay characteristics of the investigated reaction products and the possibly contributing reactions in the energy region studied are summarized in Table 3.
| Incident particle | Deuteron | Deuteron |
|---|---|---|
| Method | Stacked foil | Stacked foil |
| Target composition |
natNd (100 m)-target
natYb (22.88 m)-target Al (49.06 m)-monitor (repeated 11 times) Interleaved with Al (156.6 m, 103.43 m, 49.06 m)-energy degraders |
74.7-93.7 m Nd2O3 target
pressed into 360 m thick Al backing covered by 10 m Al foil |
| Number of Nd target foils | 11 | 8 |
| Accelerator | Cyclone 110 cyclotron of the Université Catholique in Louvain la Neuve (LLN) Belgium |
AVF-930 cyclotron of the Cyclotron and Radioisotope Center (CYRIC) of Tohoku University in Sendai,
Japan |
| Primary energy | 50 MeV | 40 MeV |
| Covered energy range | 49.4-21.5 MeV | 39.4-9.7 MeV |
| Irradiation time | 60 min | 20 min |
| Beam current | 92 nA | 45 nA |
| Monitor reaction, [recommended values] | 27Al(d,x)24Na reaction [11] (re-measured over the whole energy range) |
27Al(d,x)24Na reaction
(re-measured over the whole energy range) |
| Monitor target and thickness | natAl, 49.06 mm | natAl, 370 mm target holders |
| detector | HPGe | HPGe |
| Chemical separation | no | no |
| g-spectra measurements | 4 series | 3 series |
|
Typical cooling times
(and target-detector distances) |
3 h (35 cm)
34 h (10 cm) 47 h (20 cm) 272 (5cm) |
19 h (10 cm)
90 h (10 cm) 600 h (10 cm) |
| Gamma spectra evaluation | Genie 2000, Forgamma | [11, 12] |
|---|---|---|
| Determination of beam intensity |
Faraday cup (preliminary)
Fitted monitor reaction (final) |
[13] |
| Decay data (see Table 2) | NUDAT 2.6 | [14] |
| Reaction Q-values (see Table 3) | Q-value calculator | [15] |
| Determination of beam energy |
Andersen (preliminary)
Fitted monitor reaction (final) |
[16]
[14] |
| Uncertainty of energy |
Cumulative effects of possible uncertainties
(primary energy, target thickness, energy straggling, correction to monitor reaction) |
|
| Cross-sections | Isotopic and elemental cross-sections | |
| Uncertainty of cross-sections |
sum in quadrature of all individual contributions
(beam current (7%), beam-loss corrections (max. of 1.5%), target thickness (1%), detector efficiency (5%), photo peak area determination counting statistics (1-20 %) |
[17] |
| Yield | Physical yield | [18] |
3 Comparison with the results of the model codes
The cross-sections of the investigated reactions were calculated using the modified model codes ALICE-IPPE [20] and EMPIRE-II [19]. In the used modified ALICE-IPPE-D and EMPIRE-D code versions the direct (d,p) channel is increased strongly [20, 21]. The experimental data are also compared with the cross-section data reported in the TALYS based [22] TENDL-2012 Data Libraries [23].
4 Results
4.1 Cross-sections
The cross-sections for all the reactions investigated are shown in Figs. 2–15 and the numerical values are collected in Table 4-5. The results of the two irradiations on different targets are given separately allowing to judge on the agreement in the overlapping energy range. We should mention, as is reflected in the figures that the experimental results of this investigations have larger uncertainties and the data are more scattered, than in most of our previous investigations. Taking into accounts that the scattering shows a systematic behavior between the two experiments, it could be connected to the target thicknesses. In the LLN experiment a large metal foil was used and the average thickness was derived from measurements of the surface of the whole foil and its weight. The final targets were obtained by cutting pieces of the required dimensions from the large foil. Due to the well-known oxidation problems the thickness of each individual target piece were not re-measured but supposed to be equal to the average. In the Sendai experiment the Nd2O3 targets were made by pressing neodymium oxide in a precisely machined Al cup. The average thickness of each individual targets was derived on the basis the measured oxide weight (total weight minus weight of Al-cup) and known surface, but the uniformity of the targets was only roughly checked. For both experiments the beam diameter was significantly lower than the diameter of the targets and hence possible local changes in thickness can result in large scattering of cross-section data.
|
Nuclide
Decay path |
Half-life | Eγ(keV) | Iγ(%) | Contributing reaction |
Q-value
(keV) |
|
151Pm
-: 100 % |
28.40 h |
240.09
340.08 445.68 |
3.8
22.5 4.0 |
150Nd(d,n) | 4770.71 |
|
150Pm
-: 100% |
2.68 h |
333.92
406.51 831.85 876.41 1165.77 1324.51 |
68
5.6 11.9 7.3 15.8 17.5 |
150Nd(d,2n) | -3089.5 |
|
149Pm
b-: 100% |
53.08 h | 285.95 | 3.1 |
148Nd(d,n)
150Nd(d,3n) |
3720.27
-8693.63 |
|
148mPm
IT: 4.2 % -: 95.8 % |
41.29 d |
432.745
550.284 629.987 725.673 915.331 1013.808 |
5.33
94.5 89 32.7 17.10 20.20 |
148Nd(d,2n)
150Nd(d,4n) |
-3549.66
-15963.56 |
|
148gPm
-: 100 % |
5.368 d |
550.27
914.85 1465.12 |
22.0
11.5 22.2 |
148Nd(d,2n)
150Nd(d,4n) |
-3549.66
-15963.56 |
|
146Pm
: 66.0 % |
5.53 a |
453.88
735.93 |
65.0
22.5 |
145Nd(d,n)
146Nd(d,2n) 148Nd(d,4n) 150Nd(d,6n) |
3086.77
-4478.47 -17103.16 -29517.07 |
|
144Pm
: 100 % |
363 d |
476.78
618.01 696.49 |
43.8
98 99.49 |
143Nd(d,n)
144Nd(d,2n) 145Nd(d,3n) 146Nd(d,4n) 148Nd(d,6n) 150Nd(d,8n) |
2478.19
-5338.84 -11094.15 -18659.38 -31284.08 -43697.98 |
|
143Pm
: 100 % |
265 d | 741.98 | 38.5 |
142Nd(d,n)
143Nd(d,2n) 144Nd(d,3n) 145Nd(d,4n) 146Nd(d,5n) 148Nd(d,7n) 150Nd(d,9n) |
2074.99
-4048.59 -11865.62 -17620.92 -36201.1 -37810.85 -50224.76 |
|
149Nd
-: 100 % |
1.728 h |
114.314
211.309 270.166 326.554 423.553 540.509 654.831 |
19.2
25.9 10.7 4.56 7.4 6.6 8.0 |
148Nd(d,p)
150Nd(d,p2n) 149Pr decay |
2814.224
-9599.69 -12153.2 |
|
147Nd
-: 100 % |
10.98 d |
91.105
319.411 531.016 |
28.1
2.127 13.37 |
146Nd(d,p)
148Nd(d,p2n) 150Nd(d,p4n) 147Pr decay |
3067.6343
-9557.07 -21970.98 4404.4 |
|
141Nd
: 100 % |
2.49 h |
145.45
1126.91 1147.30 1292.64 |
0.24
0.80 0.307 0.46 |
142Nd(d,p2n)
143Nd(d,p3n) 144Nd(d,p4n) 145Nd(d,p5n) 146Nd(d,p6n) 148Nd(d,p8n) 150Nd(d,p10n) 141Pm decay |
-12052.37
-18175.95 -25992.98 -31748.28 -39313.52 -51938.22 -65222.22 -16505.2 |
|
139mNd
: 88.2% IT: 11.8% |
5.50 h |
113.87
708.1 738.2 827.8 982.2 |
40
26 35 10.3 26 |
142Nd(d,p4n)
143Nd(d,p5n) 144Nd(d,p6n) 145Nd(d,p7n) 146Nd(d,p8n) 139Pm decay |
-30373.8
-36497.3 -44314.4 -50069.7 -57634.9 -35670.2 |
|
142Pr
: 0.0164% -: 99.9836% |
19.12 h | 1575.6 | 3.7 |
142Nd(d,2p)
143Nd(d,2pn) 144Nd(d,2p2n) 145Nd(d,2p3n) 146Nd(d,2p4n) 148Nd(d,2p6n) 150Nd(d,2p8n) |
-3603.85
-9727.43 -17544.46 -23299.77 -30865.0 -43489.7 -55903.59 |
|
139Ce
e: 100% |
137.641 d | 165.8575 | 80 |
142Nd(d,3p2n)
143Nd(d,3p3n) 144Nd(d,3p4n) 145Nd(d,3p5n) 146Nd(d,3p6n) 148Nd(d,3p8n) 139Pr decay |
-23873.51
-29997.09 -37814.12 -43569.42 -51134.66 -63759.34 1510.73 |
When complex particles are emitted instead of individual protons and neutrons the Q-values have to be decreased by the respective binding energies of the compound particles: np-d, +2.2 MeV; 2np-t, +8.48 MeV
natNd isotopic abundance: 142Nd (27.13 %), 143Nd (12.18 %), 144Nd (23.80 %),145Nd (5.30 %), 146Nd (17.19 %), 148Nd (5.76 %), 150Nd (5.64 %)
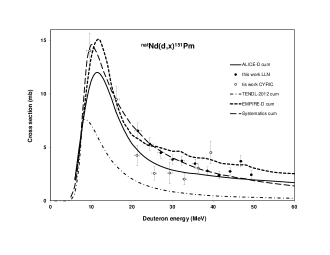
4.1.1 Production cross-sections of 151Pm (cum)
The 151Pm (T1/2=28.40 h) is produced directly via 150Nd(d,n) reaction and from the decay of short-lived 151Nd (T1/2 = 12.44 min) obtained in a 150Nd(d,p) reaction. Due to the experimental circumstances we could only measure the cumulative production after the complete decay of the short-lived parent. As it is shown in Fig. 2 the experimental data are in acceptable agreement with the results of ALICE-D and EMPIRE-D, but in case of TENDL-2012 the underestimation is very significant.
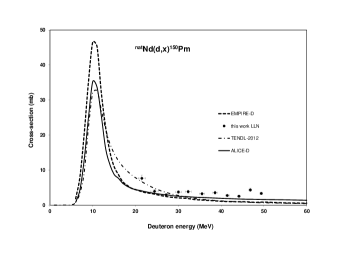
4.1.2 Production cross-sections of 150Pm
For 150Pm (T1/2 = 2.68 h) we have experimental data only from the 50 MeV irradiation due to the long cooling time (19 h) of the first series of measurement in the 40 MeV experiment. The 150Pm can only be produced via the 150Nd(d,2n) reaction. The measured data and the theoretical model calculations are shown in Fig. 3. The agreement between the experimental and theoretical results is acceptable.
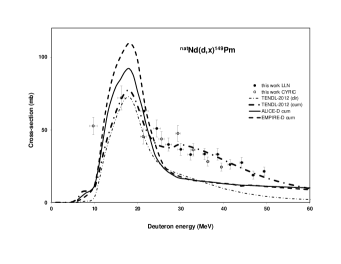
4.1.3 Production cross-sections of 149Pm
The experimental and theoretical excitation functions of 149Pm (T1/2 = 53.08 h) are shown in Fig. 4. Two reactions are contributing on stable Nd isotopes with approximately the same natural abundance (148Nd(d,n) and 150Nd(d,3n)). The maximum around 20 MeV (seen in the experiment and confirmed by the theoretical predictions) indicates that the cross-sections for the (d,3n) reaction are significantly higher than those for (d,n).
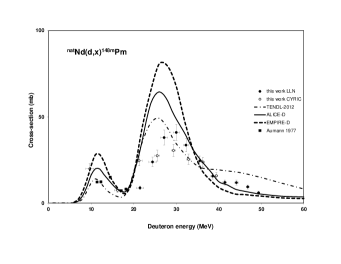
4.1.4 Production cross-sections of 148mPm
The measured excitation functions came in all cases from a combination of (d,xn) reactions on the 185Re and 187Re. The level schemes for 182Re and 184Re are estimated with large uncertainties for some important -transitions. So, an accuracy of calculations for the corresponding isomer yields cannot be very high.
The 148Pm has two long-lived isomeric states. The 148mPm (T1/2 = 41.29 d) higher laying state shows only for a small part isomeric decay (IT: 4.2 %) and emits strong, independent -lines allowing separate identification. The agreement of our 2 data points below 18 MeV with the data of [9] is reasonable. The theoretical data overestimate the experimental values (Fig. 5). The maxima of the two contributing reactions ((d,2n) and (d,4n)) are well pronounced in the figure, especially for the model calculations.
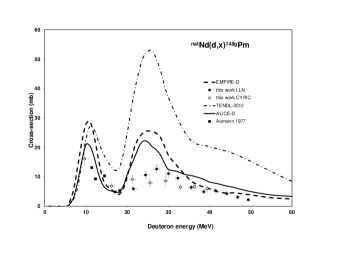
4.1.5 Production cross-sections of 148gPm
The cross-sections for the direct production of the 148gPm (T1/2 = 5.368 d) (after correction for the small contribution of the 148mPm decay) are shown in Fig. 6 in comparison with the earlier experimental data and the theoretical predictions. The overestimation by the theory for production of the ground state is significant. Our experimental results below 18 MeV for production of the ground and metastable state are not detailed enough to allow any calculation of isomeric ratio and comparison with [9].
4.1.6 Production cross sections of 147Pm
Due to the long half-life (T1/2 = 2.62 a) and the very low abundance of its unique -line this industrially important radionuclide could not be detected, neither as directly produced nor as decay product of its parent 147Nd.
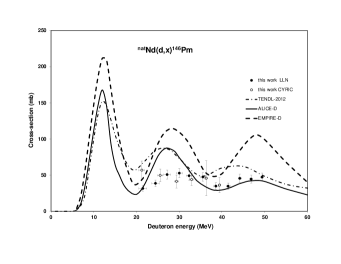
4.1.7 Production cross-sections of 146Pm
The comparison of the experimental and the theoretical data of the 146Pm (T1/2 = 5.53 a) shows significant overestimation of the experiment by the used models that however clearly show the contributions of different stable target isotopes (Fig. 7).
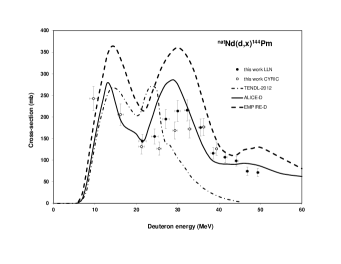
4.1.8 Production cross-sections of 144Pm
The 144Pm (T1/2 = 363 d) is produced by (d,xn) reactions on 143-150Nd isotopes of natNd. The shape of the excitation function predicted in TENDL-2012 differs significantly from the predictions of the ALICE-D and EMPIRE-D and from the experiment, especially at the high energy range (Fig. 8).
4.1.9 Production cross-sections of 143Pm
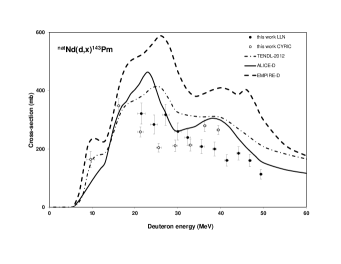
The (d,xn) reactions on all stable isotopes of natNd participate in the production of the 143Pm ( T1/2 = 265 d). The comparison of the experiment and the theory shows a similar picture as for previous cases: the experimental data are overestimated by the theory and are not distinguishing well the different contributing reactions (Fig. 9).
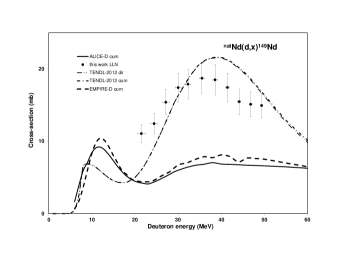
4.1.10 Production cross-sections of 149Nd(cum)
Due to the long cooling time for the 40 MeV experiment (around 19 h) we could not measure the cross-sections for production of 149Nd (T1/2 = 1.728 h) in this experiment. The measured cross-sections for the 50 MeV experiment (Fig. 10) represent cumulative production of 149Nd directly by (d,pxn) and from the complete -decay of the short-lived 149Pr (T1/2 = 2.26 min). The two maxima seen on the theoretical excitation functions correspond to the 148Nd(d,p) and 150Nd(d,p2n) reactions. The contribution from the decay of 149Pr is negligible, according to the TENDL-2012 results and is only visible at energies above 50 MeV. There are large disagreements in the theoretical predictions. The predictions of the (d,p) part are more reliable in case of ALICE-D and EMPIRE-D, but the (d,p2n) energy range is strongly underestimated by these codes. In the measured energy region the TENDL-2012 results are more close to the experiment.
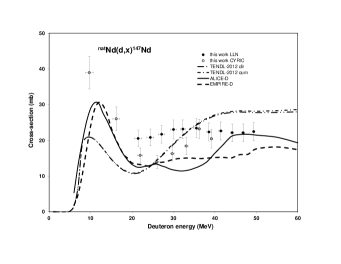
4.1.11 Production cross-sections of 147Nd(cum)
The production cross-sections of 147Nd (T1/2 = 10.98 d) were deduced from spectra taken after complete decay of short-lived parent 147Pr (T1/2 = 13.4 min) and hence represent cumulative production (direct + decay from parent). The first maximum (Fig. 11) represents the (d,p) contribution on 146Nd, where the description of the ALICE-D and EMPIRE-D is better. It is difficult to compare the experimental data with the theory in the higher energy range.
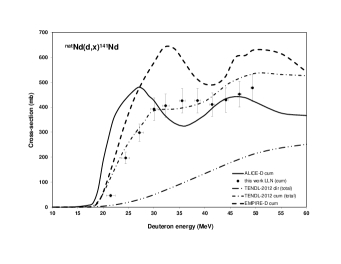
4.1.12 Production cross-sections of 141Nd(cum)
The short-lived isomeric state (T1/2 = 62.0 s) of 141Nd is decaying with IT (100 %) to the ground state (T1/2 = 2.49 h). The ground state of 141Nd is also fed by EC + -decay of 141Pm (20.90 min) and is produced directly by (d,pxn) reactions on all stable Nd isotopes. The measured cross-sections for the production of the ground state are cumulative, including all above mentioned contributions (Fig. 12). According to the Fig. 12 there are very large disagreements between the predictions of the different theoretical codes and the experimental data.
4.1.13 Production cross-sections of 139mNd
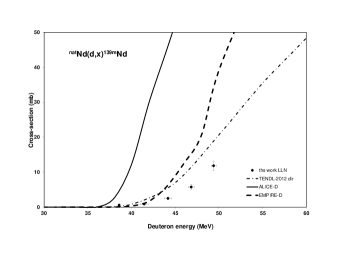
The 139Nd has two long-lived isomeric states, the (, T1/2 = 29.7 min) ground state and the longer-lived high spin metastable state (, T1/2 = 5.50 h). We obtained cross-sections for production of the high spin state that is produced only directly via (d,pxn) reactions. The 139Pm (, T1/2 = 4.15 min) decays only to the ground state of 139Nd. Our experimental data (Fig. 13) are closer to the TALYS predictions in the TENDL-2012 than to the ALICE-D and EMPIRE-D results.
4.1.14 Production cross-sections of 142Pr
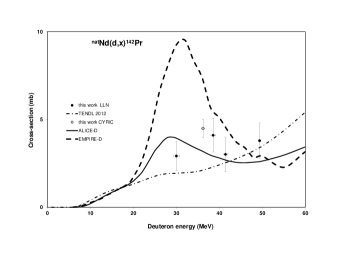
We could deduce a few experimental cross-section data for production of the 142Pr (T1/2 = 19.12 h) radioisotope, only obtained directly via (d,2pxn) reactions. The comparison with the theoretical predictions is shown in Fig. 14.
4.1.15 Production cross-sections of 139gCe(cum)
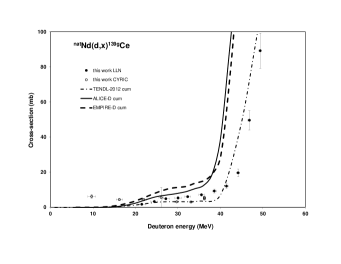
The direct production cross-sections of the long-lived 139Ce (T1/2 = 137.641 d) via (d,3pxn) reactions are very small. The main contributions to the measured cumulative cross-sections arise from the shorter-lived 139Pm-139Nd-139Pr decay chain. Among the used theoretical results the TENDL-2012 data agree rather well with the experimental cumulative excitation function (see Fig. 15).
4.2 Integral yields
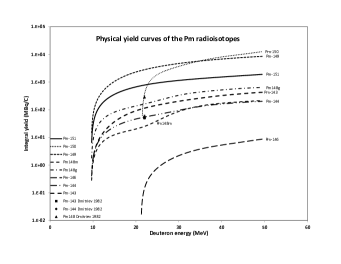
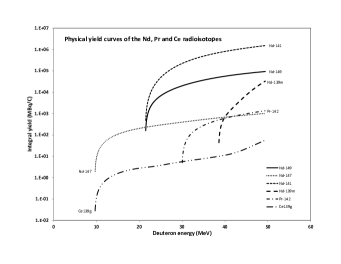
The integral yields (integrated yield for a given incident energy down to the reaction threshold), calculated from fitted curves to our experimental cross-section data, are shown in Fig. 16-17 in comparison with experimental thick target yields found in the literature. The results are representing so called physical yields (obtained in an instantaneous irradiation time for an incident number of particles having charge equivalent to 1 Coulomb)[18]. Fig. 16 also contains the data from Dmitriev [10] measured at 22 MeV, where the result for 144Pm is in excellent agreement with our measurement, while his results for 143Pm and 148Pm are above and below our curves respectively.
5 Summary and conclusion
Activation cross-sections of proton induced nuclear reactions on neodymium were measured for the natNd(d,x) 151,150,149,148m,148g,146,144,143Pm, 149,147,139mNd, 142Pr and 139gCe nuclear reactions. All investigated reactions are presented here for the first time, except the data of [9] for the 148Nd(d,2n) reaction. Model calculations were done by using the EMPIRE-D and AICE-IPPE-D codes. The data were also compared with the data of the TALYS based TENDL-2012 online library. The predictions of theoretical calculations are only moderately successful. The obtained experimental data provide a basis for upgrading the model codes and input parameters. As it was mentioned the data can be used for selection and optimization of production routes for the medically relevant radioisotopes 149Pm (T1/2 = 53.1 h), 141Nd (2.49 h) and 140Nd (T1/2=3.37 d).
| Energy
(MeV) |
151Pm
(mb) |
150Pm
(mb) |
149Pm
(mb) |
148mPm
(mb) |
148gPm
(mb) |
146Pm
(mb) |
144Pm
(mb) |
143Pm
(mb) |
||||||||||||||||||
| Sendai, 40 MeV | ||||||||||||||||||||||||||
| 39.4 | 0.3 | 4.5 | 1.1 | 24.4 | 2.7 | 15.8 | 1.9 | 5.9 | 0.8 | 36.2 | 10.4 | 126 | 15 | 265 | 32 | |||||||||||
| 36.3 | 0.4 | 3.1 | 0.4 | 28.2 | 3.2 | 23.7 | 2.7 | 6.7 | 0.8 | 45.7 | 24.2 | 177 | 20 | 279 | 32 | |||||||||||
| 32.9 | 0.4 | 2.0 | 0.5 | 36.3 | 4.2 | 25.3 | 3.0 | 6.5 | 1.0 | 43.9 | 8.3 | 172 | 21 | 213 | 27 | |||||||||||
| 29.4 | 0.5 | 2.6 | 1.0 | 47.5 | 5.4 | 30.5 | 3.5 | 8.6 | 1.7 | 41.4 | 9.0 | 169 | 20 | 211 | 25 | |||||||||||
| 25.5 | 0.6 | 2.6 | 0.6 | 43.7 | 5.0 | 27.4 | 3.2 | 8.0 | 1.1 | 49.7 | 8.8 | 126 | 15 | 204 | 25 | |||||||||||
| 21.3 | 0.7 | 4.2 | 1.0 | 45.4 | 5.2 | 24.5 | 2.9 | 9.1 | 1.2 | 56.9 | 12.7 | 131 | 17 | 258 | 31 | |||||||||||
| 9.7 | 1.0 | 14.0 | 1.6 | 52.7 | 6.0 | 19.8 | 2.9 | 16.1 | 2.0 | 242 | 28 | 164 | 20 | |||||||||||||
| 16.2 | 0.8 | 9.5 | 1.2 | 72.0 | 8.2 | 7.4 | 1.4 | 6.9 | 1.1 | 205 | 25 | 348 | 42 | |||||||||||||
| Louvain la Neuve, 50 MeV | ||||||||||||||||||||||||||
| 49.4 | 0.3 | 2.4 | 0.4 | 3.3 | 0.4 | 21.4 | 2.8 | 5.9 | 0.9 | 2.2 | 0.5 | 47.2 | 5.8 | 71 | 9 | 113 | 16 | |||||||||
| 46.8 | 0.4 | 3.7 | 0.5 | 4.3 | 0.5 | 18.8 | 2.8 | 9.3 | 1.2 | 3.0 | 0.6 | 44.5 | 5.5 | 74 | 9 | 160 | 21 | |||||||||
| 44.2 | 0.4 | 2.7 | 0.3 | 2.5 | 0.3 | 27.4 | 3.6 | 11.8 | 1.4 | 4.3 | 0.7 | 45.5 | 5.6 | 98 | 12 | 185 | 23 | |||||||||
| 41.4 | 0.5 | 2.4 | 0.3 | 2.7 | 0.3 | 26.1 | 3.3 | 12.0 | 1.4 | 5.3 | 0.8 | 34.7 | 4.5 | 107 | 13 | 160 | 20 | |||||||||
| 38.6 | 0.5 | 2.8 | 0.4 | 3.5 | 0.4 | 33.1 | 4.0 | 15.6 | 1.8 | 4.9 | 0.7 | 34.8 | 4.6 | 116 | 14 | 199 | 24 | |||||||||
| 35.5 | 0.6 | 3.5 | 0.4 | 3.2 | 0.4 | 33.4 | 3.9 | 24.4 | 2.8 | 6.4 | 0.8 | 47.4 | 5.9 | 176 | 20 | 208 | 24 | |||||||||
| 32.3 | 0.7 | 3.7 | 0.4 | 3.8 | 0.4 | 33.0 | 3.8 | 33.6 | 3.8 | 9.5 | 1.1 | 49.1 | 6.0 | 215 | 24 | 239 | 27 | |||||||||
| 30.0 | 0.7 | 3.9 | 0.4 | 3.7 | 0.4 | 36.6 | 4.2 | 40.9 | 4.6 | 11.1 | 1.3 | 52.7 | 6.3 | 214 | 24 | 260 | 30 | |||||||||
| 27.2 | 0.8 | 4.5 | 0.5 | 2.9 | 0.3 | 39.9 | 4.6 | 37.9 | 4.3 | 12.6 | 1.5 | 50.7 | 6.1 | 195 | 22 | 317 | 36 | |||||||||
| 24.4 | 0.8 | 5.3 | 0.6 | 3.9 | 0.4 | 50.9 | 5.8 | 23.8 | 2.7 | 10.6 | 1.2 | 38.6 | 4.4 | 155 | 18 | 284 | 32 | |||||||||
| 21.5 | 0.9 | 6.5 | 0.7 | 7.6 | 0.9 | 62.9 | 7.1 | 8.8 | 1.0 | 5.9 | 0.7 | 31.6 | 3.8 | 144 | 16 | 321 | 36 | |||||||||
| Energy
(MeV) |
149Nd
(mb) |
147Nd
(mb) |
141Nd
(mb) |
139mNd
(mb) |
142Pr
(mb) |
139gCe
(mb) |
||||||||||||||
| Sendai, 40 MeV | ||||||||||||||||||||
| 39.4 | 0.3 | 20.5 | 2.6 | 5.6 | 0.8 | |||||||||||||||
| 36.3 | 0.4 | 23.2 | 2.6 | 4.9 | 0.8 | |||||||||||||||
| 32.9 | 0.4 | 18.4 | 2.4 | 3.1 | 0.5 | |||||||||||||||
| 29.4 | 0.5 | 16.3 | 2.1 | 3.2 | 0.4 | |||||||||||||||
| 25.5 | 0.6 | 14.0 | 1.8 | 5.7 | 5.7 | |||||||||||||||
| 21.3 | 0.7 | 15.8 | 2.1 | 4.3 | 0.5 | |||||||||||||||
| 9.7 | 1.0 | 39.0 | 4.6 | 6.2 | 1.2 | |||||||||||||||
| 16.2 | 0.8 | 26.1 | 3.4 | 4.4 | 0.6 | |||||||||||||||
| Louvain la Neuve, 50 MeV | ||||||||||||||||||||
| 49.4 | 0.3 | 15.0 | 1.7 | 22.5 | 2.5 | 478 | 55 | 11.82 | 1.35 | 3.79 | 1.00 | 89.2 | 10.0 | |||||||
| 46.8 | 0.4 | 15.1 | 1.7 | 22.1 | 2.5 | 452 | 52 | 5.76 | 0.65 | 49.6 | 5.6 | |||||||||
| 44.2 | 0.4 | 15.5 | 1.7 | 22.2 | 2.5 | 429 | 49 | 2.50 | 0.31 | 19.7 | 2.2 | |||||||||
| 41.4 | 0.5 | 17.4 | 2.0 | 22.7 | 2.6 | 411 | 47 | 0.89 | 0.14 | 3.01 | 0.98 | 12.1 | 1.4 | |||||||
| 38.6 | 0.5 | 18.5 | 2.1 | 22.4 | 2.5 | 427 | 49 | 0.59 | 0.10 | 4.10 | 0.96 | 9.3 | 1.1 | |||||||
| 35.5 | 0.6 | 18.7 | 2.1 | 23.4 | 2.6 | 426 | 49 | 7.1 | 0.8 | |||||||||||
| 32.3 | 0.7 | 17.9 | 2.0 | 23.2 | 2.6 | 406 | 47 | 6.1 | 0.7 | |||||||||||
| 30.0 | 0.7 | 17.4 | 2.0 | 23.1 | 2.6 | 393 | 45 | 2.92 | 0.83 | 5.4 | 0.6 | |||||||||
| 27.2 | 0.8 | 15.4 | 1.7 | 21.7 | 2.4 | 298 | 35 | 4.9 | 0.6 | |||||||||||
| 24.4 | 0.8 | 12.4 | 1.4 | 20.8 | 2.3 | 197 | 23 | 3.3 | 0.4 | |||||||||||
| 21.5 | 0.9 | 11.1 | 1.2 | 20.5 | 2.3 | 46 | 6 | 1.7 | 0.2 | |||||||||||
6 Acknowledgements
This work was done in the frame MTA-FWO research project and ATOMKI-CYRIC collaboration. The authors acknowledge the support of research projects and of their respective institutions in providing the materials and the facilities for this work.
References
- [1] G. Stocklin, S. M. Qaim, F. Rosch, The impact of radioactivity on medicine, Radiochimica Acta 70-1 (1995) 249–272.
- [2] S. M. Qaim, Therapeutic radionuclides and nuclear data, Radiochimica Acta 89 (4-5) (2001) 297–302.
- [3] M. Neves, A. Kling, A. Oliveira, Radionuclides used for therapy and suggestion for new candidates, Journal of Radioanalytical and Nuclear Chemistry 266 (3) (2005) 377–384.
- [4] H. Uusijarvi, P. Bernhardt, T. Ericsson, E. Forssell-Aronsson, Dosimetric characterization of radionuclides for systemic tumor therapy: Influence of particle range, photon emission, and subcellular distribution, Medical Physics 33 (9) (2006) 3260–3269.
- [5] G. J. Beyer, Radioactive ion beams for biomedical research and nuclear medical application, Hyperfine Interactions 129 (1-4) (2000) 529–553.
- [6] F. Rosch, Radiolanthanides in endoradiotherapy: an overview, Radiochimica Acta 95 (6) (2007) 303–311.
- [7] M. R. Zalutsky, Radionuclide therapy, Vol. 4, Springer, 2011, p. 2180.
- [8] H. Uusijarvi, P. Bernhardt, F. Rosch, H. R. Maecke, E. Forssell-Aronsson, Electron- and positron-emitting radiolanthanides for therapy: Aspects of dosimetry and production, Journal of Nuclear Medicine 47 (5) (2006) 807–814.
- [9] D. C. Aumann, W. Guckel, Absolute cross-sections and isomeric cross-section ratios for nd-148(d,2n), nd-148(p,n), and nd-146(alpha,pn) reactions producing isomeric pair pm-148(m,g), Physical Review C 16 (1) (1977) 160–166.
- [10] P. P. Dmitriev, N. N. Krasnov, G. A. Molin, Radioactive nuclide yields for thick target at 22 mev deuterons energy, Yadernie Konstanti 34 (4) (1982) 38.
- [11] Canberra, http://www.canberra.com/products/radiochemistry_lab/genie-2000-software.asp. (2000).
- [12] G. Székely, Fgm - a flexible gamma-spectrum analysis program for a small computer, Computer Physics Communications 34 (3) (1985) 313–324.
- [13] F. Tárkányi, F. Szelecsényi, S. Takács, Determination of effective bombarding energies and fluxes using improved stacked-foil technique, Acta Radiologica, Supplementum 376 (1991) 72.
- [14] R. R. Kinsey, C. L. Dunford, J. K. Tuli, T. W. Burrows, Nudat 2.6 http://www.nndc.bnl.gov/nudat2/, in: Proceedings of the 9th International Symposium on Capture Gamma – Ray Spectroscopy and Related Topics, Vol. 2, Springer Hungarica Ltd, p. 657.
- [15] B. Pritychenko, A. Sonzogni, Q-value calculator, http://www.nndc.bnl.gov/qcalc (2003).
- [16] H. H. Andersen, J. F. Ziegler, Hydrogen stopping powers and ranges in all elements. The stopping and ranges of ions in matter, Volume 3., The Stopping and ranges of ions in matter, Pergamon Press, New York, 1977.
- [17] I.-B. of-Weights-and Measures, Guide to the expression of uncertainty in measurement, 1st Edition, International Organization for Standardization, Genève, Switzerland, 1993.
- [18] M. Bonardi, The contribution to nuclear data for biomedical radioisotope production from the milan cyclotron facility (1987).
- [19] M. Herman, R. Capote, B. V. Carlson, P. Oblozinsky, M. Sin, A. Trkov, H. Wienke, V. Zerkin, Empire: Nuclear reaction model code system for data evaluation, Nuclear Data Sheets 108 (12) (2007) 2655–2715.
- [20] F. Tárkányi, A. Hermanne, S. Takács, F. Ditrói, I. Spahn, S. F. Kovalev, A. V. Ignatyuk, S. M. Qaim, Activation cross sections of the tm-169(d,2n) reaction for production of the therapeutic radionuclide yb-169, Applied Radiation and Isotopes 65 (6) (2007) 663–668.
- [21] F. Tárkányi, A. Hermanne, S. Takács, K. Hilgers, S. F. Kovalev, A. V. Ignatyuk, S. M. Qaim, Study of the 192os(d,2n) reaction for, production of the therapeutic radionuclide 192ir in no-carrier added form, Applied Radiation and Isotopes 65 (11) (2007) 1215–1220.
- [22] A. J. Koning, S. Hilaire, M. C. Duijvestijn, Talys-1.0 (2007).
- [23] A. J. Koning, D. Rochman, S. van der Marck, J. Kopecky, J. C. Sublet, S. Pomp, H. Sjostrand, R. Forrest, E. Bauge, H. Henriksson, O. Cabellos, S. Goriely, J. Leppanen, H. Leeb, A. Plompen, R. Mills, Tendl-2013: Talys-based evaluated nuclear data library (2012).