E949 Collaboration
Search for heavy neutrinos in decays
Abstract
Evidence of a heavy neutrino, , in the decays was sought using the E949 experimental data with an exposure of stopped kaons. With the major background from the radiative decay understood and suppressed, upper limits (90% C.L.) on the neutrino mixing matrix element between muon and heavy neutrino, , were set at the level of to for the heavy neutrino mass region 175 to 300 MeV/.
pacs:
14.60.St, 13.20.EbI Introduction
With neutrino mass and mixing confirmed (see Hirata et al. (1989); Anselmann et al. (1992); Abdurashitov et al. (1994); Fukuda et al. (1996, 1998a); Ahmad et al. (2001); Bellini et al. (2012); Fukuda et al. (1998b); Eguchi et al. (2003); Ahn et al. (2006); Adamson et al. (2008); Abe et al. (2011); Adamson et al. (2011); Abe et al. (2012); An et al. (2012); Ahn et al. (2012) and references therein), a natural extension of the Standard Model (SM) involves the inclusion of sterile neutrinos which mix with ordinary neutrinos to explain phenomena that may be inconsistent with the Standard Model. An example of such a theory is the Neutrino Minimal Standard Model (MSM) Asaka and Shaposhnikov (2005); Asaka et al. (2005). In this model, three massive right-handed neutrinos are introduced to explain simultaneously neutrino oscillations, dark matter and baryon asymmetry of the Universe.
The weak eigenstates of the neutrinos are related to their mass eigenstates by a unitary matrix. The active neutrino mixing can be induced through
| (1) |
where ; the mass eigenstates with masses are denoted as ; are the elements of the Pontecorvo-Maki-Nakagawa-Sakata matrix; are heavy sterile neutrinos with masses ; and are mixing parameters between active neutrinos and heavy neutrinos.
In the MSM the mixing between active light neutrinos and heavy sterile neutrinos gives rise to the production of heavy neutrinos in weak decays of heavy mesons as well as the decay of the heavy neutrinos to SM particles. Two strategies can be used in the experimental searches for these particles. The first one is related to their production. Since they are massive, the kinematics of two body decays () and are not the same. The study of kinematics of rare meson decays can constrain the strength of the coupling of heavy leptons using the following expression Shrock (1981):
| (2) |
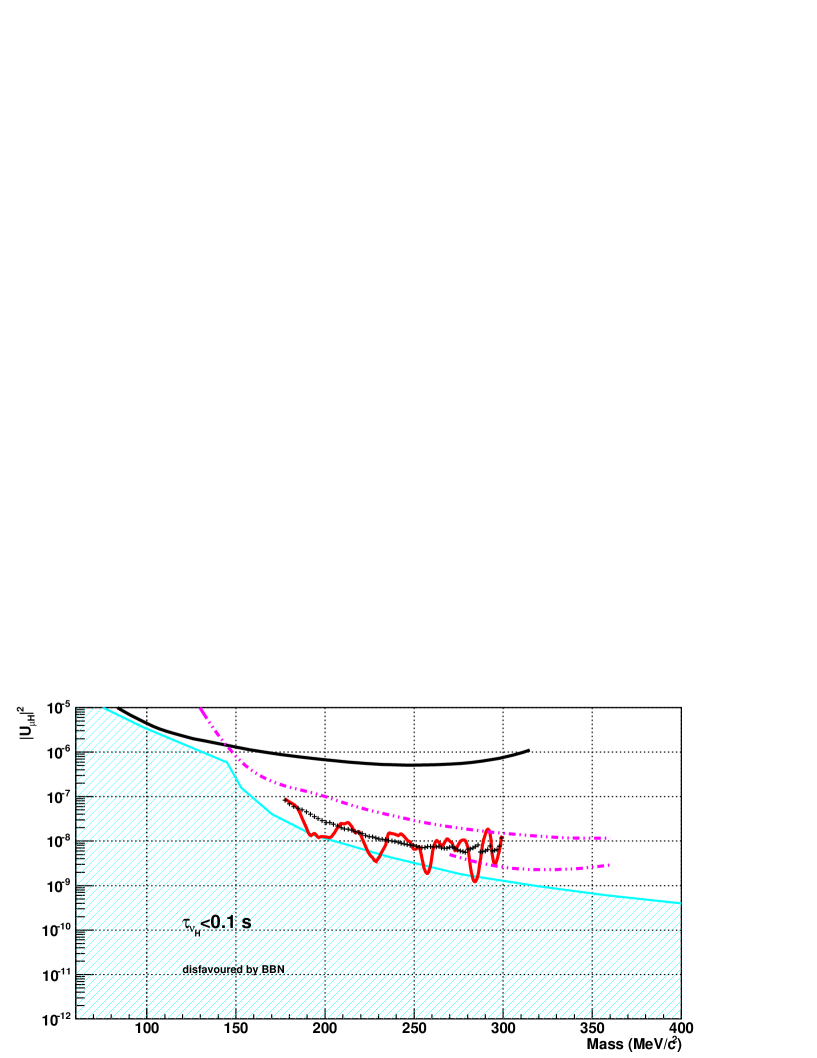
where is a kinematical factor which lies in the range from 1 to 4 for MeV/; and is one of the MSM heavy neutrinos. This strategy has been used in a number of experiments for the search of neutral leptons (heavy neutrinos) in the past Asano et al. (1981); Hayano et al. (1982); Yamazaki et al. (1984); Daum et al. (2000); Aoki et al. (2011), where the spectra of electrons and muons originating in decays of pions and kaons have been studied. The second strategy is to look for the decays of heavy neutrinos to hadrons and leptons Bernardi et al. (1988); Badier et al. (1986); Cooper-Sarkar et al. (1985); Gallas et al. (1995); Vaitaitis et al. (1999); Abreu et al. (1997); Adriani et al. (1992); Vilain et al. (1995). The bounds on mixing matrix element are shown in Figure 1 Atre et al. (2009).
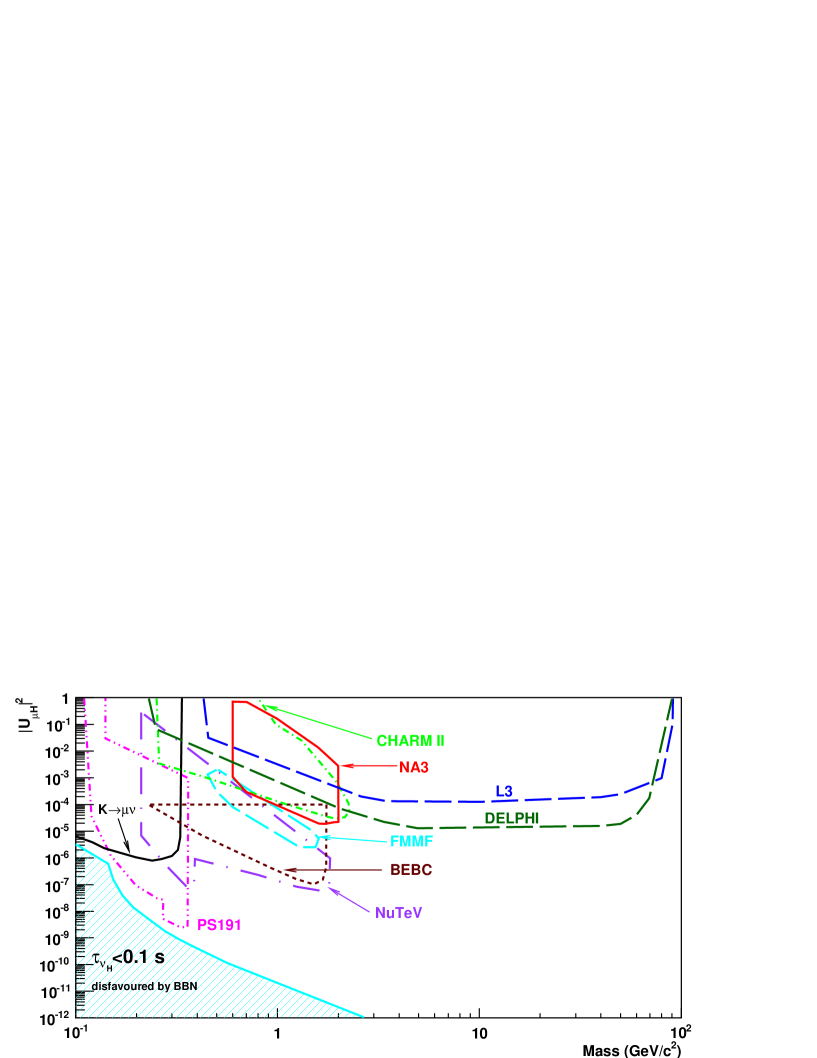
The best constraints in the small mass region MeV/ were from the CERN PS191 Bernardi et al. (1988) experiment, giving roughly in the region 250 MeV/. In the CERN PS191 analysis, the heavy neutrino production and decay rates were calculated for usual Dirac neutrinos with the sole assumption of a Dirac mass matrix. Production rates for the channels presented in Figure 1 are not modified if the mass eigenstates are of the Majorana type. Decay rates for non-self charge conjugate channels are multiplied by a factor of two for Majorana neutrinos. The limits given here should therefore be divided by the square root of two if one considers massive Majorana neutrinos.
The successful predictions of the Big Bang Nucleosynthesis (BBN) also allow establishment of a number of lower bounds on the couplings of neutral leptons Gorbunov and Shaposhnikov (2007); Boyarsky et al. (2009), which considerably limit the allowable window for the couplings and masses, but these bounds are model-dependent. The existence of heavy neutrinos should not spoil the BBN predictions, so the heavy neutrino lifetime, , should be less than 0.1 s. The BBN bound shown in Figure 1 was calculated in the MSM framework assuming that the coupling of to the third generation of leptons is stronger than to the others. In case of maximum coupling of to the first (second) generation of leptons the BBN bound will be weaker (stronger) as shown in Gorbunov and Shaposhnikov (2007).
In this paper, we present the result of a search for heavy neutrinos in decays from the inclusive muon spectrum of decays using the kaon decay-at-rest data from the E949 Artamonov et al. (2009) experiment. Since the E949 experiment focused on measuring the branching ratio of the rare kaon decay , the principal trigger selection criteria were designed to identify pions and reject muons. In the present analysis, however, decay product muons must be identified; these muons are present in the data set due to inefficiencies in the pion selection criteria applied. In this analysis we used E949 data taken from March to June in 2002. The total exposure for this analysis is stopped kaons 111This is slightly less than stopped kaons used for the E949 analysis Artamonov et al. (2009).. The analysis is sensitive to the heavy neutrino mass region between 175 and 300 MeV/ that corresponds to muon momentum 200 to 130 MeV/c.
II Experiment
II.1 Detector
The E949 beam was produced by a high-intensity proton beam from the Alternating Gradient Synchrotron (AGS) at Brookhaven National Laboratory (BNL). Protons were accelerated to a momentum of 21.5 GeV/c and hit a platinum production target.
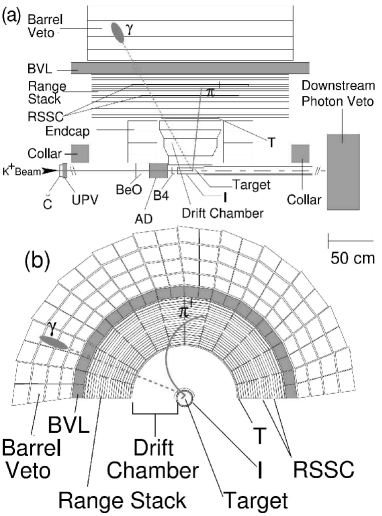
The experimental setup is illustrated in Figure 2. Incoming 710 MeV/c kaons with ratio of 3/1 were identified by a Čerenkov counter. Two beam wire chambers (BWPCs) allowed monitoring of the beam profile and identification of multiple incoming particles. Downstream of the BWPCs, cylindrical degraders slowed the kaons so that they came to rest in the center of the target. The inactive degrader was made of 11.1 cm long BeO and 4.76 mm Lucite. The active degrader (AD) consisted of 40 layers of 2 mm thick scintillator disks (139 mm diameter) alternating with 2.2 mm thick copper disks (136 mm diameter). The AD was split into 12 azimuthal segments. The scintillation light in each segment was sent to a single photomultiplier tube (PMT) through wavelength shifting fibers and read out by analog-to-digital converters (ADCs), time-to-digital converters (TDCs) and charge-coupled devices (CCDs). Using this information the AD allowed identification of the beam particles and detection of activity coincident with kaon decays. After passing through the degrader, a beam hodoscope (B4) detected the incoming particle and identified it as a kaon by measuring the energy deposit.
The target consisted of 413 plastic scintillating fibers 3.1 m long with a 5-mm square cross section to form a 12 cm diameter cylinder. A number of smaller fibers (“edge” fibers) filled in the gaps near the outer edge of the target. Each 5-mm fiber was connected to a PMT, whereas the edge fibers were grouped into 12 and each group of the edge fibers was connected to a single PMT. The PMTs were read out by ADCs, TDCs and CCD digitizers. The fiducial region of the target was defined by two layers of six plastic scintillation counters that surrounded the target. The inner counters (IC) tagged decay products for a trigger before they entered the drift chamber. The outer counters (VC) overlapped the downstream edge of the IC by 6 mm and served to detect particles that decayed downstream of the fiducial region.
The drift chamber, “Ultra Thin Chamber” (UTC), was located outside of the IC. The whole E949 spectrometer was in a 1 Tesla magnetic field. Positively charged particles were bent clockwise in the view from downstream. The primary functions of the UTC were the momentum measurement of charged particles and providing a match between the tracks in the target and the range stack explained in the next paragraph. The UTC had a length of 51 cm and inner and outer radii of 7.85 cm and 43.31 cm, respectively.
The range stack (RS) was outside of the UTC at an inner radius of 45.08 cm and an outer radius of 84.67 cm. It consisted of 19 layers of plastic scintillators azimuthally segmented into 24 sectors. The scintillators of layers 2-18 had a thickness of 1.905 cm and a length of 182 cm. The scintillators of layer 19 had a thickness of 1 cm and were mainly used to veto charged particles with long range by requiring that they did not reach this layer. The innermost counters, called T-counters, served to define the fiducial volume for kaon decay products. The scintillation light was transmitted by light guides to PMTs. Each PMT was read out by an ADC, a TDC and a transient digitizer (TD). The primary functions of the RS were energy and range measurements of charged particles and their identification.
The detection of any activity coincident with the charged track is very important for suppressing the backgrounds for decay. Photons from and other radiative decays were detected by hermetic photon detectors with solid angle coverage. Vetoing photons was accomplished using the Barrel Veto (BV), the Barrel Veto Liner (BVL), the upstream and downstream End Caps (ECs), the upstream and downstream Collar detectors (CO), the downstream Microcollar detector (MC), as well as the target, RS and AD. The BV and BVL with a thickness of 14.3 and 2.29 radiation lengths at normal incidence, respectively, provided photon detection over 2/3 of solid angle. The photon detection over the remaining 1/3 of solid angle was provided by the other calorimeters in the region from to of the beam axis with a total thickness from 7 to 15 r.l.
The coordinate system of the detector is defined such that the origin is at the center of the target; the axis is along the beam direction; and the axis and axis are set in the horizontal and vertical directions, respectively.
A more detailed description of the E949 experiment can be found in Artamonov et al. (2009).
II.2 Monte Carlo
The detector and the physics processes in it were modeled by the electromagnetic-shower simulation package EGS4 program Nelson et al. (1985). The simulation of kaon decays in the E949 detector starts from a beam file with the , and positions of kaon decays in the target obtained from an analysis of the decays. The simulation result includes all of the detector elements, but without the beam instrumentation upstream of the target, and the TD and CCD pulse-shape information.
II.3 Trigger
The experimental signature of the decay is similar to the decay: one single charged track with no other detector activity. This motivates the use of the main E949 trigger to search for heavy neutrinos. It consists of several requirements:
-
•
stop requirements. A kaon must enter the target; this was checked by coincidence of the kaon Čerenkov detector, the B4 hodoscope and the target with at least 20 MeV energy deposit. To ensure that the kaon decays at rest, the secondary charged particle must hit the IC at least 1.5 ns later than the kaon hit in the Čerenkov detector.
-
•
Fiducial region and range requirements on charged tracks (). A charged track from a kaon decay must enter the fiducial volume of the detector; this was checked by coincidence hits in the IC and two first layers (T-Counter and layer 2) of the RS in the same sector. Low energy charged tracks from decays were suppressed by the RS layer requirement that they must reach at least the sixth layer of the RS.
-
•
Long tracks (in general, muons from decay) were suppressed by the layer 19 veto requirement ().
-
•
Online pion identification (). It required a signature of decay in the online-selected stopping counter. The from the decay at rest has the kinetic energy of 4 MeV (a few mm equivalent range in plastic scintillator) and rarely exits the stopping counter. So, pion pulses in the stopping counter recorded by the TDs have a double-pulse structure. Despite the online pion identification requirement, some muons remained in the final sample due to inefficiency.
-
•
Refined range requirements on a charged track (). It took into account the number of target fiber hits and the track’s downstream position (-coordinate) in RS layers 3, 11, 12, 13 as well as the deepest layer of penetration. This condition suppressed long muon tracks which passed the layer 19 veto requirement.
-
•
Online photon veto. Events were rejected if any activity in the BV, BVL or EC with energy above a threshold was detected. This condition removed events with photons. A similar requirement in the RS is also applied. The 24 sectors of the RS are conventionally grouped into six; a group of 4 sectors is called a ”hextant”. Only one hextant is allowed to have hits or two hextants if they are adjacent. This rejects events with multiple tracks and events with photon activity in the RS.
A sample of data selected by the main E949 trigger is shown in Figure 3, where , , pion band, muon band, range tail, and range tail are defined.

In addition to the main trigger, various monitor triggers also collected events for use in data quality assessments, calibrations of the detector subsystems and acceptance calculations Adler et al. (2008). In our analysis we used K2, K2(1), and monitor triggers.
The K2 trigger was designed to collect muons from the decay. Since the final state does not contain photons or additional tracks, it is a convenient sample to study beam and target related acceptance factors described in next section for our signal decay. The K2 trigger requirements are the following: a kaon must enter the target; the outgoing charged track must reach the sixth or seventh layer of the RS and then hit the 17th, 18th or 19th layer of the RS.
The K2(1) trigger was designed to collect pions from the decay. The requirements are the following: a kaon must enter the target; the outgoing charged track must reach at least the sixth layer of the RS and must not hit 19th layer of the RS. According to these requirements muons from the or decays also can pass the K2(1) trigger. We extracted these muons to study acceptance factors such as online pion identification and range-momentum consistency (described below).
Among the incoming beam particles there were many pions, including some scattered into the fiducial volume of the RS. These scattering events were selected by special trigger to study track quality. It requires that a pion enters the target and has an in-time track in the RS.
In addition, the trigger for beam kaons, , was also defined to study trigger efficiency and detector geometrical alignment. It requires that a kaon enters the target.
In the analysis, common acceptance factors about kaon beam, track quality, etc. measured by and triggers are taken from a previous analysis Artamonov et al. (2009) (more detail in later sections).
III Analysis
III.1 Strategy
The method used for identification of heavy neutrinos is to search for additional peaks below the main peak. To do such a measurement we need to know the total acceptance for the decay channel and signal shape.
The total acceptance was measured using muon samples taken by the K2, K2(1) triggers and Monte Carlo simulation. The total acceptance was verified by determining the branching ratios of the decay (high momentum region) and the decay (low momentum region).
The signal shape was studied using Monte Carlo simulation of the decay.
The full E949 data sample was split into 1/20 and 19/20 samples. The 1/20 sample was selected by choosing every twentieth event. The 1/20 data sample was used to study background shapes, systematic uncertainties and to verify the total acceptance measurement. The 19/20 sample was kept separate and not accessed until all cuts were determined.
III.2 Offline selection criteria
In this analysis we used eight groups of offline selection criteria.
-
1.
Track reconstruction in the UTC (UTCQUAL). It rejected events with poor UTC fits in either or . Events with overlapping tracks were also rejected.
-
2.
Kinematic cuts were used to select events in the fiducial volume of the detector. It was required that the cosine of the polar angle of a charged track () was within () and matched the stopping location determined for each range stack layer. Also, the charged track must pass the UTC fiducial volume cut. The position at the UTC outer layer should be within the active region ( cm).
-
3.
RS track reconstruction and matching with the UTC track (PRRF). This cut rejected events with the charged track scattering in the RS.
-
4.
Beam cuts. Several cuts were used to identify the incoming particle as a kaon and remove extra beam particles at the track time Artamonov et al. (2009).
-
5.
Delayed coincidence (DELC). This cut removed kaon decays-in-flight by requiring that a kaon should decay at least 2 ns after it entered the target.
-
6.
Target cuts. Numerous requirements were placed on the activity in the target to suppress random background and ensure reliable determination of the kinematic properties of the charged muon. These requirements were based on the results of the reconstructed energy and time of the pion and kaon fibers, the pattern of kaon and pion fibers relative to information from the rest of the detector and the results of the target-track fitter Artamonov et al. (2009).
- 7.
-
8.
Photon veto cuts. This cut removed events with photon activity in the detector. For the heavy neutrino analysis we used loose and tight photon veto cuts. The loose photon veto was used to measure the branching ratio, the total acceptance systematic error and study background shapes. The tight photon veto cuts were used for the total acceptance estimation, to process the 19/20 sample, and for producing the final result.
The momentum spectra based on the 1/20 data sample after applying each group of cuts are shown in Figure 4.
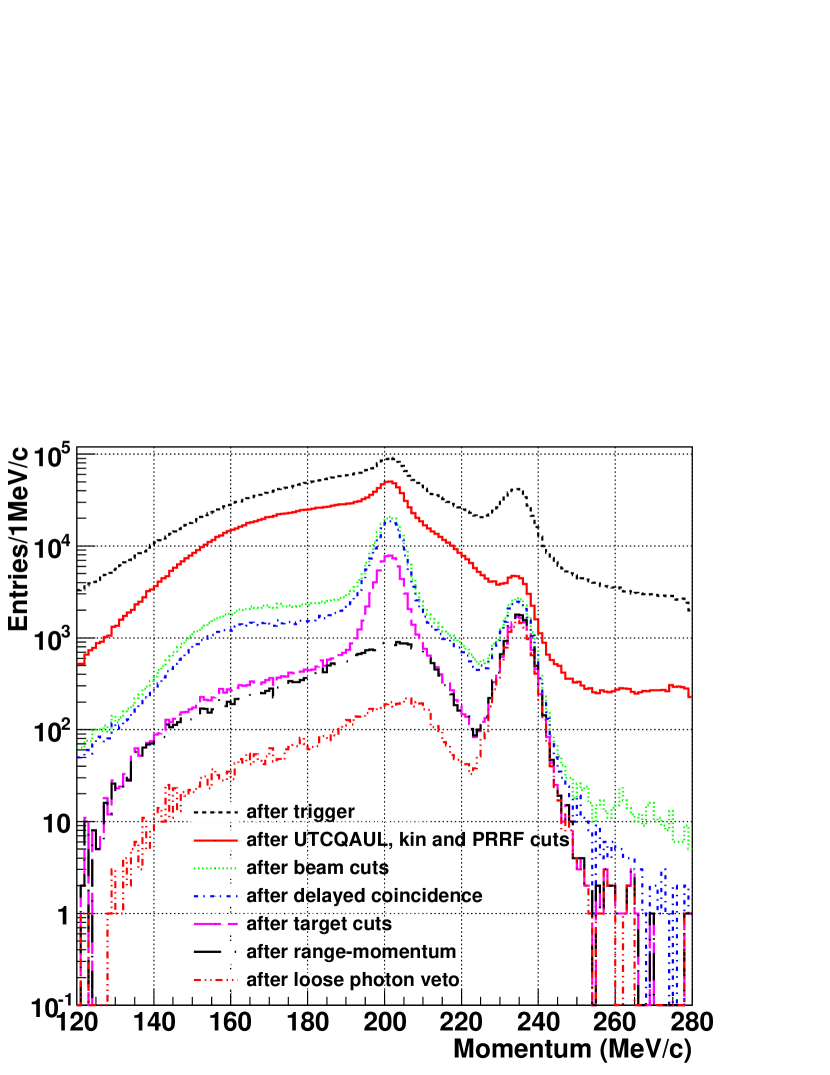
After the beam and DELC cuts, the kaon decay-in-flight backgrounds were greatly suppressed. After the RNGMOM cut, the pion background was removed and the peak disappeared. It should be noted that the RNGMOM cut was applied only for the muon band events with MeV/c. The photon veto cut further suppressed photon backgrounds like and . It also changed the relative magnitude of peak and the muon band.
III.3 Total acceptance
III.3.1 Measurement
The total acceptance for the decay was dominated by two main factors: online trigger requirements and offline selection criteria. The online trigger requirements are described in Sec. II.3 and the offline criteria are described in Sec. III.2.
We used the Monte Carlo simulation to measure the acceptance of simple cuts: the online fiducial region and range requirements on charged tracks, layer 19 veto, refined range and kinematic cuts. But the simulation package is not suitable for some online requirements such as pion identification or delayed coincidence because these cuts were not reliably implemented in the Monte Carlo. Their acceptances were extracted from data.
To study the acceptance of the beam, target, DELC, and photon veto cuts we used muons from the decay that satisfied the K2 trigger requirements since this decay had the same signature as for signal decay: one charged track and nothing else. These cuts were assumed to be momentum independent.
For the online pion identification and RNGMOM cut we measured the momentum dependent acceptance curve using muons that survived the K2(1) trigger requirements.
The acceptances of UTCQUAL and PRRF cuts were measured using scattering pions from the trigger and the values were taken from the main E949 analysis Artamonov et al. (2009).
Two factors were also taken into account for the total acceptance estimation. The first one, , accounts for the acceptance loss due to the geometrical and counter inefficiencies of the T-counters; it was measured using trigger and its value was taken from the main E949 analysis Artamonov et al. (2009). The second one, , is the stop efficiency in the target; it was measured using the K2(1) trigger. Both and were assumed to be momentum independent.
The total acceptance after applied cuts is shown in Figure 5.
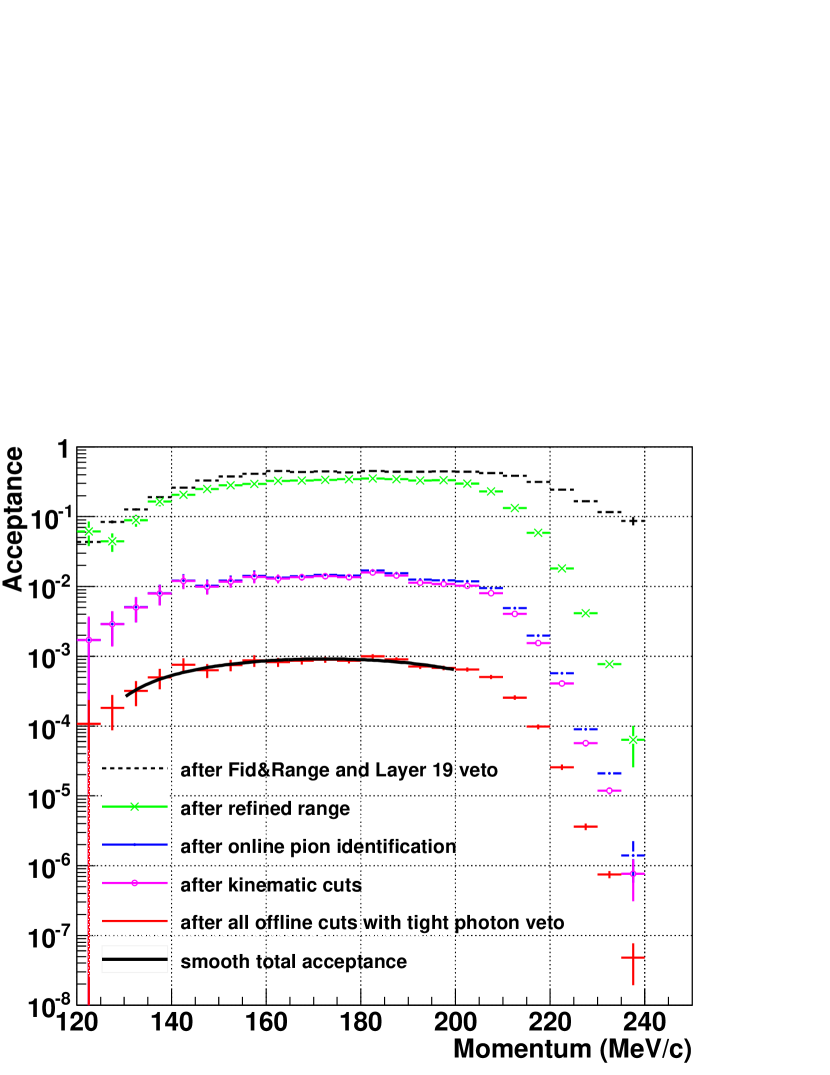
The acceptance drop off below 140 MeV/c is due to the requirement that charged track must reach at least the sixth layer of the range stack. The acceptance drop off above 200 MeV/c is due to two requirements. First, the charged track must not reach layer 19 of the range stack and second, the refined range removes long tracks which are dominant at high momentum for events passing the layer 19 requirement. The main acceptance loss (factor ) comes from the online pion identification requirement (blue curve in Figure 5). It should be noted that the acceptance curves in Figure 5 must be corrected for momentum MeV/c since the Monte Carlo simulation of layer 19 and the refined range requirements are not accurate in this region. However, this is not relevant for the heavy neutrino study since we will investigate the momentum region between 130 MeV/c and 200 MeV/c. According to Figure 5 the acceptance is smooth and has a maximum in this region. The total acceptance for the decay with heavy neutrino mass MeV/ ( MeV/c) was measured to be
| (3) |
where the error is statistical. The systematic uncertainty will be presented below. So, the single event sensitivity (S.E.S.) for the heavy neutrino with mass MeV/ can be calculated as
| (4) |
where is the total acceptance and is the total number of stopped kaons. This sensitivity is roughly constant for the whole investigated region.
III.3.2 Verification
The and branching ratios were measured using the 1/20 data sample to verify the total acceptance for the signal decay. Table 1 shows they share a lot of common data samples for acceptance measurement of the signal channel.
| Acceptance factors | ||||
|---|---|---|---|---|
| K2(1) | ||||
| MC | ||||
| K2 | ||||
| K2(1) | ||||
| K2(1) | ||||
| not applied | ||||
| K2 | ||||
| Loose | not applied | MC | ||
| Tight | K2 | not applied | not applied | |
The decay is similar to the signal decay, but it has higher muon momentum than our signal region. That’s why layer 19 veto, refined range and online pion identification acceptance factors must be remeasured.
The decay has muons with momentum in signal region, but there is an extra photon in the final state. That’s why photon veto acceptance must be studied separately and a different method was used to measure it.
-
•
measurement
The branching ratio was measured in the momentum region MeV/c. All acceptance factors except photon veto were already measured and shown in Figure 5. The photon veto acceptance for the decay should be studied separately due to the presence of one photon in final state.
Photons from the decay have energy MeV in the muon momentum region MeV/c. The photon veto acceptance in this region was determined using the single photon inefficiency table (see Appendix A and Mizouchi (2006)). The photon acceptance was measured to be .
The total acceptance for the decay was determined to be . Based the on 1/20 sample, the branching ratio was measured to be
(5) where the uncertainty includes both systematic and statistical effects. The uncertainty is completely dominated by the uncertainty in the photon acceptance.
The Particle Data Group (PDG) average value of the branching ratio is for MeV/c Olive et al. (2014). To compare our measurement with this value we need to determine the ratio . This ratio was calculated from Monte Carlo simulation of the decay with a threshold MeV to be . Therefore, the estimated PDG value for MeV/c would be
(6) Our measurement is consistent with the estimated PDG average within the uncertainty.
-
•
measurement
As mentioned in Sec. III.3.1, some acceptance factors for the momentum region MeV/c require correction. This momentum region is crucial for the branching ratio calculation because the mean muon momentum is MeV/c. Three main differently factors including layer 19, refined range and online pion identification were remeasured sequentially using experimental data from the K2 and K2(1) triggers.
The PRRF acceptance was also measured differently since the aim of this cut is to suppress scattering in the RS and the sample includes scattering events ( range-tail in Figure 3). The range-momentum cut (RNGMOM) was not applied for the branching ratio measurement because in our analysis we use this cut only for charged tracks with momentum below 220 MeV/c.
The total acceptance for the decay was measured to be , where the uncertainty is statistical and the main contribution comes from the refined range and online pion identification measurement due to low statistics in the K2(1) trigger after these cuts were applied. Statistics are low because the refined range and online pion identification were designed to reject muons. The result for the branching ratio is , where the uncertainty is statistical. This value is consistent with the world average value from PDG Olive et al. (2014) — . The decay will be studied with MeV/c and in this region the refined range and online pion acceptance were measured well (see Figure 5).
III.3.3 Summary
The summary of our acceptance study is presented in Table 2.
| , | |
|---|---|
| MeV/ | |
The errors in this table for individual cuts are statistical, and the systematic error for the total acceptance is from the error on the branching ratio measurement.
III.4 Residual background
The search for seeks evidence for additional peaks below the peak. So, all background sources that could mimic the signal must be understood. We simulated the main background sources, , and decays. After the trigger requirements and offline selection criteria, the contribution in the total number of background events is less than 1% of the contribution due to the presence of two photons in the final state. The decay can be ignored due to three photons in the final state and the large range-momentum pion rejection (which removes the pion band in Figure 3). Therefore, the is the dominant background source in the search for decays.
Given the agreement between the PDG values and our and branching ratio measurements, the experimental muon momentum spectra (see dashed-double dotted line in Figure 4) and the simulated muon momentum spectra can be compared.
The momentum spectra for the simulated + events and experimental events based on the 1/20 data sample are shown in Figure 6, where and were normalized according to their branching ratios. The red band shows the spread with the known acceptance uncertainties. The central histogram uses .
The momentum spectrum for data and MC do not agree. Between 200 MeV/c and 220 MeV/c, the radiative gamma energy is low. The difference is caused by the difficulty in simulating detector activity or electronic noise of the low photon veto cut threshold. Beyond 220 MeV/c, it is caused by the uncertainty of layer 19 and refined range cuts. Below 200 MeV/c, the trends of simulated and experimental spectra are consistent.
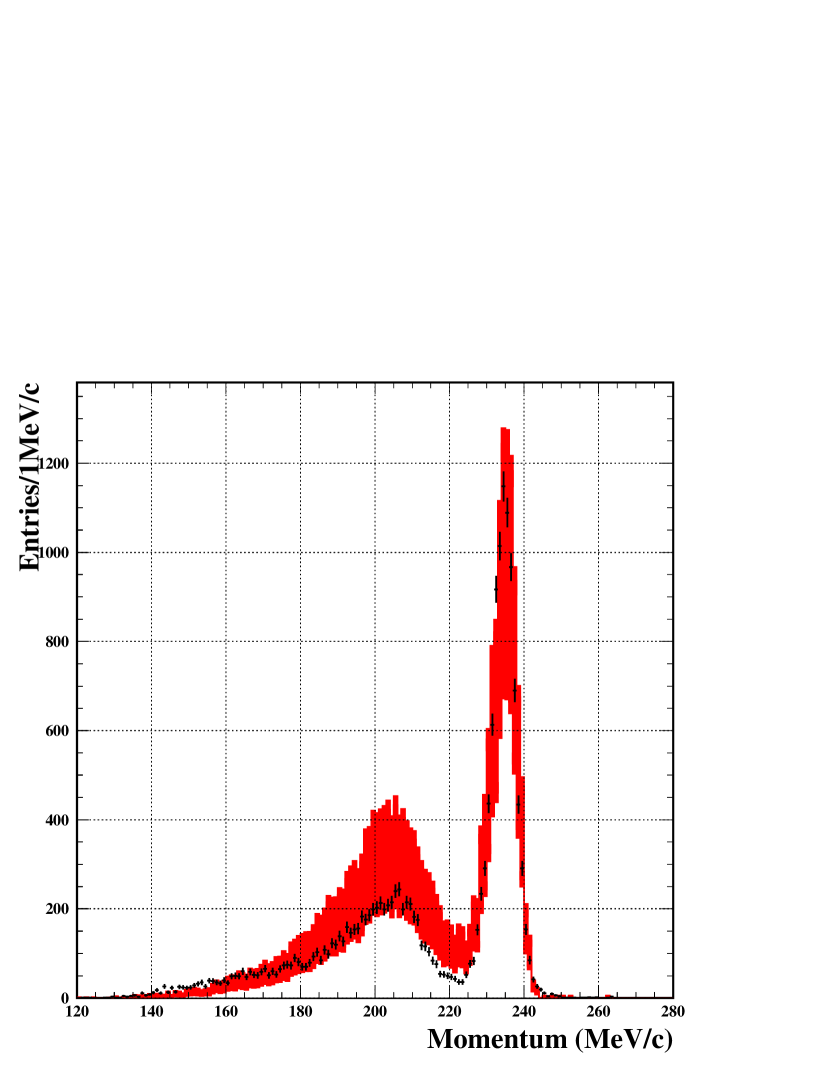
Since the simulated shape does not show obvious bumps or valleys, we assume that the experimental background shape is also smooth.
III.5 Resolution
The observed momentum distribution of two-body decays would be smeared by scattering and resolution effects. To obtain the expected shape, we compare Monte Carlo simulations with well-known decays, and , which were derived from monitor triggers. The results are shown in Figure 7 and Figure 8.
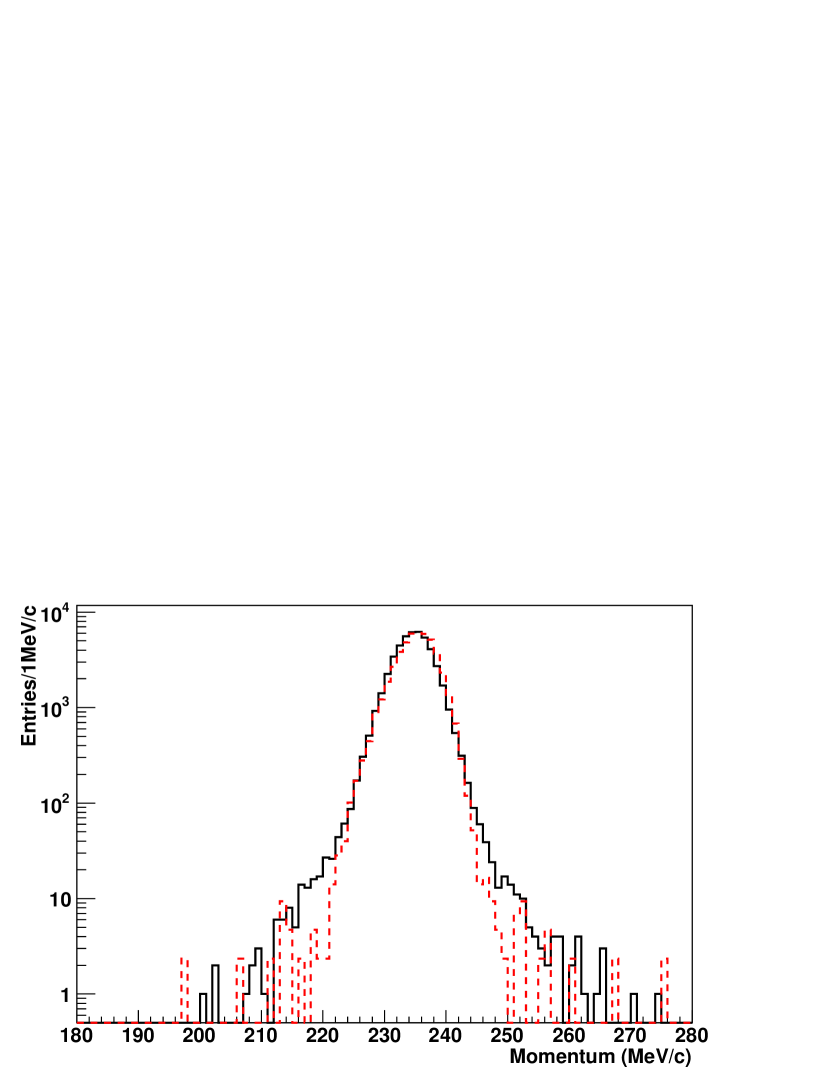
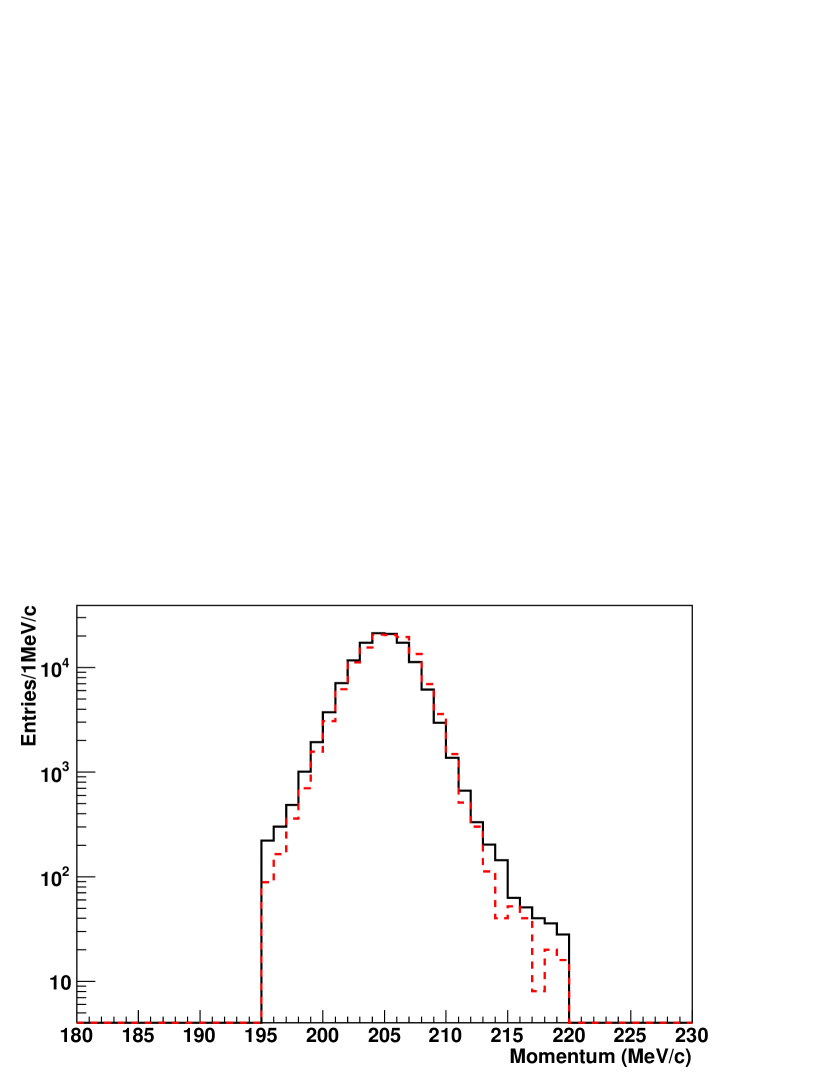
Both and simulated spectra are in a good agreement with the experimental spectra. The widths agree to within 2 % and the mean values agree to within 0.3 %, the tails are simulated to the level. We concluded that we may rely on Monte Carlo simulation to reproduce the detector momentum resolution.
Since the signal region is MeV/c, we simulated decays with different heavy neutrino masses for which the muon momentum is within the signal region.
The signal after all cuts is well reproduced by a Gaussian function and we used the standard deviation of the fit to measure the detector resolution. The decay with 16 different heavy neutrino masses within the main E949 trigger was simulated. The momentum resolution distribution is shown in Figure 9.
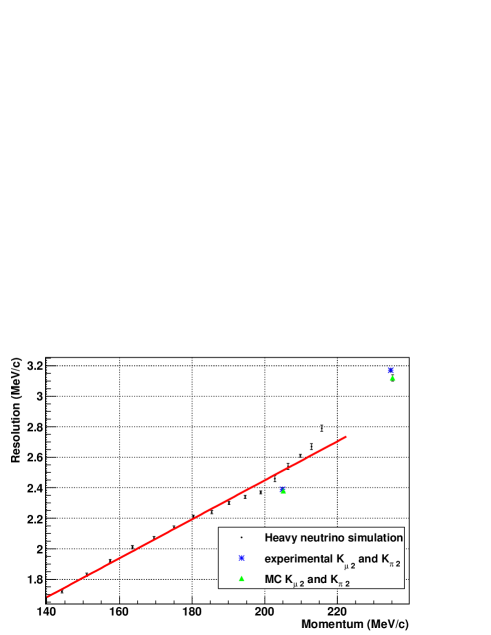
The linear fit gave us the expression for the resolution dependence on momentum as
| (7) |
where the first error is the maximum difference between the MC heavy neutrino points and the fitted line. The source of the second error is the maximum difference between the Monte Carlo simulation and the data points for the decays and .
III.6 Peak search
To search for heavy neutrino peaks asymptotic formulae for likelihood-based tests were used, which were derived using the results of Wilks and Wald Cowan et al. (2011). The method is a frequentist approach which is free of computationally expensive Monte Carlo calculations and is able to consider the shape of the signal. It thus avoids the ambiguity of selecting a signal region (like three or five times the resolution). In addition to the mean value of the upper limit, an error band of the upper limit can be also calculated.
The following likelihood function was used in the analysis
| (8) |
where is the number of bins of the fitting region; and are the probabilities of signal and background events in the th bin after normalization, respectively; is the number of observed events in the th bin; the nuisance parameter gives the total background strength; the nuisance parameter is added to correct the total acceptance via a Gaussian distribution which has a mean at (Figure 5) and a sigma at (table 2); and gives the total signal strength. The signal shape is a Gaussian distribution with standard deviation , which is the momentum resolution in MeV/c as a function of the momentum (Eq. 7). The background shape and its mean strength was determined by data and will be discussed in detail later.
A profile likelihood ratio was constructed for a signal strength parameter being tested
| (9) |
where the two nuisance parameters are represented as ; in the numerator denotes the value of that maximizes likelihood L; the denominator is the maximized likelihood function with all parameters free and and are the best fit results. Given a set of parameters, the follows a Gaussian distribution caused by the statistical fluctuation of the data sample and the mean value of is the true signal strength represented by . This gives rise to the random distribution of the profile likelihood ratio.
More conveniently, the statistic
| (10) |
has a known distribution which is a chi-square distribution for one degree of freedom when equals to the true signal strength , for example =, and the most probable value of is zero. When is different with the true signal strength , this test statistics follows a noncentral chi-square distribution for one degree of freedom and its median value (peak) deviates from zero, therefore the upper limit of can be determined when the coverage at the value of meets the required confidence level based on the distribution under the condition of ==0. The error band of the upper limit can be also derived from the spread of the distribution.
The concept of was expanded to take into account the physical boundary
| (11) |
where the best guess of was set to zero when its best fit result was negative, and this test statistic gives results consistent with the Feldman-Cousins method Feldman and Cousins (1998). Due to the complexity of this segmented function, the integral was calculated numerically to scan the coverage of .
According to Cowan et al. (2011), the Asimov data set (==0) was used to evaluate the expected upper limit and its error band. For the heavy neutrino search in this paper, the background shape in the Asimov data set was determined directly by fitting the momentum spectrum of data after all criteria. To avoid artificial peaks or valleys in the signal region, the range (the is the momentum resolution in Eq. 7) around the point of interest was chosen to fit for background with a second order polynomial function. The observed limit on data was extracted with Eq. 11.
The 1/20 sample with loose photon veto in Figure 4 was chosen to test fit quality. The tight photon veto is not suitable for this due to very low statistics in the 1/20 sample. The background fitted result’s varies between 0.7 and 1.4, where the is the number of degrees of freedom and corresponds to the number of points used in the fit minus the number of fit parameters.
IV Results
With the real data, the Asimov data and the test statistic , the mixing matrix element upper limit can be obtained for a fixed momentum value. The mixing matrix element upper limit was calculated using the equation below which can be derived from Eq. 2
| (12) |
where is the total acceptance, is the number of stopped kaons, is a kinematical factor Shrock (1981) and is the branching ratio Olive et al. (2014). According to constructed likelihood function (Eq. 8), the signal strength parameter is not the number of candidate events itself, but number of candidate events after correcting for acceptance. Therefore, the value is the strength parameter and the upper limit of leads to the upper limit of .
After the 1/20 data sample analysis and the peak search method was tested, we proceeded to analyze the full E949 data sample and applied the tight PV. The muon momentum spectrum after all cuts is shown in Figure 10.
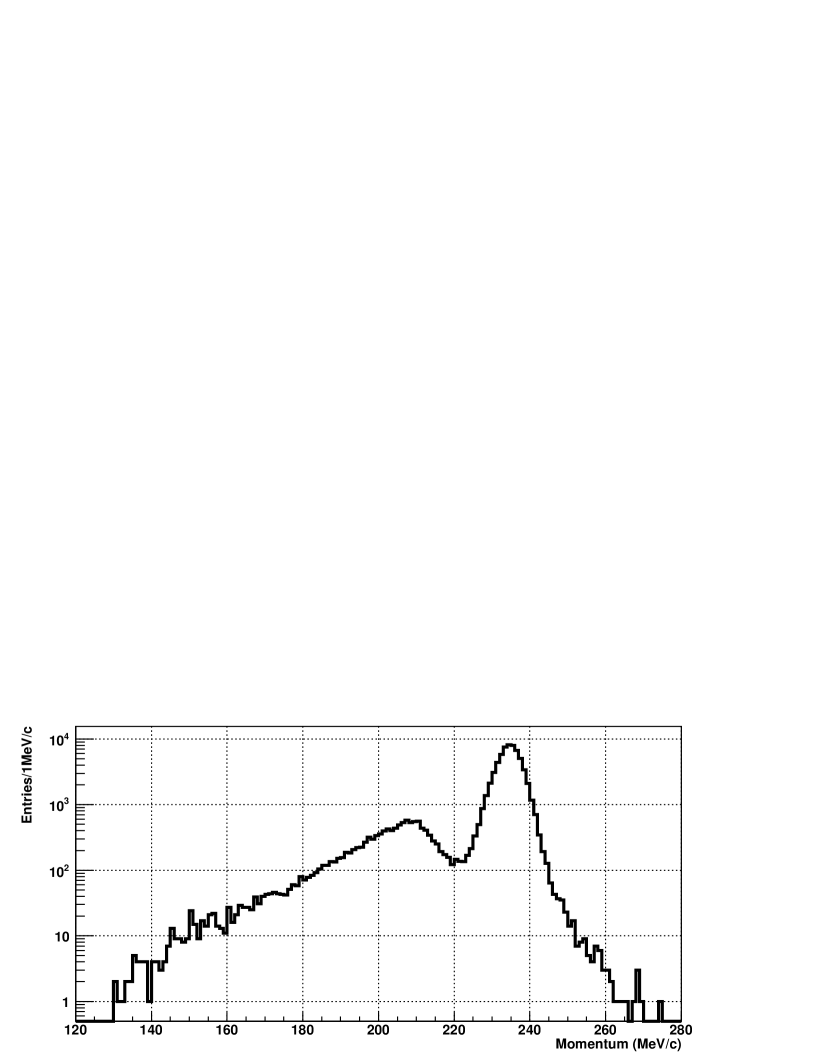
However, after processing the 19/20 sample for peak finding, we found that the region was not suitable for the high momentum region and a region was used. The background fitted results varies between 0.5 and 2.5 for the region and between 0.4 and 1.6 for the region.
The signal strength parameter vs. muon momentum is shown in Figure 11.
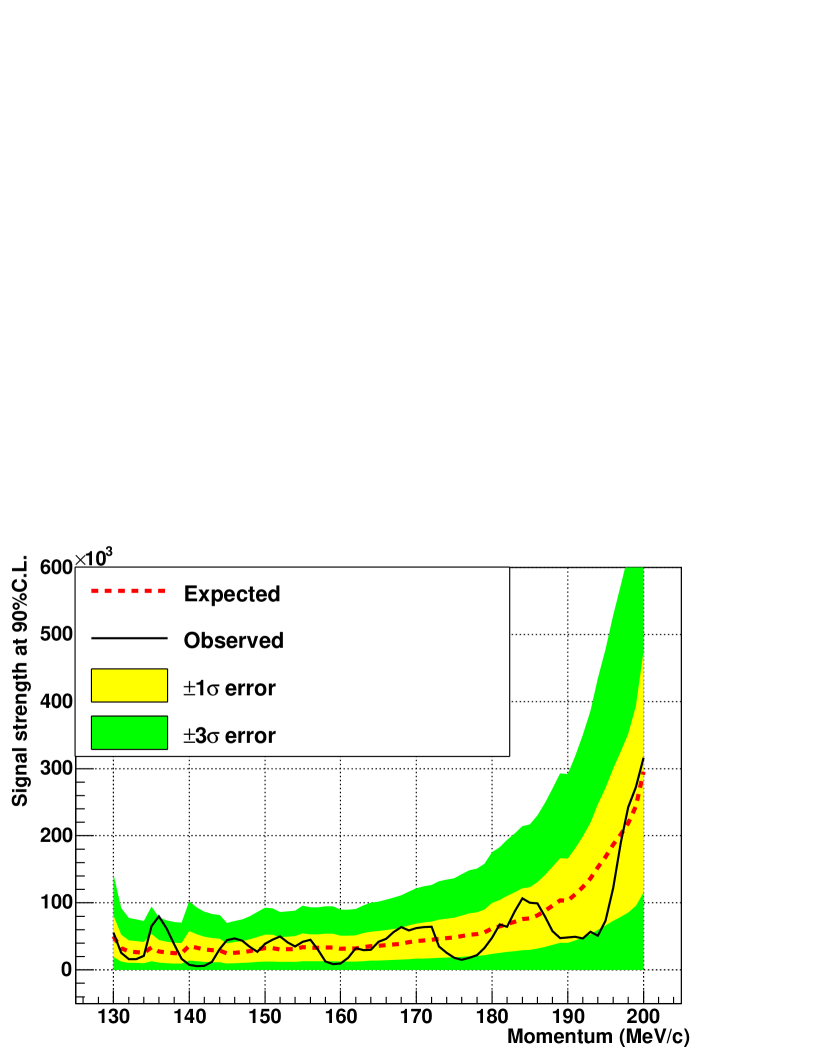
The dotted (red) line is the expected upper limit using the Asimov data and the solid (black) line is the observed result using real data. In addition, the (color) filled area is the 1 and error bands evaluated with the Asimov data in the momentum region from 130 MeV/c to 200 MeV/c. The uncertainty of the upper limit calculation is dominated by the statistics and the error of the total acceptance.
There is no evidence for a heavy neutrino signal. According to our constructed likelihood (Eq. 8) in Figure 11 (y-axis) is at 90% C.L. and we can use it directly to calculate the mixing matrix element upper limit (Eq. 12). This result for the mixing matrix element upper limits at 90% C.L. is shown in Figure 12 varying from to .
V Summary
We reported the result of the search for heavy neutrinos in the decay channel using the E949 data sample in an exposure of stopped kaons. Heavy neutrinos with masses GeV/ are allowed by the MSM model. The main E949 trigger was designed to select pions, but muons were present in data set due to inefficiencies in the pion selection criteria applied. These muons were used for the search for heavy neutrinos. Since no evidence for extra peaks below the main peak was found we set new upper bounds on the mixing matrix element in the mass region 175–300 MeV/. The obtained bounds improve previous peak search results by two order of magnitude and the CERN PS191 results by order of magnitude in the selected heavy neutrino mass region. In contrast to the CERN PS191 or BBN bounds the result is model-independent because no assumptions about heavy neutrino decay rates or couplings.
Acknowledgements.
This research was supported in part by Grant #14-12-00560 of the Russian Science Foundation, the U.S. Department of Energy, the Ministry of Education, Culture, Sports, Science and Technology of Japan through the Japan-U.S. Cooperative Research Program in High Energy Physics and under Grant-in-Aids for Scientific Research, the Natural Sciences and Engineering Research Council and the National Research Council of Canada, National Natural Science Foundation of China, and the Tsinghua University Initiative Scientific Research Program.*
Appendix A The photon veto acceptance measurement for the decay
The single photon inefficiency table (SPI) is shown in Figure 13.
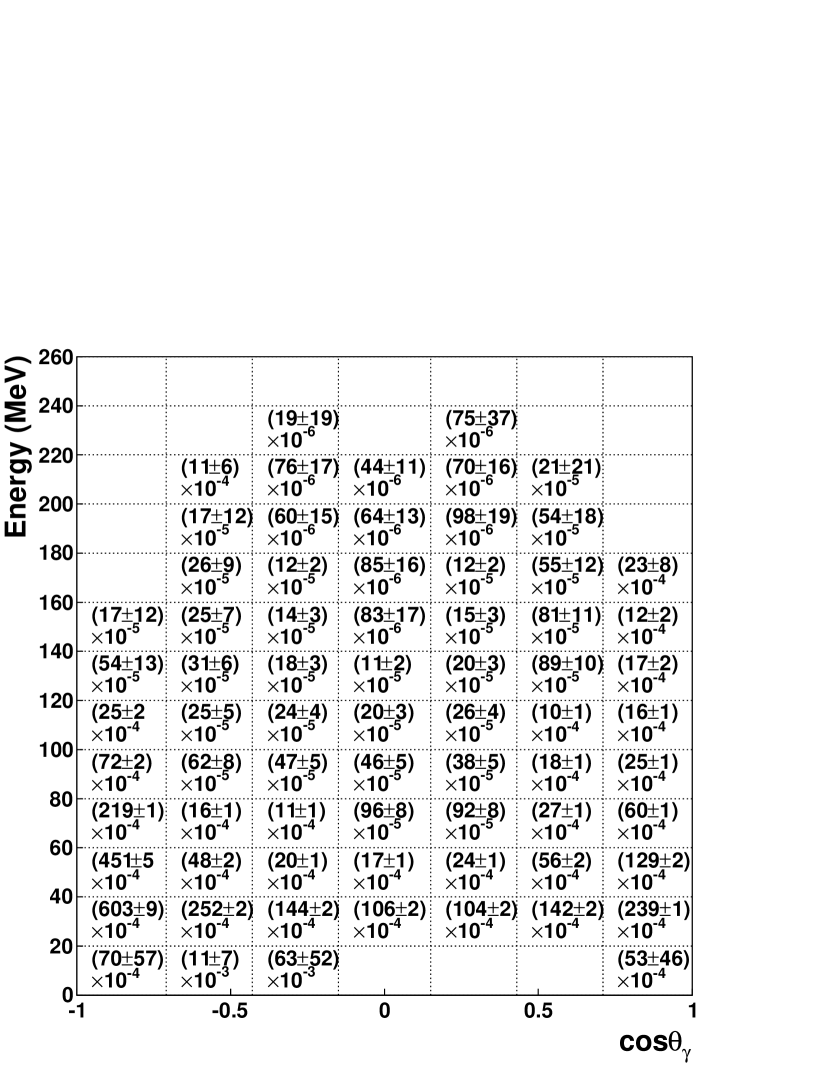
The angle between the outgoing photon and beam directions (-axis) is .
To use this table we simulated the direction and energy distributions from decay. The SPI table includes both online and offline photon veto requirements and we cannot use it if the muon and the photon hit the same stopping hextant because the range stack photon veto was not applied in this case. A photon was rejected if it hits any of the photon veto detectors with a detected energy more than 1 MeV (offline PV threshold). The true threshold for the photon energy should be lower than this because of the contamination due to detector activity or electronic noise. The photon acceptance was measured to be , where the estimated uncertainty is determined by scanning the energy threshold in the MC from 0 to 1 MeV.
References
- Hirata et al. (1989) K. Hirata et al. (Kamiokande-II Collaboration), Phys. Rev. Lett. 63, 16 (1989).
- Anselmann et al. (1992) P. Anselmann et al. (GALLEX Collaboration), Phys. Lett. B285, 376 (1992).
- Abdurashitov et al. (1994) D. Abdurashitov et al. (SAGE Collaboration), Phys. Lett. B328, 234 (1994).
- Fukuda et al. (1996) Y. Fukuda et al. (Kamiokande Collaboration), Phys. Rev. Lett. 77, 1683 (1996).
- Fukuda et al. (1998a) Y. Fukuda et al. (Super-Kamiokande Collaboration), Phys. Rev. Lett. 81, 1158 (1998a).
- Ahmad et al. (2001) Q. Ahmad et al. (SNO Collaboration), Phys. Rev. Lett. 87, 071301 (2001).
- Bellini et al. (2012) G. Bellini et al. (Borexino Collaboration), Phys. Rev. Lett. 108, 051302 (2012).
- Fukuda et al. (1998b) Y. Fukuda et al. (Super-Kamiokande Collaboration), Phys. Rev. Lett. 81, 1562 (1998b).
- Eguchi et al. (2003) K. Eguchi et al. (KamLAND Collaboration), Phys. Rev. Lett. 90, 021802 (2003).
- Ahn et al. (2006) M. Ahn et al. (K2K Collaboration), Phys. Rev. D74, 072003 (2006).
- Adamson et al. (2008) P. Adamson et al. (MINOS Collaboration), Phys. Rev. Lett. 101, 131802 (2008).
- Abe et al. (2011) K. Abe et al. (T2K Collaboration), Phys. Rev. Lett. 107, 041801 (2011).
- Adamson et al. (2011) P. Adamson et al. (MINOS Collaboration), Phys. Rev. Lett. 107, 181802 (2011).
- Abe et al. (2012) Y. Abe et al. (DOUBLE-CHOOZ Collaboration), Phys. Rev. Lett. 108, 131801 (2012).
- An et al. (2012) F. An et al. (DAYA-BAY Collaboration), Phys. Rev. Lett. 108, 171803 (2012).
- Ahn et al. (2012) J. Ahn et al. (RENO collaboration), Phys. Rev. Lett. 108, 191802 (2012).
- Asaka and Shaposhnikov (2005) T. Asaka and M. Shaposhnikov, Phys. Lett. B620, 17 (2005).
- Asaka et al. (2005) T. Asaka, S. Blanchet, and M. Shaposhnikov, Phys. Lett. B631, 151 (2005).
- Shrock (1981) R. E. Shrock, Phys. Rev. D24, 1232 (1981).
- Asano et al. (1981) Y. Asano et al., Phys. Lett. B104, 84 (1981).
- Hayano et al. (1982) R. S. Hayano et al., Phys. Rev. Lett. 49, 1305 (1982).
- Yamazaki et al. (1984) T. Yamazaki et al., in Proceedings of Neutrino 84, Dortmund (1984).
- Daum et al. (2000) M. Daum et al., Phys. Rev. Lett 85, 1815 (2000).
- Aoki et al. (2011) M. Aoki et al. (PIENU Collaboration), Phys. Rev. D84, 052002 (2011).
- Bernardi et al. (1988) G. Bernardi et al., Phys. Lett. B203, 332 (1988).
- Badier et al. (1986) J. Badier et al. (NA3 Collaboration), Z. Phys. C31, 21 (1986).
- Cooper-Sarkar et al. (1985) A. M. Cooper-Sarkar et al. (WA66 Collaboration), Phys. Lett. B160, 207 (1985).
- Gallas et al. (1995) E. Gallas et al. (FMMF Collaboration), Phys. Rev. D52, 6 (1995).
- Vaitaitis et al. (1999) A. Vaitaitis et al. (NuTeV Collaboration, E815 Collaboration), Phys. Rev. Lett. 83, 4943 (1999).
- Abreu et al. (1997) P. Abreu et al. (DELPHI Collaboration), Z. Phys. C74, 57 (1997).
- Adriani et al. (1992) O. Adriani et al. (L3 Collaboration), Phys. Lett. B295, 371 (1992).
- Vilain et al. (1995) P. Vilain et al. (CHARM II Collaboration), Phys. Lett. B343, 453 (1995).
- Atre et al. (2009) A. Atre, T. Han, S. Pascoli, and B. Zhang, JHEP 0905, 030 (2009).
- Gorbunov and Shaposhnikov (2007) D. Gorbunov and M. Shaposhnikov, JHEP 0710, 015 (2007).
- Boyarsky et al. (2009) A. Boyarsky, O. Ruchayskiy, and M. Shaposhnikov, Ann. Rev. Nucl. Part. Sci. 59, 191 (2009).
- Artamonov et al. (2009) A. V. Artamonov et al. (BNL-E949 Collaboration), Phys. Rev. D79, 092004 (2009).
- Note (1) This is slightly less than stopped kaons used for the E949 analysis Artamonov et al. (2009).
- Nelson et al. (1985) W. Nelson et al., SLAC Report No.265 , SLAC (1985).
- Adler et al. (2008) S. Adler et al. (E949 Collaboration, E787 Collaboration), Phys. Rev. D77, 052003 (2008).
- Mizouchi (2006) K. Mizouchi, Experimental search for the decay , Ph.D. thesis, Graduate School of Science, Kyoto University (2006).
- Olive et al. (2014) K. A. Olive et al. (Particle Data Group), Chin. Phys. C38, 090001 (2014).
- Cowan et al. (2011) G. Cowan, K. Cranner, E. Gross, and O. Vitells, Eur. Phys. J. C71, 1554 (2011).
- Feldman and Cousins (1998) G. J. Feldman and R. D. Cousins, Phys.Rev. D57, 3873 (1998).