Si3N4 nanobeam optomechanical crystals
Abstract
The development of nanobeam optomechanical crystals is reviewed. These structures consist of a 350 nm thick, 700 nm wide doubly-clamped nanobeam that is periodically patterned with an array of air holes to which a defect region is introduced. The periodic patterning simultaneously creates a photonic bandgap for 980 nm band photons and a phononic bandgap for 4 GHz phonons, with the defect region serving to co-localize optical and mechanical modes within their respective bandgaps. These optical and mechanical modes interact dispersively with a coupling rate 100 kHz, which describes the shift in cavity mode optical frequency due to the zero-point motion of the mechanical mode. Optical sidebands generated by interaction with the mechanical mode lie outside of the optical cavity linewidth, enabling possible use of this system in applications requiring sideband-resolved operation. Along with a review of the basic device design, fabrication, and measurement procedures, we present new results on improved optical quality factors (up to ) through optimized lithography, measurements of devices after HF acid surface treatment, and temperature dependent measurements of mechanical damping between 6 K and 300 K. A frequency-mechanical quality factor product as high as Hz is measured.
I Introduction
Cavity optomechanical systems are being developed for a wide variety of purposes, including applications in sensing and metrology [1, 2, 3, 4, 5, 6], signal transduction and wavelength conversion using the radiation pressure coupling between optics and mechanics [7, 8, 9, 10, 11, 12], and the generation of non-classical states of light [13, 14, 15]. Milestone experimental demonstrations of ground state cooling [16, 17], parametrically-driven normal mode splitting [18, 19], and coherent energy transfer between the optical and mechanical domains [20, 21] have inspired numerous theoretical proposals that use coupled photons and phonons for applications in areas such as quantum information science [22, 23, 24, 25, 26].
The optomechanical crystal platform developed by Painter and colleagues [27, 28] seeks to combine localized and interacting photons and phonons in a cavity optomechanical system with propagating photons and phonons in bus waveguides that route signals on the chip [29]. Both one-dimensional [27, 30, 17] and two-dimensional [31, 32] systems have been developed in silicon-on-insulator, with demonstrations of a large optomechanical coupling strength MHz (which corresponds to the frequency shift of the optical mode due to the zero point motion of the mechanical mode) [33], high optical quality factor , and high mechanical quality factor at 10 K [33] and at 300 mK [34]. The availability of mature planar silicon fabrication technology also enables, among other things, potential electrostatic integration for biasing, readout, and control of the devices.
Despite the many advantages of working in silicon-on-insulator, there are good reasons to investigate optomechanical crystals in other material systems. For example, two-photon absorption in silicon at 1550 nm [35] and the accompanying generation of free carriers ultimately limits the number of photons that can be injected into a silicon optomechanical resonator without degrading its optical quality factor, mechanical quality factor, or both. For example, in Ref. [17], two-photon absorption effects are observed at an intracavity photon population of a few hundred photons, which limits how low a phonon occupancy can be achieved in laser cooling experiments. Incorporation of a p-n junction to sweep out free carriers [36] and operation at wavelengths above 2000 nm [37, 38] have been used to mitigate two-photon absorption and free-carrier generation effects in lasing and nonlinear optics applications, but these non-trivial steps have not yet been demonstrated in the context of cavity optomechanics. Operation in silicon also restricts the range of available wavelengths over which the optomechanical system may operate to the near-infrared region nm. Access to shorter wavelengths may be important in a number of scenarios, including stabilization of cavity optomechanical systems to the transitions of alkali atoms and interfacing cavity optomechanical devices with quantum optical systems based on semiconductor quantum dots, defect color centers in crystals, and trapped ions and atoms.
With that motivation, we have recently investigated one-dimensional optomechanical crystals in stoichiometric silicon nitride () [39] (Fig. 1), demonstrating sideband-resolved devices in which the mechanical mode frequency exceeds the cavity mode optical linewidth , and observing phenomena that take advantage of the ability of the optical cavity to preferentially select one optical sideband scattered by the mechanical resonator, such as optomechanically-mediated electromagnetically induced transparency [40, 30]. In the first part of this paper, we review these recent results and provide additional experimental details not present in our earlier work. We then describe new device fabrication and measurements aimed at further exploring the potential of these devices. In particular, we describe improvements to the fabrication process (in particular, electron beam lithography) that have increased the optical quality factor of the devices by a factor of 4 (up to ). We also discuss the use of weak HF acid etching, meant to remove a thin surface layer of material that may be damaged from the plasma dry etching process used to pattern the nanobeams, as a means to improve device performance. Finally, we present temperature-dependent measurements of mechanical damping of the GHz breathing mode between 6 K and 300 K.
II Overview
II-A Relationship to Other Cavity Optomechanical Systems
Silicon nitride has been used by many researchers to demonstrate high quality factor mechanical resonators () in membrane [41] and doubly-clamped beam geometries [42], with frequencies ranging from hundreds of kHz to tens of MHz. Typically researchers use stoichiometric grown by low-pressure chemical-vapor deposition, though low-stress, non-stoichiometric SiN has also been used. Si3N4 resonators have been used in many cavity optomechanics experiments; for example, the membranes have been used as a dispersive element within a Fabry-Perot cavity [43, 15, 44]. Within integrated on-chip geometries, researchers have developed cavity optomechanical systems using nanobeams evanescently coupled to whispering gallery mode cavities [45] and acting as parts of on-chip interferometers [46]. has also been used in double microdisk geometries, where the optical modes supported by vertically-coupled microdisks are coupled to the out-of-plane flapping motion of the two disks [47]. Similarly, laterally-coupled photonic crystal nanobeam cavities in have been demonstrated, where the optical mode supported by these beams is coupled to the antisymmetric in-plane mechanical motion of the beams [48, 5]. Optomechanical oscillators based on whispering-gallery-mode resonators and operating at 50 MHz mechanical resonant frequencies have also recently been demonstrated [49, 50].
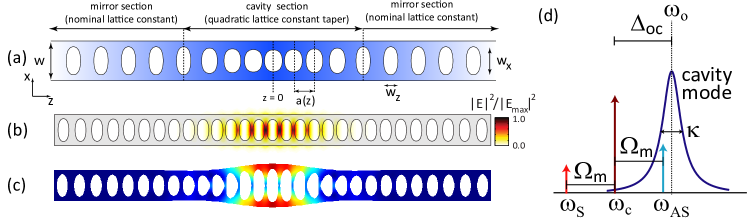
When an optical field is directed onto a mechanical resonator, its motion creates high- and low-frequency sidebands around the optical field frequency due to the Doppler effect (this is essentially the same process as Raman scattering). In a cavity optomechanical system, the optical cavity has an associated density of electromagnetic states, and depending on the detuning of the probe laser, the optical cavity can preferentially enhance and select the creation of one sideband with respect to the other. The degree of asymmetry is determined by the width of the optical cavity mode () compared to the frequency of the mechanical resonator (), as the generated sidebands are separated from the input optical beam by (Fig. 1(d)). Systems for which are said to be sideband-resolved [51], an important criterion for applications such as laser cooling, where the level of sideband resolution sets an ultimate limit on the achievable phonon occupancy of the mechanical resonator [52, 53]. The chip-based systems discussed above are not in the sideband-resolved regime, limiting their potential in such applications.
The nanobeam optomechanical crystals first presented in Ref. [39] and developed further here are distinguished by operating in the sideband-resolved regime (Fig. 1). This is primarily accomplished through the use of highly localized mechanical modes whose frequencies are in the GHz range (2-3 orders of magnitude larger than the mechanical frequencies of the devices referenced above), exceeding optical cavity loss rates that are usually in the hundreds of MHz range. We note that even in state-of-the-art nanophotonic devices, optical quality factors are typically in the range (100 MHz) [54, 55, 56], though higher values of [57] and [58] have recently been achieved. These recent demonstrations have come at the expense of optical field confinement; in the former, 240 µm radius microrings with a 400 nm layer were studied, while in the latter, a thin layer of 40 nm is used to create a delocalized optical mode that primarily sits in the surrounding SiO2, restricting ring radii to several mm. On the other hand, small diameter (10 µm) microdisks have recently been demonstrated and used in cavity optomechanical wavelength conversion experiments [9], where sideband-resolved operation was achieved with a 625 MHz mechanical mode, exceeding the cavity mode optical linewidth 150 MHz. However, the optomechanical coupling rate in that system is more than one order of magnitude smaller than the rate in the nanobeam optomechanical crystals described below.
II-B Optomechanical Design
This section contains a brief outline of the design process for optomechanical crystal cavities. Further details are given elsewhere [59, 39]. The optomechanical crystal (OMC) consists of a suspended nanobeam of thickness and width , with an etched array of elliptical holes as illustrated in Fig. 1(a). In the outer mirror sections, the spacing between the holes is constant, while within the cavity section, it varies quadratically from the center outwards. The cavity section forms a defect in an otherwise perfect 1D photonic bandgap structure, where the optical field can be longitudinally confined (along the axis). Longitudinal optical confinement is achieved when frequencies allowed to propagate along in the cavity section fall within the photonic bandgap of the mirror sections. Simultaneously with a photonic bandgap, the 1D photonic crystal structure forming the mirrors also provides a bandgap for mechanical waves—a phononic bandgap—such that the defect in the cavity region can also support localized mechanical resonances [27]. The optomechanical crystal design process consists of creating an appropriate modulated array of holes that maximizes the radiation-pressure interaction between the localized optical and mechanical resonances, by maximizing the spatial overlap between the two; further requirements are that the optical and mechanical quality factors be maximized.
The design procedure starts with a consideration of the optical resonances. Photonic bandgaps can be calculated with a variety of methods; in our case, the plane-wave expansion method was used. The lattice spacing at the cavity center is initially chosen such that a specific target wavelength is allowed to propagate, at the very edge of the photonic bandgap. The lattice spacing is then allowed to vary from the value at the center, so that the target frequency falls within the bandgap of the crystal in the mirror sections. The lattice spacing variation must be carefully chosen in order to minimize coupling to free-space radiation, so that high optical quality factors () can be achieved [60, 39]. The modulated hole array can be regarded as a 1D distributed feedback mirror with a variable mirror strength. Linear mirror strength profiles have been shown to produce optical modes with reduced spatial harmonics above the light line, which leads to reduced power leakage into the air—and thus higher quality factors [60, 61]. This procedure has been used to produce theoretical at various wavelengths (in the present work, near 980 nm).
As discussed above, the photonic bandgap structure also acts as a phononic bandgap structure. In particular, photonic crystal cavities optimized with the procedure above already display confined mechanical resonances that are co-located with the optical mode, but with sub-optimal spatial overlap, and thus lower optomechanical interaction strength. The optomechanical interaction strength is quantified by the optomechanical coupling rate , which is the coupling rate between single photons and phonons in the cavity. This parameter can be calculated with a perturbative expression involving an overlap integral between the optical and mechanical displacement fields [27, 59]. Optical and mechanical cavity modes can be calculated using a variety of computational methods; in our case, the finite element method was used.
In order to optimize the localization of the mechanical resonance, the aspect ratio of the lattice holes is allowed to vary along the nanobeam, with constant . For sufficiently small aspect ratio excursions, the optical modes are only perturbatively affected, and optical s are not significantly degraded. At this point, a nonlinear search routine can be applied to maximize the optomechanical coupling rate and optical quality factor through small adjustments to both the lattice constant and hole aspect ratio profiles along the nanobeam. Figs. 1(b) and (c) show the co-localized, confined optical and breathing mechanical modes resulting from one such optimization process, for a nanobeam OMC. The optical mode is at a nm wavelength and has . The breathing mechanical mode is such that the nanobeam sidewalls expand and contract laterally (in the axis) in a breathing fashion, with a frequency of GHz.
We point out that in this work, contributions from stress-induced changes of the refractive index (photoelastic effect) were not considered in the optimization process. This contribution has been shown to be significant in crystalline silicon [33, 62] and GaAs [63] nanostructures, for which the photoelastic tensor has been measured [64, 65]. However, we have not found analogous measurements for the photoelastic tensor in .
II-C Optomechanical Spectroscopy
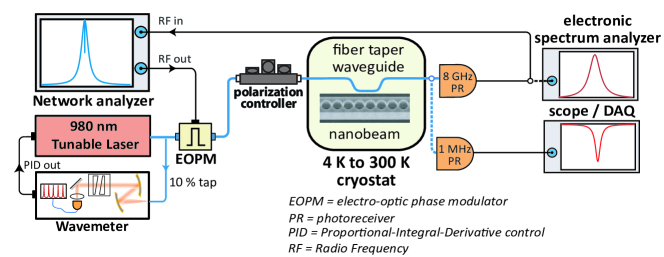
The experimental setup used to measure the nanobeam optomechanical crystals is shown in Fig. 2, and was previously described in [39, 9]. Light from a 980 nm external cavity tunable diode laser is coupled in and out of the devices using an optical fiber taper waveguide (FTW) with a diameter of 1 µm. The fiber taper is typically positioned several hundred nanometers to the side of the nanobeam, to limit parasitic loading of the optical cavity. Optical cavity mode spectroscopy is performed by sweeping the laser wavelength and detecting the transmitted signal through the fiber taper on a 1 MHz photoreceiver, with the laser sweep span calibrated by a wavemeter. Mechanical mode spectroscopy is performed by fixing the laser wavelength on the side of the optical cavity mode and sending the transmitted signal to a high-bandwidth (8 GHz) photoreceiver, the output of which is sent to a real-time electronic spectrum analyzer. The use of high-bandwidth, low-noise photoreceivers in direct detection is essential due to the lack of low-noise optical amplifiers at 980 nm, in contrast to the 1550 nm band where near quantum-limited erbium-doped fiber amplifers (EDFAs) are readily available. For example, typical 10 GHz photoreceivers have a noise equivalent power pW/, so that at a frequency of 4 GHz, the expected noise power is µW (techniques to downshift a detected photocurrent to lower frequencies may reduce the expected noise power). The typical thermal noise motional amplitude for one of our devices ( fm at 293 K) yields an optical cavity mode frequency shift , where fm is the zero-point motional amplitude, is the optical mode frequency, and has been assumed. The frequency modulation induced by the mechanical motion is transduced by the optical cavity into a fluctuating intensity, which for the same will yield an intensity modulation that is less than 1 of the input optical power. This value must be larger than the expected noise power to yield a signal-to-noise level greater than unity in the mechanical mode spectroscopy. Alternately, homodyne detection [66] can be used to increase signal levels above the detector noise floor.
Cryogenic measurements of nanophotonic devices using optical FTWs have previously been performed in systems such as a continuous-flow, liquid He-4 cryostat with the sample in vacuum [67, 17, 9] and a He-4 exchange gas cryostat [68]. Here, we use a system similar to that in [67], where low-temperature-compatible, piezo slip-stick positioners provide sample motion in the directions, a piezo slip-stick positioner provides adjustment of the out-of-plane angle of the fiber taper waveguide with respect to the sample, and a piezo flexure stage provides fine translation of the fiber taper in the directions. A significant difference in the current setup is that cooling is provided in a closed-cycle fashion through a He compressor and Gifford-McMahon cryocooler. Improved thermal links with respect to those used in Ref. [67] enable both the sample and fiber taper temperature to reach 4.2 K, as measured by calibrated Si diodes mounted in adapter plates directly underneath the sample and fiber.
II-D Optomechanical Sideband Spectroscopy
One phenomenon observable in sideband-resolved devices is the optomechanical analog to electromagnetically induced transparency (EIT) and absorption (EIA) [40, 30, 69]. Here, the presence of a strong control field, appropriately detuned from the optical cavity, influences the transmission spectrum of a weak probe field swept in frequency across the optical mode. It results from the interference of probe photons with photons from the control laser that are scattered by the mechanical resonator. Such interference requires the probe photons and scattered photons to be phase coherent, which effectively shows that the optical field and mechanical mode can interact coherently. The interference can be constructive or destructive, depending on which sideband photons interfere with the probe.
In particular, pumping the optical cavity with a red-detuned control beam creates a situation in which destructive interference takes place, leading to the observation of EIT. The EIT signal is a manifestation of a process in which an injected optical signal resonant with the cavity is converted into coherent mechanical motion, then reconverted into the optical domain, and so forth in a cycle [30, 40]. This photon-phonon translation scheme [29], occurs at a rate given by the pump-enhanced optomechanical coupling rate , where is the number of control beam photons injected into the cavity; thus can be controlled via the control beam power. A number of optical signal processing functions have been proposed [29] and implemented [30, 7, 9] based on the photon-phonon translation (PPT) concept. Central to PPT is the optomechanical cooperativity parameter, , essentially the ratio of the rate at which optical and mechanical energy are coherently exchanged (represented by the pump-enhanced optomechanical coupling rate ) over the loss rates of the mechanical and optical resonances ( and , respectively). Generally, is desired, meaning that optomechanical transduction happens at a considerably faster rate than energy is lost by the system.
Apart from demonstrating a manifestation of coherent interaction between the optical and mechanical degrees of freedom, EIT measurements allow the estimation of important system parameters, particularly relating to the photon-phonon translation process. The cooperativity can be directly obtained independently of the knowledge of the intracavity photon population or the vacuum optomechanical coupling . In addition, the intrinsic mechanical and total optical linewidths can be obtained independently from the optical and mechanical spectroscopic methods described in Sec. II-C above. This capability can be very useful in situations where the apparent optical and mechanical linewidths are modified by the control beam, as discussed below.
In the EIT measurement setup, shown in Fig. 2, light from the 980 nm tunable laser corresponds to the control field, and a probe signal is derived from it by modulation with an electro-optic phase modulator (EOPM). This produces out-of-phase blue and red sidebands at frequencies away from the control beam frequency . As shown Fig. 2, the EOPM is driven by port 1 of a vector network analyzer (VNA), so that the probe-control beam detuning can be swept. For small phase modulation index , the optical signal fed into the FTW can be represented by
| (1) |
After the cavity, which has a transmission transfer function , this becomes
| (2) |
This signal is then detected, yielding a photocurrent proportional to . The photocurrent component oscillating at is
| (3) |
where ( is the phase of ). This can be expanded into an in-phase () and a quadrature () component, , with
| (4) |
and
| (5) |
The parameter displayed by the VNA is such that and . In practice, the sidebands acquire a relative phase while propagating down the fiber sections from the modulator to the cavity, and then from the cavity to the detector. To take that into account, we substitute , and use as a fit parameter. In an ideal situation in which a phase modulator is used and no relative phase is acquired in the fiber, then , so that the two sidebands are out-of-phase.
For a red-detuned control field, the optomechanical cavity transmission coefficient , as a function of the control-probe detuning is given by
| (6) |
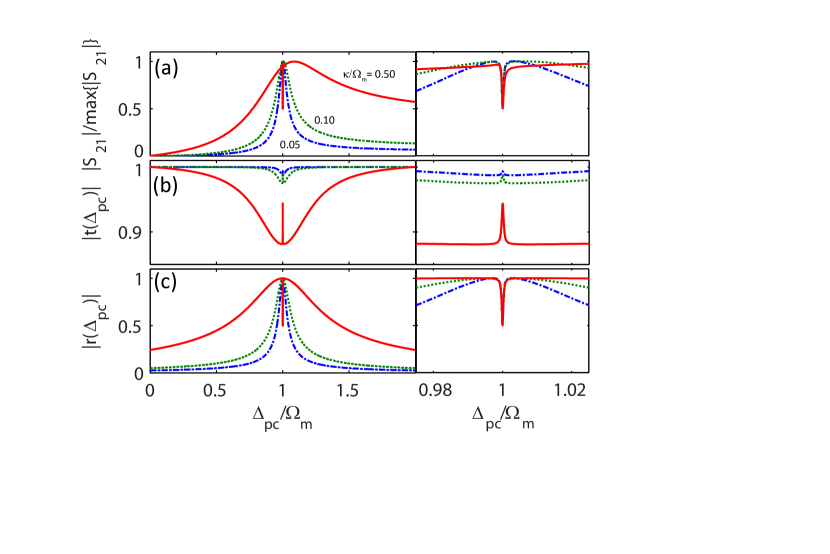
where is the fiber-cavity coupling rate, is the optical cavity decay rate, the cavity-control beam detuning, the mechanical frequency, the intrinsic mechanical damping and the pump-enhanced optomechanical coupling, with the intracavity photon number. The cavity transmission spectrum in eq. (6) can be plugged into eqs. (4) and (5) to give the expected VNA parameter (scaled by a constant factor), which can be used for fitting experimental data. Fig. 3(a) shows an example obtained for an optomechanical cavity with , , , , and . Figs. 3(b) and (c) show the amplitude of the corresponding cavity transmission and reflection coefficients. Panels to the right show a blow-up of the corresponding graphs in the vicinity of the EIT dip.
We note that both and in eqs. (4) and (5) combine contributions from both sidebands of the modulated signal, for the Stokes and Anti-Stokes, respectively. For sufficient sideband resolution, for red sideband detuning. In this case, for (corresponding, as above, to phase modulation and no relative phase gain through the fibers), it can be shown that approximates , where is the cavity reflectivity coefficient. This is apparent in a comparison between in Fig. 3(a) and the corresponding reflection coefficients in Fig. 3(c), for varying levels of sideband resolution : for a less well-resolved cavity (large ), the becomes increasingly more skewed with respect to .
While some of the fitting parameters can be obtained independently from other measurements, we note that in certain situations, extraction with the VNA method can be advantageous, for practical reasons. The optical cavity external and total losses and can be obtained from a power transmission spectrum , obtained by scanning the laser wavelength across the cavity and fitting with eq. (6) with (note that in these measurements, the scanned laser acts as a signal, not as a control for the optomechanical interaction). The total loss rate incorporates both the external coupling rate and intrinsic (absorption and parasitic) losses: . and are connected by the transmission at cavity center , . If the cavity displays significant nonlinear absorption, it is expected that will change with the injected control beam power, and so extracting by using it as a fit parameter in eq. (6) could be useful in these conditions. Likewise, the intrinsic mechanical linewidth can be obtained from the mechanical thermal motion spectrum. In practice, however, it is often difficult to measure such spectra with sufficient signal-to-noise ratio with a low-power control beam. Particularly in sideband-resolved systems, the control beam power needs to be sufficiently low that dynamic back-action effects do not significantly modify the observed mechanical frequency and linewidth from their intrinsic values (at telecom wavelengths, this issue can be circumvented by amplifying the signal with an Erbium-doped fiber amplifier before detection). If such condition cannot be achieved unambiguously, therefore, extracting by using it as a fit parameter for the VNA data can be a viable option.
III Fabrication and Improved Optical Performance
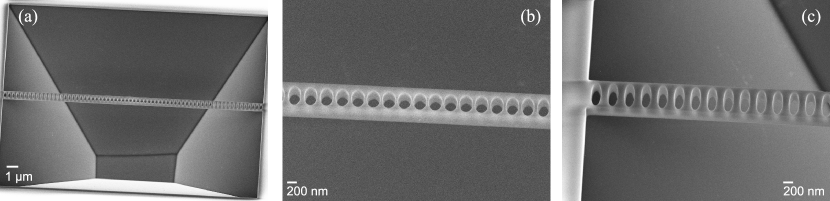
Optomechanical crystal nanobeams were fabricated in 350 nm thick stoichiometric Si3N4 deposited via low-pressure chemical-vapor deposition on a plain Si substrate (tensile stress 800 MPa). An array of device designs was patterned via electron-beam (E-beam) lithography in positive E-beam resist and developed in hexyl acetate. The Si3N4 was etched by a CF4/CHF3 (4:1) reactive ion etch at 1.33 Pa chamber pressure. This etch recipe produces sidewall angles within 3∘ of vertical, as measured in cross-sections under a scanning-electron microscope (SEM). According to finite element method simulations of the optical mode, this sidewall angle should have a minimal effect on device performance. After the etch and removal of the E-beam resist, the devices were released in KOH at C for about 15 min followed by a 5 min dip in 1:4 H2O:HCl to remove precipitated residue from the KOH release. The nanobeams were robust enough that they could be simply N2 blow-dried. SEM images of an example device are shown in Fig. 4.
III-A Development
The multitude of surfaces in an OMC makes it important that the sidewalls be smooth in order to minimize optical scattering loss. One source of sidewall roughness is the line edge roughness in the lithography. Previous works have observed that the temperature of the development step for E-beam resists strongly affects the line edge roughness of E-beam patterns, as observed under SEM [70, 71].
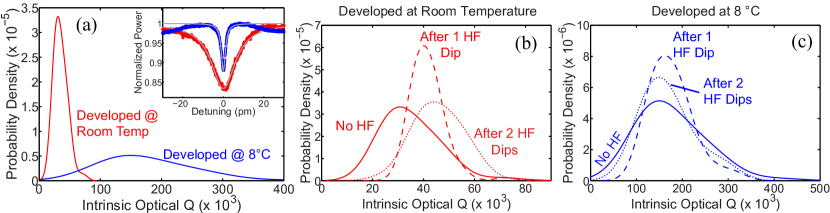
Here we quantify the difference between cold- and room-temperature-developed E-beam resist by measuring the optical . We exposed several sets of the same device designs and dosages, but developed one set at room temperature and the other set at C. For the room-temperature developed sample, the highest measured loaded was , corresponding to an intrinsic of . (The OMCs demonstrated in Ref. [39] were fabricated via a similar process, resulting in s as high as , with the average s around .) The highest measured loaded in the cold-developed sample was , which corresponds to an intrinsic of (Fig. 5(a) inset). s are determined by a nonlinear least squares fit of the data. The uncertainties are given by the confidence intervals of the fit.
An estimated probability density function based on all the measured s and weighted by their uncertainties is shown in Fig. 5(a). Essentially, these functions are constructed by summing normal distributions centered at the optical of each of the devices, where the distribution variance of each is the uncertainty in . The resulting summed function is then smoothed and normalized such that its integral is one. For the room-temperature-developed sample, the optical s are tightly clustered around , while the s of the cold-developed sample are more broadly distributed, centered around . The tight clustering and lower of the room-temperature-developed devices suggests they are all limited by the same upper bound on the optical , likely surface roughness, whereas the wide distribution of the cold-developed sample suggests that the optical is not dominated by the same factor for all devices; the variation is likely due to the variation in the exposed optomechanical crystal design.
III-B Surface Treatment
In addition to sidewall roughness, it is possible that surface absorption plays a significant role in the optical loss. In LPCVD Si3N4, oxygen and carbon surface contamination is very common [72]. To test the significance of surface absorption, we etched the released nanobeams in 50:1 HF for 2 min, removing about 1 nm of material from all surfaces, as determined by ellipsometric measurements of Si3N4 film thickness as a function of etch time when exposed to 50:1 HF. We then characterized the subsequent optical performance of the optomechanical crystals. The optical resonant wavelength decreased by around 3 nm to 4 nm after each HF dip. An estimated probability density function of the intrinsic s before and after one and two HF dips is shown in Fig. 5(b) and (c). In the room-temperature developed devices, the most probable intrinsic increases by less than a factor of two after two HF dips, while the cold-developed devices stay about the same. It is likely that the HF treatments somewhat reduced the surface roughness in the room-temperature-developed samples, while, in the smoother cold-developed samples, the dominant effect was changing the photonic crystal dimensions.
Thus, the dilute HF etching shown here does not appreciably modify the of cold-developed samples, indicating that either surface absorption is not a dominant loss mechanism for these devices, or that the absorbing layer has not been effectively removed in this process. We did see some improvement in for room-temperature developed samples, which is consistent with an improvement in surface roughness. For longer dip times or stronger HF concentrations, the HF dip should be taken into consideration when designing the cavity geometry.
In a couple of devices, we also characterized the optical resonance wavelength change with respect to input power with the coupling distance fixed. This type of measurement indicates any non-linear optical absorption and can be used to determine the linear absorption of a material [73]. Non-linear absorption would result in a change in the extinction ratio with respect to the optical power in the cavity. Both before and after HF treatment, the extinction ratio varied less than 1 and with no discernible trend for resonant wavelength changes of up to 10 pm. This small variation indicates insignificant levels of non-linear absorption in the Si3N4 film.
Because surface effects can also degrade mechanical quality factors, we also tested the effectiveness of the HF treatment for improving . We measured the mechanical quality factor of the approximately 3.8 GHz breathing mode with low input optical power to minimize the effects of dynamical backaction. There was no significant change in as a result of HF treatment in the devices we measured, implying that either surface loss is insignificant in the breathing mode or dipping in HF does not effectively remove mechanical surface loss mechanisms.
IV Temperature-Dependent Measurements
There have been several demonstrations of mechanical damping decreasing as temperature decreases in Si3N4 flexural modes (mechanical frequencies less than 1 GHz) [41, 74, 75, 76]. These works point to two-level systems and atomic tunneling in glasses as limits on the mechanical , but it is not clear how the significance of these effects would change for a high-frequency bulk mode, like the breathing mode of our optomechanical crystals. The breathing mode (around 3.6 GHz) of crystalline Si optomechanical nanobeams has been measured at low temperatures, with a mechanical on the order of measured at 10 K [33], and a mechanical inferred to be at 10 mK [34]. Thus, there is some indication that very high mechanical s in breathing modes can be achieved at low temperatures.
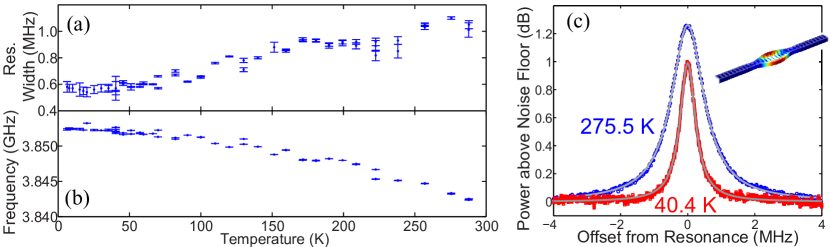
To characterize the significance of temperature in the mechanical performance of our Si3N4 optomechanical crystals, we measured the mechanical of an optomechanical crystal from 6 K to room temperature in a temperature-controlled, closed-cycle, Gifford-McMahon cryostat. The mechanical modes of the nanobeam were detected as described in Sec. II-C. The optical power was kept low to minimize the effects of dynamical back-action on the mechanical linewidth. In this device, the first-order breathing mode (Fig. 6(c) inset) had a mechanical frequency of about 3.8 GHz. The linewidth change with respect to temperature is shown in Fig. 6. The linewidth at room temperature was 1.05 MHz MHz, corresponding to a of . The quality factor increased as the temperature decreased, leveling out at about 70 K, at which point the linewidth was 0.58 MHz MHz . s are extracted from a nonlinear least squares fit of the data. The uncertainties are given by the confidence intervals of the fit.
This reduction in damping by almost half is comparable to the magnitude of improvement in the flexural modes of Ref. [75], but we do not see the same two-level-system dissipation peak around 50 K. We do see some indication of a similar, small dissipation peak around 170 K, which could be the result of a thermally-activated relaxation due to hydrogen defects in the Si3N4. Other factors that might be limiting include clamping loss due to incomplete mode confinement in the fabricated optomechanical crystal and localized defect states [77]. Thermoelastic damping and Akhieser losses are likely not the dominant factors limiting , as the simulated and calculated [78] limits due to these effects are at least an order of magnitude greater than the measured mechanical s. As of yet, more study is required to determine how to mitigate the remaining mechanical loss mechanisms, but the product that our OMC achieves at temperatures less than 50 K ( Hz) is on par with the highest previously demonstrated in Si3N4 mechanical resonators [79, 80]. Interestingly, these previous demonstrations were in very different geometries (e.g., MHz frequency membrane modes). Perhaps more importantly, this product is relevant in the context of understanding how decoupled the mechanical mode of interest can be from the thermal environment it is contacting [1]. The rate at which thermal phonons can be coupled into the mechanical resonator is given by , where is the number of thermal phonons at the mode frequency for a temperature , and is Boltzmann’s constant. The quantity thus represents the number of coherent oscillations that can take place before this thermal decoherence sets in, and is for our devices. This environmental decoupling would be of particular importance if these systems can be cooled to the quantum ground state.
V EIT Measurements at Cryogenic Temperatures
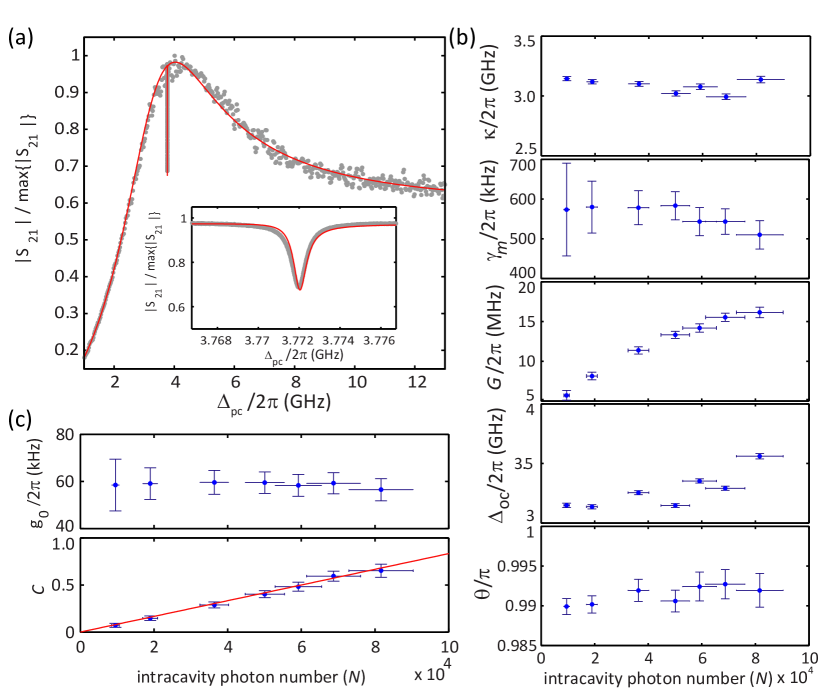
Fig. 7(a) shows representative experimental VNA data for a nanobeam OMC tested at 30 K (grey dots) under red-detuned pumping, together with a fitted curved obtained using , , , and as parameters. The experimental data displays a narrow EIT dip at GHz, shown in the inset. In order to correct for the frequency response of the photoreceiver, the raw was normalized by a background signal taken with a far-detuned pump with polarization tuned to maximize amplitude modulation at the electro-optic phase modulator. Because the optical cavity linewidth is wide compared to the photoreceiver bandwidth, this normalization procedure is important and must be done with care in order for fits to be properly done. It is apparent that the cavity model is able to describe the data well over the entire displayed frequency range, including the narrow range around the EIT dip (inset). In this fit, the ratio was obtained from a fit to the cavity transmission spectrum, so that was not a fit parameter to the data. In addition, the mechanical frequency was taken at the minimum of the EIT dip. The fit procedure was repeated for varying red-detuned pumps at various powers, and the extracted cavity parameters are shown in Fig. 7(b) as a function of the intracavity photon number . The error bars correspond to fit confidence intervals, and are due to noise in the experimental data. is calculated with the expression
| (7) |
using parameters from the and transmission spectrum fits. Here, ( is Planck’s constant), is the FTW coupling efficiency, is the depth of the optical resonance in the transmission spectrum, the intrinsic optical , and is the optical power at the FTW input. The intrinsic was obtained as . Within our error bars, the intrinsic optical and mechanical damping rates are constant with pump power, and the phase between the sidebands is very close to . The average mechanical linewidth is such that the mechanical quality factor at 30 K extracted here is approximately 2 that at room temperature, consistent with the data from Sec. IV. The scatter in reflects the manual selection of the control beam-cavity detuning at each pump power tested. The pump-enhanced optomechanical coupling follows the expected shape, which is reflected in the linear trend observed for the cooperativity shown in Fig. 7(c). The cooperativity here is approximately twice that observed in [39], likely due to the smaller and , and despite the lower optomechanical coupling rate , also shown in Fig. 7(c). We note that can be difficult to accurately measure as it relies upon good knowledge of the pump-cavity detuning and all optical losses in this system. For this reason, other methods to assess that are independent of [81] may be preferable, and could be used together with extracted cooperativity values to determine the intracavity photon population.
VI Discussion
We have presented measurements of nanobeam optomechanical crystals in which a 3.8 GHz mechanical breathing mode is coupled to a 980 nm optical mode. Compared to our earlier work [39], we have been able to increase optical quality factors (both the average and maximum value across many devices) by as much as a factor of 4, with a highest measured. We have also looked at the effect of weak HF etching on both optical and mechanical , to assess whether it is effective at removing potential surface loss mechanisms. Finally, we have performed temperature-dependent measurements from 6 K to 300 K, and have seen an improvement in mechanical by about a factor of 2.
At a mode temperature of 6 K, the phonon occupation number for the 3.8 GHz breathing mode (without laser cooling) is calculated to be 33. For applications such as laser cooling of the mechanical mode to lower occupation levels, much higher cooperativity values than those demonstrated here (0.6) must be achieved. This can be done through an increased intracavity photon number , higher optomechanical coupling rate , lower mechanical dissipation rate , and lower optical decay rate . is currently limited by thermo-optic dispersion, where heating of the optical cavity (for example, due to absorption) results in a refractive index change and a shift in the optical cavity mode frequency. While in devices like microcavity frequency combs, a so-called ‘soft thermal lock’ [82] can be achieved to effectively lock the cavity detuning with respect to the input laser, we have not been able to reproduce a similar effect in the nanobeam optomechanical crystals, where the detuning level (in units of number of optical cavity linewidths) is much larger, placing it at a thermally unstable point [83]. Significant increases in will either require reduced heating (e.g., lower absorption levels) or some mechanism to lock the laser with respect to the cavity in the presence of thermo-optic dispersion.
In this work, we have shown improved optical and mechanical quality factors with respect to those in Ref. [39]. Further improvements in mechanical will require a more detailed understanding of dissipation mechanisms at GHz frequencies in (we note that 10 MHz frequency devices fabricated using the same process as described here have at room temperature and under vacuum). Cryogenic cooling to even lower temperatures may minimize remaining potential dissipation mechanisms (e.g., two-level systems [84]); other approaches to passivate surfaces may also be considered. Regarding optical losses, we have found an improved electron-beam lithography process to be key to the improvement shown in this work. Further improvements in lithography (e.g., through better proximity effect correction) will be the subject of future work.
Finally, one challenge in working with relative to materials like Si is its comparatively lower refractive index, which causes a significant reduction in the coupling rate for similarly designed optomechanical structures. Slot mode geometries, such as the optomechanical crystals designed in Ref. [59], are one approach to increasing , while also enabling a host of multimode applications in which the mechanical mode is coupled to more than one optical resonance, or vice versa.
VII Acknowledgements
We thank Kerry Neal and Isaac Henslee from Montana Instruments for assistance with the cryogenic measurement system. K.E.G. acknowledges the National Research Council for her NIST/NRC postdoctoral fellowship support. This work was also partly supported by the DARPA MESO project. The identification of any commercial product or trade name is used to foster understanding. Such identification does not imply recommendation or endorsement or by the National Institute of Standards and Technology, nor does it imply that the materials or equipment identified are necessarily the best available for the purpose.
References
- [1] M. Aspelmeyer, T. J. Kippenberg, and F. Marquardt, “Cavity Optomechanics,” arXiv, p. 1303.0733, Mar. 2013.
- [2] A. Schliesser, O. Arcizet, R. Rivière, G. Anetsberger, and T. J. Kippenberg, “Resolved-sideband cooling and position measurement of a micromechanical oscillator close to the Heisenberg uncertainty limit,” Nature Physics, vol. 5, pp. 509–514, Jul. 2009.
- [3] J. D. Teufel, T. Donner, M. A. Castellanos-Beltran, J. W. Harlow, and K. W. Lehnert, “Nanomechanical motion measured with an imprecision below that at the standard quantum limit,” Nature Nanotechnology, vol. 4, pp. 820–823, Dec. 2009.
- [4] K. Srinivasan, H. Miao, M. T. Rakher, M. Davanc o, and V. Aksyuk, “Optomechanical transduction of an integrated silicon cantilever probe using a microdisk resonator,” Nano Letters, vol. 11, no. 2, pp. 791–797, 2011.
- [5] A. G. Krause, M. Winger, T. D. Blasius, Q. Lin, and O. Painter, “A high-resolution microchip optomechanical accelerometer,” Nature Photonics, vol. 6, pp. 768–772, Nov. 2012.
- [6] S. Forstner, S. Prams, J. Knittel, E. D. van Ooijen, J. D. Swaim, G. I. Harris, A. Szorkovszky, W. P. Bowen, and H. Rubinsztein-Dunlop, “Cavity Optomechanical Magnetometer,” Phys. Rev. Lett., vol. 108, no. 12, p. 120801, Mar. 2012.
- [7] J. T. Hill, A. H. Safavi-Naeini, J. Chan, and O. Painter, “Coherent optical wavelength conversion via cavity optomechanics,” Nature Communications, vol. 3, Nov. 2012.
- [8] C. Dong, V. Fiore, M. Kuzyk, and H. Wang, “Optomechanical Dark Mode,” Science, vol. 338, pp. 1609–1613, Dec. 2012.
- [9] Y. Liu, M. Davanço, V. Aksyuk, and K. Srinivasan, “Electromagnetically induced transparency and wideband wavelength conversion in silicon nitride microdisk optomechanical resonators,” Phys. Rev. Lett., vol. 110, p. 223603, May 2013.
- [10] J. Bochmann, A. Vainsencher, D. D. Awschalom, and A. N. Cleland, “Nanomechanical coupling between microwave and optical photons,” Nature Physics, vol. 9, pp. 712–716, Nov. 2013.
- [11] T. Bagci, A. Simonsen, S. Schmid, L. G. Villanueva, E. Zeuthen, J. Appel, J. M. Taylor, A. Sørensen, K. Usami, A. Schliesser, and E. S. Polzik, “Optical detection of radio waves through a nanomechanical transducer,” Nature, vol. 507, pp. 81–85, Mar. 2014.
- [12] R. W. Andrews, R. W. Peterson, T. P. Purdy, K. Cicak, R. W. Simmonds, C. A. Regal, and K. W. Lehnert, “Bidirectional and efficient conversion between microwave and optical light,” Nature Physics, vol. 10, pp. 321–326, Apr. 2014.
- [13] D. W. C. Brooks, T. Botter, S. Schreppler, T. P. Purdy, N. Brahms, and D. M. Stamper-Kurn, “Non-classical light generated by quantum-noise-driven cavity optomechanics,” Nature, vol. 488, no. 7412, pp. 476–480, aug 2012.
- [14] A. H. Safavi-Naeini, S. Gröblacher, J. T. Hill, J. Chan, M. Aspelmeyer, and O. Painter, “Squeezed light from a silicon micromechanical resonator,” Nature, vol. 500, pp. 185–189, Aug. 2013.
- [15] T. P. Purdy, P.-L. Yu, R. W. Peterson, N. S. Kampel, and C. A. Regal, “Strong Optomechanical Squeezing of Light,” Physical Review X, vol. 3, no. 3, p. 031012, Jul. 2013.
- [16] J. D. Teufel, T. Donner, D. Li, J. W. Harlow, M. S. Allman, K. Cicak, A. J. Sirois, J. D. Whittaker, K. W. Lehnert, and R. W. Simmonds, “Sideband cooling of micromechanical motion to the quantum ground state,” Nature, vol. 475, pp. 359–363, Jul. 2011.
- [17] J. Chan, T. P. M. Alegre, A. H. Safavi-Naeini, J. T. Hill, A. Krause, S. Gröblacher, M. Aspelmeyer, and O. Painter, “Laser cooling of a nanomechanical oscillator into its quantum ground state,” Nature, vol. 478, pp. 89–92, Oct. 2011.
- [18] S. Gröblacher, K. Hammerer, M. R. Vanner, and M. Aspelmeyer, “Observation of strong coupling between a micromechanical resonator and an optical cavity field,” Nature, vol. 460, pp. 724–727, Aug. 2009.
- [19] E. Verhagen, S. Deléglise, S. Weis, A. Schliesser, and T. J. Kippenberg, “Quantum-coherent coupling of a mechanical oscillator to an optical cavity mode,” Nature, vol. 482, pp. 63–67, Feb. 2012.
- [20] V. Fiore, Y. Yang, M. C. Kuzyk, R. Barbour, L. Tian, and H. Wang, “Storing optical information as a mechanical excitation in a silica optomechanical resonator,” Phys. Rev. Lett., vol. 107, p. 133601, Sep 2011.
- [21] T. A. Palomaki, J. W. Harlow, J. D. Teufel, R. W. Simmonds, and K. W. Lehnert, “Coherent state transfer between itinerant microwave fields and a mechanical oscillator,” Nature, vol. 495, pp. 210–214, Mar. 2013.
- [22] K. Stannigel, P. Rabl, A. S. Sørensen, P. Zoller, and M. D. Lukin, “Optomechanical Transducers for Long-Distance Quantum Communication,” Phys. Rev. Lett., vol. 105, no. 22, p. 220501, Nov. 2010.
- [23] K. Stannigel, P. Komar, S. J. M. Habraken, S. D. Bennett, M. D. Lukin, P. Zoller, and P. Rabl, “Optomechanical quantum information processing with photons and phonons,” Phys. Rev. Lett., vol. 109, p. 013603, Jul 2012.
- [24] M. Ludwig, A. H. Safavi-Naeini, O. Painter, and F. Marquardt, “Enhanced quantum nonlinearities in a two-mode optomechanical system,” Phys. Rev. Lett., vol. 109, p. 063601, Aug 2012.
- [25] S. Rips and M. J. Hartmann, “Quantum information processing with nanomechanical qubits,” Phys. Rev. Lett., vol. 110, p. 120503, Mar 2013.
- [26] K. Børkje, A. Nunnenkamp, J. D. Teufel, and S. M. Girvin, “Signatures of nonlinear cavity optomechanics in the weak coupling regime,” Phys. Rev. Lett., vol. 111, p. 053603, Aug 2013.
- [27] M. Eichenfield, J. Chan, R. M. Camacho, K. J. Vahala, and O. Painter, “Optomechanical crystals,” Nature, vol. 462, no. 7269, pp. 78–82, Oct. 2009.
- [28] A. H. Safavi-Naeini and O. Painter, “Design of optomechanical cavities and waveguides on a simultaneous bandgap phononic-photonic crystal slab,” Opt. Express, vol. 18, no. 14, pp. 14 926–14 943, Jul 2010.
- [29] A. H. Safavi-Naeini and O. Painter, “Proposal for an optomechanical traveling wave phonon-photon translator,” New Journal of Physics, vol. 13, no. 1, p. 013017, 2011.
- [30] A. H. Safavi-Naeini, T. P. M. Alegre, J. Chan, M. Eichenfield, M. Winger, Q. Lin, J. T. Hill, D. E. Chang, and O. Painter, “Electromagnetically induced transparency and slow light with optomechanics,” Nature, vol. 472, pp. 69–73, Apr. 2011.
- [31] T. Alegre, A. Safavi-Naeini, M. Winger, and O. Painter, “Quasi-two-dimensional optomechanical crystals with a complete phononic bandgap,” Opt. Express, vol. 19, pp. 5658–5669, Mar. 2011.
- [32] A. H. Safavi-Naeini, J. T. Hill, S. Meenehan, J. Chan, S. Gröblacher, and O. Painter, “Two-dimensional phononic-photonic band gap optomechanical crystal cavity,” Phys. Rev. Lett., vol. 112, p. 153603, Apr 2014.
- [33] J. Chan, A. H. Safavi-Naeini, J. T. Hill, S. Meenehan, and O. Painter, “Optimized optomechanical crystal cavity with acoustic radiation shield,” Appl. Phys. Lett., vol. 101, no. 8, p. 081115, 2012.
- [34] S. M. Meenehan, J. D. Cohen, S. Gröblacher, J. T. Hill, A. H. Safavi-Naeini, M. Aspelmeyer, and O. Painter, “Silicon optomechanical crystal resonator at millikelvin temperatures,” Phys. Rev. A, vol. 90, p. 011803, Jul 2014.
- [35] Q. Lin, O. J. Painter, and G. P. Agrawal, “Nonlinear optical phenomena in silicon waveguides: modeling and applications,” Opt. Express, vol. 15, p. 16604, 2007.
- [36] H. Rong, A. Liu, R. Jones, O. Cohen, D. Hak, R. Nicolaescu, A. Fang, and M. Paniccia, “An all-silicon Raman laser,” Nature, vol. 433, no. 7023, pp. 292–294, Jan. 2005.
- [37] X. Liu, R. M. Osgood, Jr., Y. A. Vlasov, and W. M. J. Green, “Mid-infrared optical parametric amplifier using silicon nanophotonic waveguides,” Nature Photonics, vol. 4, no. 8, pp. 557–560, AUG 2010.
- [38] S. Zlatanovic, J. S. Park, S. Moro, J. M. C. Boggio, I. B. Divliansky, N. Alic, S. Mookherjea, and S. Radic, “Mid-infrared wavelength conversion in silicon waveguides using ultracompact telecom-band-derived pump source,” Nature Photonics, vol. 4, no. 8, pp. 561–564, AUG 2010.
- [39] M. Davanço, S. Ates, Y. Liu, and K. Srinivasan, “Si3N4 optomechanical crystals in the resolved-sideband regime,” Appl. Phys. Lett., vol. 104, no. 4, p. 041101, Jan. 2014.
- [40] S. Weis, R. Rivière, S. Deléglise, E. Gavartin, O. Arcizet, A. Schliesser, and T. J. Kippenberg, “Optomechanically Induced Transparency,” Science, vol. 330, pp. 1520–, Dec. 2010.
- [41] B. M. Zwickl, W. E. Shanks, A. M. Jayich, C. Yang, A. C. Bleszynski Jayich, J. D. Thompson, and J. G. E. Harris, “High quality mechanical and optical properties of commercial silicon nitride membranes,” Appl. Phys. Lett., vol. 92, no. 10, p. 103125, Mar. 2008.
- [42] S. S. Verbridge, H. G. Craighead, and J. M. Parpia, “A megahertz nanomechanical resonator with room temperature quality factor over a million,” Appl. Phys. Lett., vol. 92, no. 1, p. 013112, Jan. 2008.
- [43] J. D. Thompson, B. M. Zwickl, A. M. Jayich, F. Marquardt, S. M. Girvin, and J. G. E. Harris, “Strong dispersive coupling of a high-finesse cavity to a micromechanical membrane,” Nature, vol. 452, pp. 72–75, Mar. 2008.
- [44] U. Kemiktarak, M. Durand, M. Metcalfe, and J. Lawall, “Cavity optomechanics with sub-wavelength grating mirrors,” New Journal of Physics, vol. 14, no. 12, p. 125010, Dec. 2012.
- [45] G. Anetsberger, O. Arcizet, Q. P. Unterreithmeier, R. Rivière, A. Schliesser, E. M. Weig, J. P. Kotthaus, and T. J. Kippenberg, “Near-field cavity optomechanics with nanomechanical oscillators,” Nature Physics, vol. 5, pp. 909–914, Dec. 2009.
- [46] K. Y. Fong, W. H. P. Pernice, M. Li, and H. X. Tang, “High Q optomechanical resonators in silicon nitride nanophotonic circuits,” Appl. Phys. Lett., vol. 97, no. 7, p. 073112, Aug. 2010.
- [47] G. S. Wiederhecker, L. Chen, A. Gondarenko, and M. Lipson, “Controlling photonic structures using optical forces,” Nature, vol. 462, pp. 633–636, Dec. 2009.
- [48] M. Eichenfield, R. Camacho, J. Chan, K. J. Vahala, and O. Painter, “A picogram- and nanometre-scale photonic-crystal optomechanical cavity,” Nature, vol. 459, no. 7246, pp. 550–555, May 2009.
- [49] T. Beyazoglu, T. Rocheleau, K. Grutter, A. Grine, M. Wu, and C.-C. Nguyen, “A multi-material Q-boosted low phase noise optomechanical oscillator,” in Micro Electro Mechanical Systems (MEMS), 2014 IEEE 27th International Conference on, Jan 2014, pp. 1193–1196.
- [50] S. Tallur, S. Sridaran, and S. A. Bhave, “A monolithic radiation-pressure driven, low phase noise silicon nitride opto-mechanical oscillator,” Opt. Express, vol. 19, no. 24, pp. 24 522–24 529, 2011.
- [51] T. J. Kippenberg and K. J. Vahala, “Cavity Optomechanics: Back-Action at the Mesoscale,” Science, vol. 321, pp. 1172–1176, Aug. 2008.
- [52] I. Wilson-Rae, N. Nooshi, W. Zwerger, and T. J. Kippenberg, “Theory of ground state cooling of a mechanical oscillator using dynamical backaction,” Phys. Rev. Lett., vol. 99, p. 093901, Aug 2007.
- [53] F. Marquardt, J. P. Chen, A. A. Clerk, and S. M. Girvin, “Quantum theory of cavity-assisted sideband cooling of mechanical motion,” Phys. Rev. Lett., vol. 99, p. 093902, Aug 2007.
- [54] P. E. Barclay, K. Srinivasan, O. Painter, B. Lev, and H. Mabuchi, “Integration of fiber-coupled high- SiNx microdisks with magnetostatic atom chips,” Appl. Phys. Lett., vol. 89, no. 13, p. 131108, sep 2006.
- [55] A. Gondarenko, J. S. Levy, and M. Lipson, “High confinement micron-scale silicon nitride high Q ring resonator,” Opt. Express, vol. 17, p. 11366, Jun. 2009.
- [56] E. Shah Hosseini, S. Yegnanarayanan, A. H. Atabaki, M. Soltani, and A. Adibi, “High quality planar silicon nitride microdisk resonators for integrated photonics in the visible wavelength range,” Opt. Express, vol. 17, p. 14543, Aug. 2009.
- [57] Q. Li, A. A. Eftekhar, M. Sodagar, Z. Xia, A. H. Atabaki, and A. Adibi, “Vertical integration of high-Q silicon nitride microresonators into silicon-on-insulator platform,” Opt. Express, vol. 21, p. 18236, Jul. 2013.
- [58] D. T. Spencer, J. F. Bauters, M. J. R. Heck, and J. E. Bowers, “Integrated waveguide coupled Si3N4 resonators in the ultrahigh-Q regime,” Optica, vol. 1, no. 3, pp. 153–157, Sep 2014.
- [59] M. Davanço, J. Chan, A. H. Safavi-Naeini, O. Painter, and K. Srinivasan, “Slot-mode-coupled optomechanical crystals,” Opt. Express, vol. 20, no. 22, pp. 24 394–24 410, Oct 2012.
- [60] Q. Quan and M. Loncar, “Deterministic design of wavelength scale, ultra-high Q photonic crystal nanobeam cavities,” Opt. Express, vol. 19, no. 19, pp. 18 529–18 542, Sep 2011.
- [61] K. Srinivasan and O. Painter, “Momentum space design of high-Q photonic crystal optical cavities,” Opt. Express, vol. 10, no. 15, pp. 670–684, Jul. 2002.
- [62] P. T. Rakich, C. Reinke, R. Camacho, P. Davids, and Z. Wang, “Giant enhancement of stimulated brillouin scattering in the subwavelength limit,” Phys. Rev. X, vol. 2, p. 011008, Jan 2012.
- [63] K. C. Balram, M. Davanço, J. Y. Lim, J. D. Song, and K. Srinivasan, “Moving boundary and photoelastic coupling in GaAs optomechanical resonators,” preprint arXiv:1409.6198, 2014.
- [64] D. K. Biegelsen, “Photoelastic tensor of silicon and the volume dependence of the average gap,” Phys. Rev. Lett., vol. 32, no. 21, p. 1196, 1974.
- [65] R. Dixon, “Photoelastic properties of selected materials and their relevance for applications to acoustic light modulators and scanners,” J. Appl. Phys., vol. 38, no. 13, pp. 5149–5153, 1967.
- [66] A. Schliesser, G. Anetsberger, R. Rivière, O. Arcizet, and T. J. Kippenberg, “High-sensitivity monitoring of micromechanical vibration using optical whispering gallery mode resonators,” New Journal of Physics, vol. 10, no. 9, p. 095015, Sep. 2008.
- [67] K. Srinivasan and O. Painter, “Optical fiber taper coupling and high-resolution wavelength tuning of microdisk resonators at cryogenic temperatures,” Appl. Phys. Lett., vol. 90, p. 031114, Jan. 2007.
- [68] R. Rivière, O. Arcizet, A. Schliesser, and T. J. Kippenberg, “Evanescent straight tapered-fiber coupling of ultra-high Q optomechanical micro-resonators in a low-vibration helium-4 exchange-gas cryostat,” Review of Scientific Instruments, vol. 84, no. 4, p. 043108, Apr. 2013.
- [69] G. S. Agarwal and S. Huang, “Electromagnetically induced transparency in mechanical effects of light,” Phys. Rev. A, vol. 81, p. 041803, Apr 2010.
- [70] H. Wang, G. Laws, S. Milicic, P. Boland, A. Handugan, M. Pratt, T. Eschrich, S. Myhajlenko, J. Allgair, and B. Bunday, “Low temperature ZEP-520A development process for enhanced critical dimension realization in reactive ion etch etched polysilicon,” Journal of Vacuum Science & Technology B, vol. 25, no. 1, pp. 102–105, 2007.
- [71] L. Ocola and A. Stein, “Effect of cold development on improvement in electron-beam nanopatterning resolution and line roughness,” Journal of Vacuum Science & Technology B, vol. 24, no. 6, pp. 3061–3065, 2006.
- [72] L. Guillermo Villanueva and S. Schmid, “Evidence of surface loss as ubiquitous limiting damping mechanism in SiN micro-and nanomechanical resonators,” preprint arXiv:1405.6115, 2014.
- [73] M. Borselli, T. J. Johnson, and O. Painter, “Accurate measurement of scattering and absorption loss in microphotonic devices,” Opt. Lett., vol. 32, no. 20, pp. 2954–2956, 2007.
- [74] D. Southworth, R. Barton, S. Verbridge, B. Ilic, A. Fefferman, H. Craighead, and J. Parpia, “Stress and silicon nitride: A crack in the universal dissipation of glasses,” Phys. Rev. Lett., vol. 102, no. 22, p. 225503, 2009.
- [75] T. Faust, J. Rieger, M. J. Seitner, J. P. Kotthaus, and E. M. Weig, “Signatures of two-level defects in the temperature-dependent damping of nanomechanical silicon nitride resonators,” Phys. Rev. B, vol. 89, no. 10, p. 100102, 2014.
- [76] K. Y. Yasumura, T. D. Stowe, E. M. Chow, T. Pfafman, T. W. Kenny, B. C. Stipe, and D. Rugar, “Quality factors in micron-and submicron-thick cantilevers,” Microelectromechanical Systems, Journal of, vol. 9, no. 1, pp. 117–125, 2000.
- [77] Q. P. Unterreithmeier, T. Faust, and J. P. Kotthaus, “Damping of nanomechanical resonators,” Phys. Rev. Lett., vol. 105, no. 2, p. 027205, 2010.
- [78] S. Ghaffari, S. A. Chandorkar, S. Wang, E. J. Ng, C. H. Ahn, V. Hong, Y. Yang, and T. W. Kenny, “Quantum limit of quality factor in silicon micro and nano mechanical resonators,” Scientific Reports, vol. 3, 2013.
- [79] D. Wilson, C. Regal, S. Papp, and H. Kimble, “Cavity optomechanics with stoichiometric SiN films,” Phys. Rev. Lett., vol. 103, no. 20, p. 207204, 2009.
- [80] T. Purdy, R. Peterson, P. Yu, and C. Regal, “Cavity optomechanics with Si3N4 membranes at cryogenic temperatures,” New Journal of Physics, vol. 14, no. 11, p. 115021, 2012.
- [81] M. L. Gorodetsky, A. Schliesser, G. Anetsberger, S. Deleglise, and T. J. Kippenberg, “Determination of the vacuum optomechanical coupling rate using frequency noise calibration,” Opt. Express, vol. 18, p. 23236, Oct. 2010.
- [82] P. Del’Haye, A. Schliesser, O. Arcizet, T. Wilken, R. Holzwarth, and T. J. Kippenberg, “Optical frequency comb generation from a monolithic microresonator,” Nature, vol. 450, pp. 1214–1217, Dec. 2007.
- [83] T. Carmon, L. Yang, and K. Vahala, “Dynamical thermal behavior and thermal self-stability of microcavities,” Opt. Express, vol. 12, no. 20, pp. 4742–4750, 2004.
- [84] P. Mohanty, D. Harrington, K. Ekinci, Y. Yang, M. Murphy, and M. Roukes, “Intrinsic dissipation in high-frequency micromechanical resonators,” Phys. Rev. B, vol. 66, no. 8, p. 085416, 2002.