Information entropy of classical versus explosive percolation
Abstract
We study the Shannon entropy of the cluster size distribution in classical as well as explosive percolation, in order to estimate the uncertainty in the sizes of randomly chosen clusters. At the critical point the cluster size distribution is a power-law, i.e. there are clusters of all sizes, so one expects the information entropy to attain a maximum. As expected, our results show that the entropy attains a maximum at this point for classical percolation. Surprisingly, for explosive percolation the maximum entropy does not match the critical point. Moreover, we show that it is possible determine the critical point without using the conventional order parameter, just analysing the entropy’s derivatives.
1 Introduction
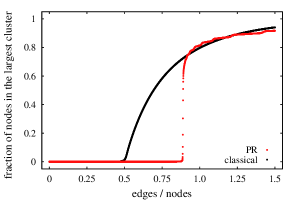
Percolation stauffer-1994 ; saberi-2015 is used to model diverse phenomena, ranging from porous media to social interactions. There is a well-known phase transition associated with percolation. At the critical point, the giant cluster emerges, comparable in size to the entire network. The classical network model developed by Erdös and Rényi erdos-1960 (random network) has a smooth continuous phase transition, as shown in Fig. 1. In this model edges are randomly arranged between the nodes in the network. It was believed until recently that all percolation transitions were continuous. However, the discovery of explosive percolation achlioptas-2009 led to questions regarding the continuous nature of the percolation phase transition costa-2010 ; grassberger-2011 ; riordan-2011 ; cho-2011 ; lee-2011 ; tian-2012 ; costa-2014 ; costa-2014-2 .
The key idea behind explosive percolation is to add edges in a manner to delay the onset of the percolation transition. A specific choice is made before the addition of each new edge. This choice process has the aim of delaying the formation of the giant cluster. As a consequence, it grows very suddenly at birth, leading to an abrupt phase transition. The first proposed mechanism was called the product rule (PR) achlioptas-2009 , which works as follows. Two node pairs are selected and an edge is placed between the pair whose product of the number of nodes in the connecting clusters is the smallest. The explosive percolation caused by the PR is shown in Fig. 1. Actually researches agree that the explosive percolation transition is continuous, but with unusual characteristics costa-2014-2 . In fact, explosive percolation is not yet completely understood and continues to be an area of intense research araujo-2014 .
Looking for a method of studying phase transitions of percolating systems without the explicit use of order parameter, we analyze the Shannon entropy associated with the cluster size probability distribution. By doing so, we note that it’s possible to determine the critical point through the entropy’s derivatives. In addition, we find a previously unknown (and unexpected) property of explosive percolation: in contrast with classical percolation, its critical point does not correspond to a maximum of the Shannon entropy of the cluster size distribution.
2 Information entropy of the cluster size probability distribution
We propose a new way of observing and studying percolation phase transitions. Our method is capable of determining the transition point even without the specific study of the order parameter (relative size of the network’s largest cluster for classical percolation on random networks stauffer-1994 ; costa-2014 ). Although others mechanisms towards abrupt percolation transition have been proposed dsouza-2010 ; araujo-2010 ; manna-2011 , in this article we focus only on: (i) the product rule (PR) and (ii) the rule developed by da Costa et al. costa-2010 ; costa-2014 (dCR). The explosive percolations resulting from these two mechanisms and the classical percolation were simulated and we analyzed them through the alternative approach described below.
Our new method for observe percolation phase transitions is based on information theory. We use the Shannon entropy shannon-1948 , that is defined as
| (1) |
in which the set is a probability distribution and is a constant. It is a function whose output is a type of measure of information contained in the probability distribution . While we arrange edges in the network, clusters are formed so that the cluster size probability distribution changes during this process. The cluster size distribution has the following meaning: at a given moment the network has clusters with size 1 (single nodes), clusters with size 2, and so on. After normalization, we have the probability distribution. Thus, at each moment, this distribution can be used to characterize the current state of the network. We employ the Shannon entropy to analyze the information content of this distribution.
The Shannon entropy is such that the more flat or uniform the probability distribution (that is, tending to the equiprobability), the higher the entropy . Thus when there are only single-node clusters, we obtain . There is no uncertainty about the size of the clusters (i.e. they all have size 1). As edges are added to the network, the entropy starts to increase because of the emergence of new clusters with different sizes. However, there is a moment when the network is populated by several clusters of various sizes and the cluster size distribution attains its widest form, so reaches a maximum. At the critical point the system becomes scale-free and a cluster with size comparable to the size of the network emerges. This moment announces the giant cluster onset and the percolation transition. Thereafter, the giant cluster starts to absorb other clusters, thereby decreasing the amount of clusters and also the variety of different sizes. Therefore, one expects that decreases after the critical point. This is basically the dynamics observed for the classical percolation, while that resulting from the explosive rules has more ingredients.
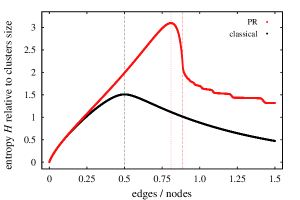
Figure 2 shows graphically what we have discussed above. We have used Eq. 1 with and repeatedly calculated the entropy after a fixed number of edges has been added to the networks. The result for classical percolation follows the expected behavior and the maximum entropy matches the critical point. However, the result for explosive percolation doesn’t. The explosive transition happens only after the addition of yet more edges. Figure 2 shows that the PR leads the networks to a configuration of maximum entropy, although the giant cluster still has not been born. Between the point of maximum entropy and the critical point the entropy declines rapidly.
We emphasize that the critical point is marked by a power-law cluster distribution (not shown), which means that there are clusters of all sizes, with scale-free behavior. Nevertheless our simulations show clearly that the critical point does not maximize the entropy. How can this be? We note that the size of the clusters at the maximum entropy configuration is limited, tending to be negligible for networks composed by a very large amount of nodes. Moreover, because the information entropy of cluster size distribution is related with the uncertainty to guess the size of a randomly chosen cluster, we conclude that it is harder to guess the size of a cluster before the transition than at the transition.
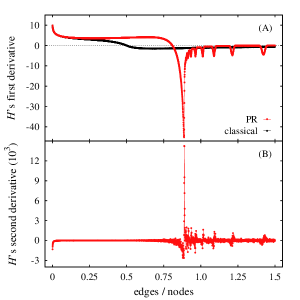
The data exposed on Fig. 2 alone is not enough to explain the positioning of the explosive percolation’s critical point based on the Shannon entropy analysis. Nevertheless, we note that the uncertainty falls quickly before the transition. So, we calculate the entropy’s first and second derivatives to see how they behave in the vicinity of the transition. The numerical derivatives are shown in Fig. 3 and were obtained as follows. Because in our simulations the density of edges varies uniformly, we represent the step between each subsequent addition of edges by (constant). With representing the entropy after the -th addition of edges (i.e. at density ), we calculate the derivatives using fornberg-1988
| (2) |
for the first derivative and
| (3) |
for the second derivative. Such as expected, the curve relative to the classical percolation is smooth (hence the second derivative was suppressed). However, the striking feature is the sharpened curves for the explosive case. It’s possible to see the explosive behavior being reproduced. In (A) we see a sharp minimum just before the transition. The fast decreasing in the entropy is caused by the agglutination of smaller clusters. This results in clusters somewhat larger, what increases the amount of clusters of different sizes and decreases the probability associated to the majority of them. This dynamics reduces the entropy relative to the cluster size distribution. At this stage there are favorable conditions for the emergence of the largest cluster and the PR prevents it by favoring that smaller clusters would coalesce. However, there is a moment when arrange edges between different clusters becomes harder and more edges are arranged internally to a same cluster. So, because the cluster size distribution undergoes less changes, the entropy starts to decrease more slowly and the first derivative exhibits a strongly vertical slope. In that moment, it becomes impossible to prevent the largest cluster growth and it initiates to swallow the others. In (B) we see the entropy’s second derivative. The occurrence of its maximum value coincides with the percolation transition. Therefore, we conclude that the transition occurs just after the entropy ceases to fall quickly.
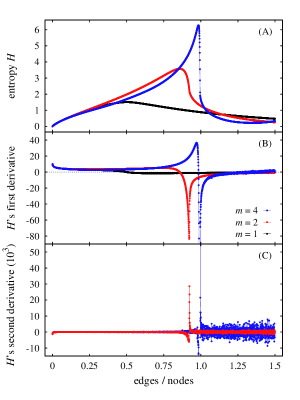
The application of our method to the explosive percolation caused by the dCR is shown in Fig. 4. This rule imposes that edges are added as follows: (i) choose two sets of nodes; (ii) for each set, select the node in the smallest cluster; and (iii) put an edge connecting these two nodes. While the case recovers the classical percolation, if we obtain explosive percolations. Such as the explosive percolation via PR, the point of maximum value for the entropy occurs before the percolation transition. The critical point is indicated by the maximum value for the entropy’s second derivative, as before. We can see that the higher is , the more retarded are these instants (maximum entropy and critical point) in comparison to the classical percolation. Furthermore, these points become closer when is increased, such that they should coincide when the value of is too high. However, if is comparable to the size of the network, the edges will be added deterministically. They will always connect the two smallest clusters in the network at every moment. In this case, the cluster size distribution is fully known and calculate its Shannon entropy will not give us more insights about the network structure. Therefore, our approach only applies when there is an amount of randomness involved.
3 The information entropy analysis is not sensitive to network size
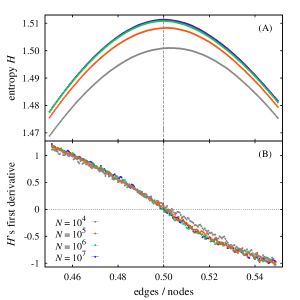
Questions may be raised about what happens with the maximum entropy when the number of nodes in the networks increase. Will the entropy related to classical percolation keeps its smooth appearance when the network size grows? Would it be the mismatch between maximum entropy and critical point only an effect of the finite size of the system? In order to answer such questions, we apply our method to networks composed by different amounts of nodes. We restrict this study to classical and PR percolations and the results for them are shown in Figs. 5 and 6, respectively. In Table 1, we compile data indicating that the maximum entropy point and the critical point converge to well-determined values when the amount of nodes is increased. In turn, Table 2 contains the relative difference between the value of maximum entropy for growing sizes. It underlies our argument on the convergence of entropy toward a limiting behavior while we grow the size of the network systematically, as described below.
The analysis of the data relative to classical percolation is straightforward, because we need to focus essentially on one point of the graph. Figure 5 shows in (A) the curves getting closer while the size () of the system is increased, so that the two topmost curves are virtually coincident. This pattern, summarized in Table 2, allows us infer that there is a limiting curve for which all others tend when increases towards infinite. Moreover, we expect that this limiting curve is located very close to that for . In (B), the ’s first derivative data indicate that the curves have the same aspect, so that none of them is sharper around the maximum entropy point than the others. In spite of fluctuations, it’s easy to see that the value of the derivative at each point is the same for the studied sizes, being only slightly different to the smaller one ().
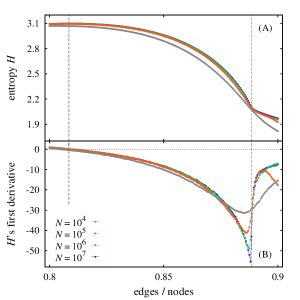
In the PR case, the analysis must be more careful, since the maximum entropy and the critical point do not match. In this way, observing Fig. 6, we note that the maximum entropy and the critical point remain well-determined graphically when the size of the networks varies. Furthermore, we see that the gap between them does not change while increases, such as the data in Table 1 demonstrate. The curves in (A) reveal that our method is not sensitive to the network size, since it is greater than a given minimum size, which we estimate to be around nodes. Although effects of finite size of the networks may be observed, especially after the percolation transition, they do not affect the positioning of the maximum entropy point and the determination of the critical point. Indeed, the data for sizes above this minimum size indicate a collapse on the same limiting curve (see Table 2). Thus, we infer that at the limit in which the system has an infinite size, the shape of the curve for the entropy will not change from this limiting curve. In (B), we show that while increases, the first derivative becomes sharper and its minimum tends to coincide with the percolation transition. In fact, we point out that the gap between the minimum of the first derivative and the maximum of the second derivative disappears when the system size becomes too large.
| Classical percolation | Explosive percolation (PR) | ||
| ME and CP | ME | CP | |
| 0.5020(5) | 0.8045(5) | 0.8880(5) | |
| 0.5015(5) | 0.8085(5) | 0.8890(5) | |
| 0.5000(5) | 0.8085(5) | 0.8885(5) | |
| 0.5000(5) | 0.8085(5) | 0.8885(5) | |
4 Conclusion
In summary, we have developed a new method for studying percolation phase transitions, which makes use of the Shannon entropy of the cluster size distribution. Although the study of the order parameter is the canonical way to observe phase transitions of percolating systems, some aspects of the network evolution toward the percolation transition are not apparent via this conventional approach. An immediate and unexpected output of our approach is that the explosive percolation transition does not occur at the maximum of entropy. This adds up to other characteristics of explosive percolation contrasting with classical percolation. Although the network is populated by clusters of all sizes at the critical point, there are other configurations with even higher entropy of cluster sizes, if edges are added following explosive mechanisms. We show that it is possible determine the critical point of classical and of explosive percolations on random networks only through the Shannon entropy’s derivatives. In addition, our computational analysis demonstrates that this approach has a fast convergence to the expected behavior to a system in the limit of infinite size. In this context, we hope that our results motivate further studies about percolating systems from non-canonical viewpoints with the aim of increasing our understanding of percolation transitions, both classical as well as explosive.
The authors thank the financial support of CNPq.
All authors contributed equally to the paper.
References
- (1) D. Stauffer and A. Aharony, Introduction to Percolation Theory. CRC Press, 1994.
- (2) A. A. Saberi Phys. Rep., vol. 578, pp. 1–32, 2015.
- (3) P. Erdös and A. Rényi Publ. Math. Inst. Hungar. Acad. Sci., vol. 5, pp. 17–61, 1960.
- (4) D. Achlioptas, R. M. D’Souza, and J. Spencer Science, vol. 323, p. 1453, 2009.
- (5) R. A. da Costa, S. N. Dorogovtsev, A. V. Goltsev, and J. F. F. Mendes Phys. Rev. Lett., vol. 105, p. 255701, 2010.
- (6) P. Grassberger, C. Christensen, G. Bizhani, S.-W. Son, and M. Paczuski Phys. Rev. Lett., vol. 106, p. 225701, 2011.
- (7) O. Riordan and L. Warnke Science, vol. 333, pp. 322–324, 2011.
- (8) Y. S. Cho and B. Kahng Phys. Rev. Lett., vol. 107, p. 275703, 2011.
- (9) H. K. Lee, B. J. Kim, and H. Park Phys. Rev. E, vol. 84, p. 020101, 2011.
- (10) L. Tian and D.-N. Shi Phys. Lett. A, vol. 376, pp. 286–289, 2012.
- (11) R. A. da Costa, S. N. Dorogovtsev, A. V. Goltsev, and J. F. F. Mendes Phys. Rev. E, vol. 89, p. 042148, 2014.
- (12) R. A. da Costa, S. N. Dorogovtsev, A. V. Goltsev, and J. F. F. Mendes Phys. Rev. E, vol. 90, p. 022145, 2014.
- (13) N. Araújo, P. Grassberger, B. Kahng, K. J. Schrenk, and R. M. Ziff Eur. Phys. J. Special Topics, vol. 223, pp. 2307–2321, 2014.
- (14) R. M. D’Souza and M. Mitzenmacher Phys. Rev. Lett., vol. 104, p. 195702, 2010.
- (15) N. A. M. Araújo and H. J. Herrmann Phys. Rev. Lett., vol. 105, p. 035701, 2010.
- (16) S. S. Manna and A. Chatterjee Physica A, vol. 390, pp. 177–182, 2011.
- (17) C. E. Shannon Bell Syst. Tech. J., vol. 27, pp. 379–423, 1948.
- (18) R. Fornberg Math. Comp., vol. 51, pp. 699–706, 1988.