Activation cross-sections of deuteron induced reactions on natSm up to 50 MeV
Abstract
Activation cross-sections for deuteron induced reactions on Sm are presented for the first time for natSm(d,xn)155,154,152m2,152m1,152g,150m,150g,149,148,147,146Eu, natSm(d,x)153,145Sm and natSm(d,x)151,150,149,145,144,143Pm up to 50 MeV. The cross-sections were measured by the stacked-foil irradiation technique and high resolution -ray spectrometry. The results were compared with results of nuclear reaction codes ALICE-D, EMPIRE-D and TALYS (from TENDL libraries). Integral yields of the products were calculated from the excitation functions.
keywords:
samarium target, deuteron irradiation, Eu, Sm and Pm radioisotopes, physical yields1 Introduction
In the frame of a systematic study of activation cross-sections for deuteron induced reactions, we have investigated the excitation functions for -emitting radionuclides produced on natural samarium up to 50 MeV. The aim of the program was getting reliable experimental data for different applications (medical isotope production, thin layer activation technique for wear measurement, radiation safety, targetry, etc.) and for improvement the presently used nuclear reaction models. More details on the program and the investigated nuclear reactions can be found in our recent summary papers and conference reports [1, 2]. In a thorough literature search no earlier data were found on production cross-sections of deuteron induced nuclear reactions on samarium. Only a few thick target yields at 22 MeV are available from Dmitriev [3]. Out of the presently measured data, activation cross-sections for the two medically relevant reaction products 145Sm and 153Sm were published separately with a comparison of different production routes [4]. For completeness we present here the measured data for these two radionuclides again in graphical form without discussion.
2 Experiment and data evaluation
The activation cross-sections were measured by using the well-known stacked foil activation method followed by high resolution -spectrometry of the irradiated target and beam monitor foils. The beam parameters along the stack were controlled by simultaneous re-measurement of the monitor reactions along the whole stack. So called elemental cross-sections were deduced considering the natural Sm as monoisotopic. The parameters and methods of experiment and data evaluation are summarized in Table 1. The used decay data and the contributing reactions with their Q-values are collected in Table 2. The cross-sections of the simultaneously measured monitor reactions (27Al(d,x)22,24Na and natTi(d,x)48V ) reproduced completely, both in shape and magnitude, the recommended excitation functions are shown in our earlier publication [4]. In Table 2 the main -lines used for the evaluation are indicated in bold. These are mainly independent lines, but also the other listed -lines were also used if necessary.
| Reaction | natSm(d,x) | Data evaluation | Method |
|---|---|---|---|
| Incident particle | Deuteron | Gamma spectra evaluation | Genie 2000 [5], Forgamma [6] |
| Method | Stacked foil | Determination of beam intensity |
Faraday cup (preliminary)
Fitted monitor reaction (final) [7] |
| Stack composition | Ho-Sm-Al-Ti, repeated 27 times | Decay data | NUDAT 2.6 [8] |
| Target and thickness |
natSm foils, 25.14, 23.13,
24.20 m |
Reaction Q-values | Q-value calculator [9] |
|
Number of target foils
Isotopic abundance |
27
144-3.1 %-stable 147-15.0 %-1.06*1011 a 148-11.3 %-7*1015 a 149-13.8 %-7*1015 a 150-7.4 %- stable 152-26.7- stable 154-22.7- stable |
Determination of beam energy |
Andersen (preliminary) [10]
Fitted monitor reaction (final) [7] |
| Accelerator | Cyclone 90 cyclotron of the Université Catholique in CityplaceLouvain la Neuve (LLN) | Uncertainty of energy | cumulative effects of possible uncertainties |
| Primary energy | 50 MeV | Cross-sections | Elemental cross-section |
| Irradiation time | 66 min | Uncertainty of cross-sections | sum in quadrature of all individual contributions [11] |
| Beam current | 120 nA | Yield | Physical yield [12] |
| Monitor reaction, [recommended values] |
27Al(d,x)22,24Na
natTi(d,x)48V reactions [13] |
||
| Monitor foils and thickness |
natAl : 98 m and 49.6 m
natTi ; 10.9 m |
||
| detector | HPGe | ||
| g-spectra measurements | 4 series | ||
| Cooling times | 6h, 25h, 70h, 530 h |
|
Nuclide
Decay path |
Half-life | Eγ(keV) | Iγ(%) | Contributing reaction |
Q-value
(keV) |
|
155Eu
-: 100 % |
4.753 a |
86.5479
105.3083 |
30.7
21.1 |
154Sm(d,n) | 4427.03 |
|
154gEu
-: 99.982 |
8.601 a |
123.0706
723.3014 873.1834 996.29 1004.76 1274.429 |
40.4
20.06 12.08 10.48 18.01 34.8 |
154Sm(d,2n) | -3724.26 |
|
152m2Eu
IT 147.81 keV |
96 min | 89.847 | 69.9 |
152Sm(d,2n)
154Sm(d,4n) |
-4881.52∗
-18716.71∗ |
|
152m1Eu
-: 72 % : 28 % 45.5998 keV |
9.3116 h |
344.31
121.777 841.594 963.390 |
2.4
7.0 14.2 11.7 |
152Sm(d,2n)
154Sm(d,4n) |
-4881.52∗
-18716.71∗ |
|
152gEu
-: 27.9 % : 72.1 % |
13.537 a |
344.2785
778.9040 121.7817 244.6975 964.079 1085.869 1112.069 1408.006 |
26.6
12.96 28.67 7.61 14.65 10.24 13.69 21.07 |
152Sm(d,2n)
154Sm(d,4n) |
-4881.52
-18716.71 |
|
150mEu
: 11 % IT 88.8 % 42.1 keV |
12.8 h |
333.9
406.5 |
4.0
2.8 |
149Sm(d,n)
150Sm(d,2n) 152Sm(d,4n) 154Sm(d,6n) |
2721.13∗
-5265.55∗ -18716.71∗ -32954.9∗ |
|
150gEu
: 100 % |
36.9 a |
333.971
439.401 584.274 1049.043 |
96
80 52.6 5.4 |
149Sm(d,n)
150Sm(d,2n) 152Sm(d,4n) 154Sm(d,6n) |
2721.13
-5265.55 -19119.7 -32954.9 |
|
149Eu
: 100 % |
93.1 d |
277.089
327.526 |
3.56
4.03 |
148Sm(d,n)
149Sm(d,2n) 150Sm(d,3n) 152Sm(d,5n) 154Sm(d,7n) |
2168.82
-3701.52 -11688.21 -25542.36 -39377.55 |
|
148Eu
: 100 % |
54.5 d |
414.028
414.057 550.284 553.231 553.260 571.962 611.293 629.987 725.673 |
10.3
10.1 99 12.9 5.0 9.6 20.5 71.9 12.7 |
147Sm(d,n)
148Sm(d,2n) 149Sm(d,3n) 150Sm(d,4n) 152Sm(d,6n) 154Sm(d,8n) |
2097.8
-6043.6 -11914. -19900.6 -33754.8 -47590.0 |
|
147Eu
: 99.9978 % |
24.1 d |
121.220
197.299 677.516 1077.043 |
21.2
24.4 9.0 5.69 |
147Sm(d,2n)
148Sm(d,3n) 149Sm(d,4n) 150Sm(d,5n) 152Sm(d,7n) 154Sm(d,9n) |
-4728.53
-12869.91 -18740.25 -26726.94 -40581.09 -54416.27 |
|
146Eu
: 100 % |
4.59 d |
633.083
634.137 747.159 |
35.9
45.0 99 |
147Sm(d,3n)
148Sm(d,4n) 149Sm(d,5n) 150Sm(d,6n) 152Sm(d,8n) 154Sm(d,10n) |
-13226.83
-21368.2 -27238.55 -35225.23 -49079.38 |
|
145Eu
: 100 % |
5.93 d |
653.512
893.73 1658.53 |
15.0
66 14.9 |
144Sm(d,n)
147Sm(d,4n) 148Sm(d,5n) 149Sm(d,6n) 150Sm(d,7n) 152Sm(d,9n) |
1090.5
-20424.02 -28565.4 -34435.7 -42422.43 -56276.58 |
|
153Sm
-: 100 % |
46.50 h |
103.18012
|
29.25 |
152Sm(d,p)
154Sm(d,p2n) 153Pm decay |
3643.834
-10191.4 -11320.47 |
|
145Sm
: 100 % |
340 d | 61.2265 | 12.15 |
144Sm(d,p)
147Sm(d,p3n) 148Sm(d,p4n) 149Sm(d,p5n) 150Sm(d,p6n) 152Sm(d,p8n) 154Sm(d,p10n) 145Eu decay 145Pm decay |
4532.534
-16981.99 -25123.37 -30993.72 -38980.41 -52834.55 -45532. -15583.55 |
|
151Pm
-: 100 % |
28.40 h |
240.09
340.08 445.68 |
3.8
22.5 4.0 |
152Sm(d,2pn)
154Sm(d,2p3n) |
-10890.12
-24725.31 |
|
150Pm
-:100 % |
2.68 h |
333.92
406.51 831.85 876.41 1165.77 1324.51 |
68
5.6 11.9 7.3 15.8 17.5 |
150Sm(d,2p)
152Sm(d,2p2n) 154Sm(d,2p4n) |
-4896.2
-18750.4 -32585.6 |
|
Nuclide
Decay path |
Half-life | Eγ(keV) | Iγ(%) | Contributing reaction |
Q-value
(keV) |
|
149Pm
-: 100 % |
53.08 h | 285.95 | 3.1 |
149Sm(d,2p)
150Sm(d,2pn) 152Sm(d,2p3n) 154Sm(d,2p5n) |
-2513.63
-10500.32 -24354.47 -38189.66 |
|
155Eu
-: 100 % |
4.753 a |
86.5479
105.3083 |
30.7
21.1 |
154Sm(d,n) | 4427.03 |
|
154gEu
-: 99.982 |
8.601 a |
123.0706
723.3014 873.1834 996.29 1004.76 1274.429 |
40.4
20.06 12.08 10.48 18.01 34.8 |
154Sm(d,2n) | -3724.26 |
|
152m2Eu
IT 147.81 keV |
96 min | 89.847 | 69.9 |
152Sm(d,2n)
154Sm(d,4n) |
-4881.52∗
-18716.71∗ |
|
148mPm
-: 100 % 137.9 keV |
41.29 d |
288.11
414.07 432.745 550.284 629.987 725.673 915.331 1013.808 |
12.56
18.66 5.33 94.5 89 32.7 17.10 20.20 |
148Sm(d,2p)
149Sm(d,2pn) 150Sm(d,2p2n) 152Sm(d,2p4n) 154Sm(d,2p6n) |
-3913.21∗
-9783.56∗ -17770.25∗ -31624.4∗ -45459.59∗ |
|
148gPm
-: 100 % |
5.368 d |
550.27
914.85 1465.12 |
22.0
11.5 22.2 |
148Sm(d,2p)
149Sm(d,2pn) 150Sm(d,2p2n) 152Sm(d,2p4n) 154Sm(d,2p6n) |
-3913.21
-9783.56 -17770.25 -31624.4 -45459.59 |
|
146Pm
: 66.0 % -: 34.0 % |
5.53 a |
453.88
735.93 |
65.0
22.5 |
147Sm(d,2pn)
148Sm(d,2p2n) 149Sm(d,2p3n) 150Sm(d,2p4n) 152Sm(d,2p6n) 154Sm(d,2p8n) |
-9325.34
-17466.72 -23337.07 -31323.76 -37518.85 -59013.09 |
|
144Pm
: 100 % |
363 d |
476.78
618.01 696.49 |
43.8
98 99.490 |
147Sm(d,2p3n)
148Sm(d,2p4n) 149Sm(d,2p5n) 150Sm(d,2p6n) 152Sm(d,2p8n) |
-23506
-31647 -37517 -45504 -59538 |
|
143Pm
: 100 % |
265 d | 741.98 | 38.5 |
147Sm(d,2p4n)
148Sm(d,2p5n) 149Sm(d,2p6n) 150Sm(d,2p7n) |
-30033.03
-38174.41 -44044.76 -52031.45 |
Increase Q-values if compound particles are emitted: np-d, +2.2 MeV; 2np-t, +8.48 MeV; n2p-3He, +7.72 MeV; 2n2p-a, +28.30 MeV
*Decrease Q-values for isomeric states with level energy of the isomer
3 Model calculations
For theoretical estimation the updated ALICE-IPPE-D [14] and EMPIRE-D [15] codes were used. [16, 17]. Results of ALICE-IPPE-D for excited states were obtained by applying the isomeric ratios derived from the EMPIRE-D code to the total cross-sections calculated by ALICE-IPPE-D. For a comparison of the experimental the widely available theoretical data from the TENDL-2012 [18] library (based on the modified TALYS code [19]) are also presented.
4 Results and discussion
4.1 Cross sections
The cross-sections for radioisotopes of Eu and Pm produced in the bombardment of natSm with deuterons are tabulated in Tables 3, 4 and 5. The numerical values for 145Eu, 145,153Sm can be found in our previous publication [4]. The comparison with the theory is shown in Figs 1-22. We present the TENDL-2012 values up to 60 MeV to illustrate the tendency of the excitation functions above the experimentally measured energy range. The data for production of 145Eu, 145Sm and 153Sm are presented only in graphical form as the numerical data are available in [4]. The contributing reactions and their Q-values are listed in Table 2. We do not explicitly discuss the contribution of the very low half-life isomeric states decaying completely by isomeric transition to the ground state.
4.1.1 Production of radioisotopes of europium
4.1.1.1 Production cross-sections of 155Eu
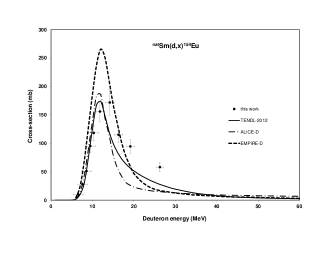
The long-lived 155Eu (GS, Jπ=5/2+, T1/2 = 4.753 a, : 100 %) is produced directly via (d,xn) reactions and from the -decay of the short-lived parent 155Sm (22.3 min). As it was mentioned, the typical cooling time for the first series of -spectra measurement was around 6 h and hence we could not measure the 155Sm contribution separately. The cross-section of 155Eu is cumulative after complete decay of the 155Sm. The experimental data are compared with the theoretical results in the Fig. 1 (both the direct and cumulative theoretical cross-section are presented). The TENDL-2012 values underestimate by a factor of two the cumulative cross-sections due to the known underestimation of the (d,p) process in the TALYS code. The agreement with ALICE-D and EMPIRE-D is acceptable good. The curve calculated by systematics [20] gives also an acceptable estimation.

4.1.1.2 Production cross-sections of 154Eu
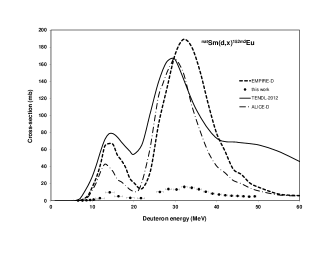
The production cross-sections of the 154Eu ground state (GS, Jπ = 3- , T1/2 = 8.601 a, : 99.982 %, : 0.018 %) contain the direct production and the contribution of complete decay of the short-lived isomeric state (MS, E(level) = 145.3 keV, Jπ = 8- , T1/2 = 46.0 min, IT: 100 %). The agreement between the experimental data and the TENDL-2012 and ALICE-D results (cumulative) for the production of 154Eu (m+) is good below 15 MeV (Fig. 2). The overestimation of the EMPIRE-D is significant even in the lower energy region.
4.1.1.3 Production cross-sections of different levels of 152Eu
The radionuclide 152Eu has apart from its long-lived ground state (GS, T1/2 = 13.537 a, Jπ = 3-, : 27.9 %, : 72.1 %) two longer-lived isomeric states with complex decay scheme. The high spin, rather short-lived, isomer 152m2Eu (MS2, E(level) = 147.81 keV, Jπ = 8-, T1/2 = 96 min, IT 100 %) decays totally by isomeric transition to the ground state, without population of the lower excited 152m1Eu level. This latter metastable state with zero spin (MS1, E(level) = 45.5998 keV, Jπ = 0-, T1/2 = 9.3116 h, : 72 %, : 28 %) decays by -decay to stable 152Gd and does not populate the ground state. Independent -rays are emitted in the decay of the different states so that production cross-section for all three can be determined
4.1.1.3a Production cross-sections of 152m2Eu
The results for the high spin isomer (MS2, E(level) = 147.81 keV, Jπ = 8-, T1/2 = 96 min, IT 100 %) are shown in Fig. 3. Although in the experimental values the contribution of reactions on the two high mass stable target isotopes can clearly be seen, and the three codes represent well the shape and position of the maxima, there are large disagreements with the theoretical data, which are predicting much higher cross-sections.
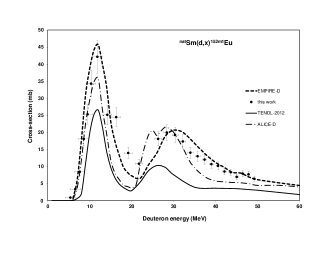
4.1.1.3b Production cross-sections of 152m1Eu
The results for the low spin isomer (MS1, E(level) = 45.5998 keV, Jπ = 0-, T1/2 = 9.3116 h, : 72 %, : 28 %) are shown in Fig. 4. Experimentally the contribution of the reactions on 152Sm and 154Sm can be distinguished. The codes describe now rather well the experimental values, with TENDL-2012 values being about 50 % too low.
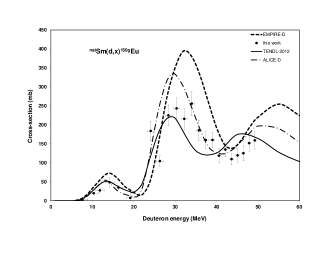
4.1.1.3c Production cross-sections of 154gEu
The measured cross-sections for production of the ground state (GS, T1/2 = 13.537 a, Jπ =3-, : 27.9 %, : 72.1 %) are shown in Fig. 5. As stated before, in the measurement taken at EOB + 70 h, and 530 h, in addition to direct production the contribution of total decay of the high spin state 152m2Eu (IT: 100 %) is also included (m2+). In the energy region below 20 MeV ALICE-D and TENDL give acceptable estimation and EMPIRE-D overestimates around the first peak region. Above 25 MeV EMPIRE-D gives better result and the other two codes underestimate.

4.1.1.4 Production cross-sections of 150mEu
The cross-section of the long-lived isomeric state (MS, E(level) = 42.1 keV, Jπ = 0- T1/2 = 12.8 h, : 11 % , : 89 %, IT 5.*10-8) is shown in Fig. 6. The three model codes reproduce the shape of the excitation function but overestimate the experimental data above 25 MeV deuteron energy.

4.1.1.5 Production cross-sections of 150gEu
Only direct production has to be considered as practical, no contribution from the decay of 150mEu exists (IT 10-8, see previous paragraph). The independent cross-sections for direct production of 154gEu (GS, Jπ = 5-, T1/2 = 36.9 a, : 100 % ) are compared with the theory in Fig 7. The three codes represent well the shape of the experimental data and the values of the maximum of the (d,n) reaction and TENDL-2012 also gives acceptable results at energies above 30 MeV.
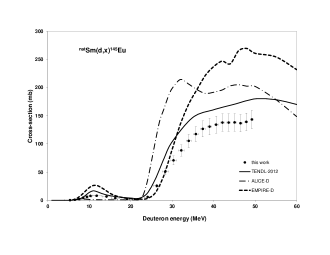
4.1.1.6 Production cross-sections of 149Eu
There are large disagreements between the results of the theoretic models and the experimental data for production of 149Eu (GS, Jπ = 5/2+, T1/2 = 93.1 d, : 100 %) (Fig. 8). At low energy range the agreement with TENDL and ALICE-D is acceptable good, but the EMPIRE overestimation is significant. At the high energy range the shape of the ALICE-D and EMPIRE-D is similar to the experiment but the magnitude is much higher. The TENDL underestimates the peak for the (d,5n) reaction and shows a separate contribution for the (d,7n) reaction, lumped in the experiment and the two other codes.

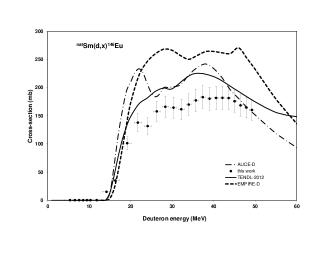
4.1.1.7 Production cross-sections of 148Eu
The experimental and theoretical data for cross-sections of 148Eu (GS, Jπ = 5-, T1/2 = 54.5 d, : 100 %, : 9.4*10-7 %) are compared in Fig. 9. In the energy domain considered reactions on 4 stable Sm isotopes can contribute below 35 MeV, which is reflected in the results of TENDL-2012 and ALICE-D. The shape for EMPIRE-D is much smoother especially at higher energies, where the reaction on 152Sm seems to be overestimated. The agreement with our experimental results below the threshold of the (d,6n) reaction is more or less acceptable, but large differences in energy dependency appear with the TENDL-2012 data above 35 MeV.
4.1.1.8 Production cross-sections of 147Eu
There is acceptable agreement in the shape between the experiment and the theory for 147Eu (GS, Jπ = 5/2+, T1/2 = 24.1 d, : 99.9978 %, : 0.0022 %) cross-sections (Fig. 10). The experiment shows less detailed the contribution on the different stable Sm target isotopes. The ALICE and EMPIRE codes overestimate the experimental data in the different peak regions and show energy shift with TENDL-2012 for the onset of the (d,7n) and (d,9n) reactions.

4.1.1.9 Production cross-sections of 146Eu
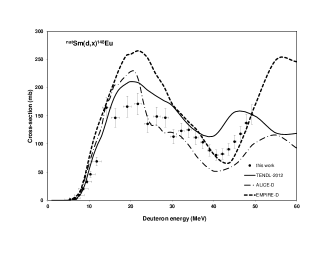
The experimental results correspond well to the overall shape of the more detailed theoretical descriptions of the excitation function for 146Eu (GS, Jπ = 4-, T1/2 = 4.59 d, :100 %). For all models the overestimation in the whole energy range is significant (Fig. 11).
4.1.1.10 Production cross-sections of 145Eu
The production of 145Eu (GS, Jπ = 5/2+, T1/2 = 5.93 d, : 100 %) is in detail discussed in our previous work [4]. There are large overestimations in the magnitude in the theoretical results (Fig. 12) especially at energies above 30 MeV.
4.1.2 Production of radioisotopes of samarium
The -lines of the 155Sm due to the short half-life (22.3 min) comparing to the used cooling times were not detected.
4.1.2.1 Production cross-sections of 153Sm
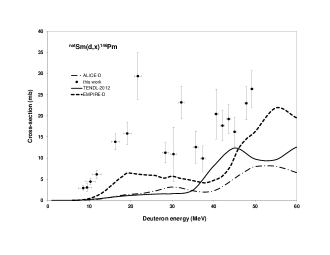
The medically relevant radionuclide 153Sm (GS, Jπ = 3/2+, T1/2 = 46.50 h, : 100 %) is mainly produced directly through (d,p) and (d,p2n) reactions and through the decay of the short-lived 153Pm parent (GS, Jπ = 5/2-, T1/2 = 5.25 min, : 100 %.) The presented cross-sections are cumulative, obtained from spectra measured after the decay of 153Pm (Fig. 13). More discussion on the production of 153Sm can be found in our previous work [4]. There are large disagreements between the experiment and the theory both in shape and in magnitude confirming earlier findings on the different modeling of the breakup reaction in the different codes.

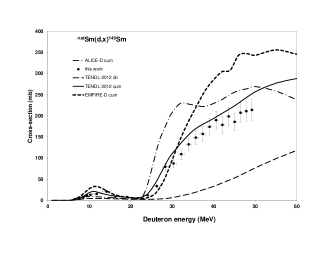
4.1.2.2 Production cross-sections of 145Sm
The cross-sections for cumulative production of 145Sm (GS, Jπ = 7/2-, T1/2 = 340 d, : 100 %) are shown in Fig. 14. It includes the direct production through (d,pxn) reactions and the contribution from the decay of 145Eu (GS, Jπ = 5/2+, T1/2 = 5.93 d, : 100 %) The production is discussed in more detail in [4]. The overestimation by the ALICE and EMPIRE is significant, cumulative TENDL calculation gives acceptable agreement.
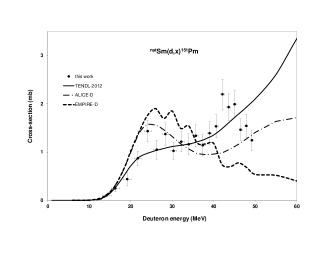
4.1.3 Production of radioisotopes of promethium
4.1.3.1 Production cross-sections of 151Pm
The cross-section of the 151Pm (GS, Jπ =5/2+, T1/2 = 28.40 h, : 100 %) is practically independent, direct production cross-section through (d,2pn) reaction on 152Sm taking into account that the cross-section of the 151Nd (12.44 min) is negligible small (d,3pxn) and the half-life of the 151Sm other parent isotope is very high (90 a). The agreement with the theoretical data is acceptable good (Fig. 15), especially with TENDL below 40 MeV. Over this energy the judgment is difficult because of the large scattering in the experimental points.
4.1.3.2 Production cross-sections of 150Pm
The radionuclide 150Pm (GS, Jπ = (1-), T1/2 = 2.68 h, ) is a closed nuclei from the point of view of decay of parents. It is hence produced only directly via (d,2pxn) reactions. The measured cross-sections are higher than the theoretical predictions, especially in the lower energy region corresponding to a combination of 150Sm(d,2p) and 152Sm(d,) reactions (Fig. 16).

4.1.3.3 Production cross-sections of 149Pm
Neglecting the small contribution from decay 149 Nd (GS, Jπ = 5/2-,T1/2 = 1.728 h, : 100 %) produced by (d,3pxn) reactions with low cross-sections, the 149Pm (GS, Jπ = 7/2+, 53.08 h, : 100 %) is produced only directly. We have only few experimental points due to the low cross-sections. Only in the measurements of a few target foils at higher energies (long measurements) was the statistics sufficient to calculate reliable cross-sections (Fig 17). According the few measured point the TENDL-2012 estimation seems to be acceptable.
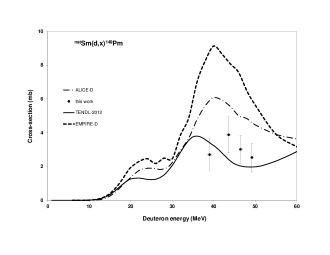
4.1.3.4 Production cross-sections of 148Pm
The theoretical cross-sections of the directly produced 148Pm (MS, E(level)= 137.93 keV, Jπ = 5-,6-, T1/2 = 41.29 d, IT: 4.2 6 %, : 95.8 %) are shown in Fig 18. The 148Pm (T1/2 = 41.29 d) and the simultaneously produced 148Eu (T1/2 = 54.5 d) have similar half-lives and practically all -lines of 148Pm are common with -lines of 148Eu. The 148Eu has significantly higher cross-sections therefore the separation of the gamma intensities can be done with very large uncertainties. The measurements show much larger values than any of the theoretical calculations up to 30 MeV, and only the EMPIRE estimation is acceptable between 30 and 40 MeV and that of ALICE in the 45-50 MeV region.

4.1.3.5 Production cross-sections of 148gPm
The ground state of 148gPm (GS, Jπ= 1-, T1/2 = 5.368 d, : 100 %) is produced directly and from the weak isomeric decay of the longer-lived metastable state (41.29 d, IT: 4.2 %,). We were not able to identify in any of our spectra the only strong independent -line (1465.12 keV, 22.2 %) of 148gPm. In principle it is possible to obtain data for direct production of 148gPm from an analysis of the time dependence of the count rate for 550 keV and 915 keV -lines common between the ground state, the isomeric state and the 148Eu, but due to the low cross-section we came to the conclusion not to do an unreliable separation. The theoretical results are shown in Fig. 19.
4.1.3.6 Production cross-sections of 147Pm
The 147Pm was not quantified due to its long half-life (2.6234 a), the low abundance of 121 keV -line (0.00285 %) and the overlapping -lines from long-lived Eu radio-products.
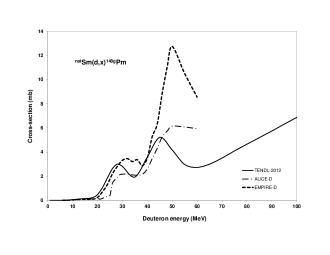
4.1.3.7 Production cross-sections of 146Pm
The 146Pm (GS, Jπ = 3-, T1/2 = 5.53 a, : 66.0 %) can only be produced by (d,2pxn) reactions directly. The excitation function is shown in Fig. 20. The experimental data are higher (but they are scattered and have large uncertainties) compared to the results of the model calculations.
4.1.3.8 Production cross-sections of 145Pm
The -lines of the 145Pm were not detected due to the long half-life (17.7 a) and it has only low energy low intensity -lines (and complex X-ray spectra).
4.1.3.9 Production cross-sections of 144Pm
The experimental and theoretical data for production of the radioisotope 144Pm (GS, Jπ = 5-, T1/2 = 363 d, : 100 %) are shown in Fig. 21. As 144Pm is a closed nuclei there is no parent decay possible. The experimental data are systematically lower compared to ALICE-D and EMPIRE-D and a little higher than the TALYS(TENDL) results.

4.1.3.10 Production cross-sections of 143Pm
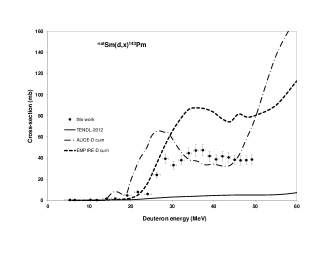
Our experimental cross-sections of the 143Pm (GS, Jπ = 5/2+, 265 d, : 100 %) contain the direct production and the total contribution from the short lived parent 143Sm states that we could not asses in this study: from 143mSm (MS, E(level) = 753.9916 keV, Jπ = 11/2-, T1/2 = 66 s, : 0.24 %, IT: 99.76 %) and 143gSm (GS, Jπ = 3/2+, T1/2 = 8.75 min, : 100 %). As it is shown in Fig. 22 the ALICE-D prediction is very close to the experimental data above 30 MeV, but under this energy EMPIRE-D gives much better results. The underestimation of TENDL-2012 is significant. It has to be mentioned that the degree of detailed representation of the different contributing reactions is quite different for the three codes.
|
Energy
(MeV) |
155Eu
(mb) |
154Eu
(mb) |
152m2Eu
(mb) |
152m1Eu
(mb) |
152gEu
(mb) |
150mEu
(mb) |
150gEu
mb) |
149Eu
(mb) |
|||||||||
|---|---|---|---|---|---|---|---|---|---|---|---|---|---|---|---|---|---|
| 49.2 | 0.3 | 6.4 | 1.1 | 5.0 | 0.6 | 6.4 | 0.8 | 15.6 | 2.0 | 158.9 | 22.6 | 189.6 | 21.5 | ||||
| 47.9 | 0.3 | 4.7 | 0.5 | 7.7 | 0.9 | 41.9 | 15.1 | 16.7 | 2.1 | 151.8 | 21.0 | 212.6 | 24.1 | ||||
| 46.5 | 0.4 | 5.1 | 0.6 | 7.9 | 0.9 | 76.1 | 20.2 | 20.1 | 2.5 | 125.2 | 20.1 | 233.1 | 26.4 | ||||
| 45.1 | 0.4 | 5.5 | 0.6 | 6.9 | 0.8 | 59.4 | 15.4 | 18.4 | 2.3 | 119.5 | 17.9 | 243.9 | 27.5 | ||||
| 43.6 | 0.4 | 5.7 | 0.6 | 8.3 | 1.0 | 82.5 | 15.1 | 19.2 | 2.4 | 109.6 | 15.2 | 256.6 | 28.9 | ||||
| 42.1 | 0.5 | 10.7 | 2.8 | 6.3 | 0.7 | 8.5 | 1.0 | 132.7 | 21.4 | 23.4 | 2.8 | 134.9 | 19.4 | 249.0 | 28.1 | ||
| 40.6 | 0.5 | 10.3 | 3.3 | 7.2 | 0.8 | 10.2 | 1.2 | 159.8 | 25.9 | 18.7 | 2.3 | 118.7 | 18.2 | 246.5 | 27.9 | ||
| 39.0 | 0.5 | 10.8 | 3.0 | 8.2 | 0.9 | 10.7 | 1.2 | 148.3 | 22.2 | 17.1 | 2.1 | 160.1 | 21.0 | 220.2 | 24.9 | ||
| 37.4 | 0.6 | 10.5 | 1.2 | 12.0 | 1.4 | 144.6 | 23.5 | 18.3 | 2.2 | 159.8 | 21.7 | 181.4 | 20.6 | ||||
| 35.7 | 0.6 | 13.4 | 1.5 | 13.0 | 1.5 | 116.0 | 24.8 | 22.5 | 2.7 | 185.4 | 27.3 | 149.4 | 17.2 | ||||
| 34.0 | 0.6 | 10.0 | 3.7 | 15.1 | 1.7 | 14.1 | 1.6 | 186.4 | 27.9 | 28.0 | 3.3 | 255.9 | 32.5 | 106.0 | 12.3 | ||
| 32.2 | 0.7 | 17.5 | 3.5 | 16.1 | 1.8 | 17.3 | 2.0 | 211.5 | 27.9 | 34.1 | 4.0 | 215.8 | 26.9 | 80.5 | 9.4 | ||
| 30.3 | 0.7 | 11.5 | 1.8 | 13.0 | 1.5 | 19.2 | 2.2 | 174.5 | 20.6 | 21.9 | 2.5 | 243.3 | 27.7 | 139.7 | 15.7 | ||
| 28.4 | 0.8 | 9.6 | 2.8 | 13.6 | 1.5 | 20.0 | 2.3 | 104.4 | 54.3 | 28.1 | 3.3 | 224.9 | 27.9 | 112.1 | 12.8 | ||
| 26.3 | 0.8 | 24.7 | 3.8 | 58.2 | 8.5 | 10.2 | 1.1 | 18.1 | 2.1 | 170.3 | 22.7 | 19.5 | 2.4 | 104.4 | 14.4 | 101.2 | 11.5 |
| 24.1 | 0.9 | 12.4 | 8.0 | 151.2 | 28.1 | 183.8 | 25.7 | 73.8 | 8.9 | ||||||||
| 21.7 | 0.9 | 29.1 | 5.7 | 3.0 | 0.4 | 10.8 | 1.2 | 6.9 | 1.1 | 127.0 | 14.7 | ||||||
| 19.2 | 1.0 | 39.3 | 4.9 | 94.6 | 11.9 | 3.2 | 0.4 | 14.0 | 1.6 | 71.9 | 14.5 | 6.9 | 1.0 | 7.4 | 17.8 | 128.7 | 14.6 |
| 16.3 | 1.0 | 48.0 | 5.5 | 115.1 | 13.3 | 5.1 | 0.6 | 24.5 | 2.8 | 116.1 | 14.5 | 15.3 | 1.8 | 34.8 | 5.7 | 137.0 | 15.4 |
| 14.2 | 1.1 | 36.7 | 5.1 | 171.9 | 22.2 | 9.7 | 1.1 | 25.1 | 2.9 | 133.7 | 20.5 | 24.3 | 3.1 | 48.4 | 12.2 | 114.9 | 13.2 |
| 11.8 | 1.1 | 59.2 | 6.7 | 156.0 | 17.7 | 2.9 | 0.3 | 42.1 | 4.8 | 142.7 | 16.7 | 18.3 | 2.1 | 27.1 | 4.2 | 102.7 | 11.6 |
| 10.3 | 1.2 | 58.1 | 6.6 | 118.3 | 13.4 | 1.3 | 0.2 | 34.3 | 3.9 | 89.2 | 10.5 | 14.3 | 1.7 | 19.7 | 3.0 | 73.8 | 8.3 |
| 9.5 | 1.2 | 48.8 | 5.8 | 95.3 | 11.9 | 0.7 | 0.1 | 25.3 | 2.9 | 55.8 | 9.6 | 11.2 | 1.3 | 52.4 | 6.0 | ||
| 8.6 | 1.2 | 39.4 | 4.5 | 51.2 | 6.0 | 0.4 | 0.0 | 18.1 | 2.0 | 29.8 | 4.3 | 7.5 | 0.9 | 36.3 | 4.1 | ||
| 7.6 | 1.2 | 24.8 | 2.8 | 27.9 | 3.4 | 0.2 | 0.0 | 8.4 | 1.0 | 13.0 | 2.2 | 3.4 | 0.5 | 2.4 | 0.9 | 18.6 | 2.1 |
| 6.6 | 1.2 | 12.7 | 1.5 | 10.2 | 1.5 | 0.1 | 0.0 | 3.4 | 0.4 | 9.8 | 1.9 | 1.1 | 0.2 | 8.0 | 0.9 | ||
| 5.4 | 1.3 | 5.3 | 0.6 | 0.9 | 0.1 | 0.6 | 0.1 | 2.8 | 0.3 | ||||||||
|
Energy
(MeV) |
148Eu
(mb) |
147Eu
(mb) |
146Eu
(mb) |
151Pm
(mb) |
150Pm
(mb) |
149Pm
(mb) |
148mPm
(mb) |
146Pm
(mb) |
|||||||||
|---|---|---|---|---|---|---|---|---|---|---|---|---|---|---|---|---|---|
| 49.2 | 0.3 | 152.2 | 17.1 | 106.2 | 12.7 | 160.3 | 18.0 | 1.2 | 0.2 | 4.4 | 0.5 | 2.5 | 0.8 | 2.5 | 0.3 | 26.3 | 4.3 |
| 47.9 | 0.3 | 137.2 | 15.4 | 118.0 | 13.9 | 164.6 | 18.5 | 1.5 | 0.2 | 4.0 | 0.5 | 2.8 | 0.4 | 22.9 | 3.9 | ||
| 46.5 | 0.4 | 117.8 | 13.3 | 141.1 | 16.3 | 168.4 | 18.9 | 1.5 | 0.2 | 4.4 | 0.5 | 3.0 | 0.8 | 2.4 | 0.3 | ||
| 45.1 | 0.4 | 104.1 | 11.7 | 130.4 | 15.3 | 175.8 | 19.7 | 2.0 | 0.3 | 3.7 | 0.4 | 1.2 | 0.2 | 16.2 | 3.4 | ||
| 43.6 | 0.4 | 90.4 | 10.2 | 115.4 | 13.6 | 181.4 | 20.4 | 1.9 | 0.3 | 2.8 | 0.3 | 3.9 | 1.1 | 1.4 | 0.2 | 19.2 | 3.5 |
| 42.1 | 0.5 | 82.2 | 9.3 | 146.1 | 17.0 | 181.7 | 20.4 | 2.2 | 0.3 | 2.6 | 0.3 | 1.4 | 0.2 | 17.7 | 3.5 | ||
| 40.6 | 0.5 | 80.2 | 9.1 | 102.1 | 11.9 | 181.6 | 20.4 | 1.5 | 0.2 | 3.1 | 0.4 | 20.4 | 5.9 | ||||
| 39.0 | 0.5 | 88.6 | 10.0 | 175.7 | 20.2 | 180.3 | 20.2 | 1.4 | 0.2 | 2.9 | 0.3 | 2.7 | 0.9 | ||||
| 37.4 | 0.6 | 102.9 | 11.6 | 177.6 | 20.5 | 182.9 | 20.5 | 1.1 | 0.2 | 3.8 | 0.4 | 1.9 | 0.3 | 9.9 | 3.0 | ||
| 35.7 | 0.6 | 111.4 | 12.6 | 179.5 | 20.7 | 177.2 | 19.9 | 1.3 | 0.2 | 3.2 | 0.4 | 1.7 | 0.3 | 12.6 | 3.8 | ||
| 34.0 | 0.6 | 124.9 | 14.1 | 201.5 | 23.0 | 169.9 | 19.1 | 1.2 | 0.2 | 4.3 | 0.5 | 2.5 | 0.3 | ||||
| 32.2 | 0.7 | 123.1 | 13.9 | 198.4 | 22.8 | 161.5 | 18.1 | 1.2 | 0.2 | 4.2 | 0.5 | 1.9 | 0.3 | 23.2 | 3.8 | ||
| 30.3 | 0.7 | 112.9 | 12.7 | 166.1 | 18.9 | 164.4 | 18.5 | 1.0 | 0.2 | 3.4 | 0.4 | 2.3 | 0.3 | 10.9 | 6.4 | ||
| 28.4 | 0.8 | 146.6 | 16.5 | 184.0 | 20.9 | 165.9 | 18.6 | 1.4 | 0.2 | 3.8 | 0.4 | 2.7 | 0.4 | 11.3 | 2.4 | ||
| 26.3 | 0.8 | 148.7 | 16.7 | 188.9 | 21.7 | 157.7 | 17.7 | 1.0 | 0.2 | 3.4 | 0.4 | 3.0 | 0.4 | ||||
| 24.1 | 0.9 | 135.5 | 15.3 | 163.5 | 18.7 | 131.7 | 14.8 | 1.4 | 0.2 | 2.1 | 0.3 | ||||||
| 21.7 | 0.9 | 171.0 | 19.2 | 156.9 | 17.8 | 137.8 | 15.5 | 0.9 | 0.2 | 1.6 | 0.2 | 3.40 | 0.41 | 29.4 | 5.5 | ||
| 19.2 | 1.0 | 166.3 | 18.7 | 152.3 | 17.5 | 101.2 | 11.4 | 0.44 | 0.13 | 1.6 | 0.2 | 2.69 | 0.34 | 15.8 | 2.7 | ||
| 16.3 | 1.0 | 146.2 | 16.5 | 145.6 | 16.7 | 35.1 | 3.9 | 0.25 | 0.07 | 2.2 | 0.2 | 2.99 | 0.35 | 13.8 | 1.9 | ||
| 14.2 | 1.1 | 164.4 | 18.5 | 173.4 | 19.8 | 14.9 | 1.7 | 0.10 | 0.02 | 2.2 | 0.3 | 2.77 | 0.35 | ||||
| 11.8 | 1.1 | 69.0 | 7.8 | 89.0 | 10.3 | 0.25 | 0.04 | 1.8 | 0.2 | 1.47 | 0.19 | 6.1 | 1.0 | ||||
| 10.3 | 1.2 | 46.1 | 5.2 | 61.8 | 7.2 | 0.23 | 0.04 | 1.3 | 0.1 | 1.03 | 0.14 | 4.4 | 0.7 | ||||
| 9.5 | 1.2 | 32.8 | 3.7 | 41.1 | 4.8 | 0.19 | 0.03 | 0.77 | 0.09 | 3.0 | 0.9 | ||||||
| 8.6 | 1.2 | 20.2 | 2.3 | 22.0 | 2.8 | 0.26 | 0.04 | 0.46 | 0.05 | 0.40 | 0.07 | 2.9 | 0.5 | ||||
| 7.6 | 1.2 | 9.2 | 1.0 | 11.4 | 1.4 | 0.19 | 0.03 | 0.31 | 0.04 | 0.15 | 0.03 | ||||||
| 6.6 | 1.2 | 3.8 | 0.4 | 4.1 | 0.5 | 0.26 | 0.03 | 0.17 | 0.02 | ||||||||
| 5.4 | 1.3 | 1.3 | 0.2 | 1.7 | 0.2 | 0.19 | 0.02 | ||||||||||
|
Energy
(MeV) |
144Pm
(mb) |
143Pm
(mb) |
|||
| 49.2 | 0.3 | 4.9 | 0.7 | 38.6 | 4.4 |
| 47.9 | 0.3 | 6.3 | 0.8 | 37.9 | 4.3 |
| 46.5 | 0.4 | 6.9 | 0.9 | 37.7 | 4.4 |
| 45.1 | 0.4 | 5.6 | 0.7 | 38.4 | 4.4 |
| 43.6 | 0.4 | 6.6 | 0.8 | 40.6 | 4.6 |
| 42.1 | 0.5 | 5.5 | 0.7 | 41.6 | 4.7 |
| 40.6 | 0.5 | 6.7 | 0.9 | 38.7 | 4.5 |
| 39.0 | 0.5 | 6.5 | 0.8 | 41.8 | 4.8 |
| 37.4 | 0.6 | 5.8 | 0.8 | 47.4 | 5.4 |
| 35.7 | 0.6 | 4.6 | 0.7 | 47.1 | 5.4 |
| 34.0 | 0.6 | 5.5 | 0.8 | 44.6 | 5.1 |
| 32.2 | 0.7 | 4.2 | 0.6 | 38.0 | 4.3 |
| 30.3 | 0.7 | 33.3 | 3.9 | ||
| 28.4 | 0.8 | 4.5 | 0.6 | 39.3 | 4.5 |
| 26.3 | 0.8 | 2.7 | 0.4 | 24.0 | 2.7 |
| 24.1 | 0.9 | 3.8 | 0.6 | 6.0 | 0.7 |
| 21.7 | 0.9 | 7.8 | 1.2 | ||
| 19.2 | 1.0 | 1.1 | 0.2 | 4.6 | 0.6 |
| 16.3 | 1.0 | 0.7 | 0.1 | 1.6 | 0.3 |
| 14.2 | 1.1 | 1.6 | 0.7 | ||
| 11.8 | 1.1 | 0.20 | 0.27 | ||
| 10.3 | 1.2 | 0.44 | 0.11 | ||
| 9.5 | 1.2 | ||||
| 8.6 | 1.2 | ||||
| 7.6 | 1.2 | ||||
| 6.6 | 1.2 | 0.24 | 0.06 | ||
| 5.4 | 1.3 | 0.32 | 0.05 | ||
4.2 Integral yields
The integral yields as a function of the incident deuteron energy was calculated from a cubic spline fit to our experimental data and are shown in Fig. 23 and Fig. 24 for Eu and Sm, Pm radionuclides respectively. The values represent so called physical yield, considering an instantaneous short irradiation and measuring immediately after EOB allowing to neglect all corrections for decay [12]. The calculated integral yields for 148Eu,150mEu and 154gEu are compared with the only experimental results of Dmitriev et al. [3]. In the case of 148,150,151Eu the agreement is acceptable.

5 Summary and conclusion
We present experimental cross-sections natSm(d,xn)155,154,152m2,152m1,152g,150m,150g,149,148,147,146Eu, natSm(d,x)153,145Sm and natSm(d,x)151,150,149,148m,148g,145,144,143Pm up to 50 MeV measured for the first time. Our excitation functions are relative to recommended monitor reactions excitation functions, re-measured simultaneously over the whole covered energy range, and are hence very accurate concerning energy scale and number of bombarding particles. The experimental data were compared with the results of our theoretical calculations using the ALICE-D and EMPIRE-D codes and with results in the TENDL-2012 on-line library based on the latest version of the TALYS code. The predictions of the model codes are quite different and disparate. Our experimental data are in average lower than the results of the theoretical codes, with the largest overestimation for EMPIRE-D. The systematic disagreement with the experimental data underlines the importance of the experimental data as basis for improvement of description of reaction mechanisms in the codes and for upgrading of the input parameter libraries. The measured data can be useful in for determining activation in different applications of samarium where charged particle irradiation fields are present:
-
1.
It is used in magnets, in alloys with cobalt
-
2.
It is used in airspace and defense industries (samarium permanent magnets that are stable at high temperatures, precision-guided weapons, ”white noise” production in stealth technology.
Two isotopes of Sm are relevant in nuclear medicine: 145Sm is used for brachytherapy and 153Sm for treatment of bone pain. Although these radioisotopes are mostly produced in research reactors by neutron caption on samarium (enriched targets if high yields and radionuclidic purity is needed) low energy deuteron induced reactions on enriched 144Sm or 152Sm can be an alternative for local production. 149Sm is a strong neutron absorber and it is therefore added to the control rods of nuclear reactors. Knowledge of the cross-sections of the activation products induced by secondary products of neutron reactions has also importance.
6 Acknowledgements
This work was done in the frame MTA-FWO research project. The authors acknowledge the support of research projects and of their respective institutions in providing the materials and the facilities for this work.
References
- [1] F. Tárkányi, A. Hermanne, F. Ditrói, S. Takács, B. Király, G. Csikai, M. Baba, H. Yamazaki, M. S. Uddin, A. V. Ignatyuk, S. M. Qaim, Systematic study of activation cross-sections of deuteron induced reactions used in accelerator applications (25-28 Oct., 2010 2011).
- [2] F. Tárkányi, S. Takács, F. Ditroi, J. Csikai, A. Hermanne, A. V. Ignatyuk, Activation cross-section measurement of deuteron induced reactions on cerium for biomedical applications and for development of reaction theory, Nuclear Instruments & Methods in Physics Research B 316 (2013) 22–32.
- [3] P. P. Dmitriev, N. N. Krasnov, G. A. Molin, Radioactive nuclide yields for thick target at 22 mev deuterons energy, Yadernie Konstanti 34 (4) (1982) 38.
- [4] F. Tárkányi, A. Hermanne, S. Takács, F. Ditrói, J. Csikai, A. V. Ignatyuk, Cross-sections of deuteron induced reactions on natsm for production of the therapeutic radionuclide 145sm and 153sm, Applied Radiation and Isotopes submitted.
- [5] Canberra, http://www.canberra.com/products/radiochemistry_lab/genie-2000-software.asp. (2000).
- [6] G. Székely, Fgm - a flexible gamma-spectrum analysis program for a small computer, Computer Physics Communications 34 (3) (1985) 313–324.
- [7] F. Tárkányi, F. Szelecsńyi, S. Takács, Determination of effective bombarding energies and fluxes using improved stacked-foil technique, Acta Radiologica, Supplementum 376 (1991) 72.
- [8] R. R. Kinsey, C. L. Dunford, J. K. Tuli, T. W. Burrows, Nudat 2.6 http://www.nndc.bnl.gov/nudat2/ (1997).
- [9] B. Pritychenko, A. Sonzogni, Q-value calculator, http://www.nndc.bnl.gov/qcalc (2003).
- [10] H. H. Andersen, J. F. Ziegler, Hydrogen stopping powers and ranges in all elements. The stopping and ranges of ions in matter, Volume 3., The Stopping and ranges of ions in matter, Pergamon Press, New York, 1977.
- [11] I.-B. of-Weights-and Measures, Guide to the expression of uncertainty in measurement, 1st Edition, International Organization for Standardization, Genève, Switzerland, 1993.
- [12] M. Bonardi, The contribution to nuclear data for biomedical radioisotope production from the milan cyclotron facility (1987).
- [13] F. Tárkányi, S. Takács, K. Gul, A. Hermanne, M. G. Mustafa, M. Nortier, P. Oblozinsky, S. M. Qaim, B. Scholten, Y. N. Shubin, Z. Youxiang, Beam monitor reactions (chapter 4). charged particle cross-section database for medical radioisotope production: diagnostic radioisotopes and monitor reactions., Tech. rep., IAEA (2001).
- [14] A. I. Dityuk, A. Y. Konobeyev, V. P. Lunev, Y. N. Shubin, New version of the advanced computer code alice-ippe, Tech. rep., IAEA (1998).
- [15] M. Herman, R. Capote, B. V. Carlson, P. Oblozinsky, M. Sin, A. Trkov, H. Wienke, V. Zerkin, Empire: Nuclear reaction model code system for data evaluation, Nuclear Data Sheets 108 (12) (2007) 2655–2715.
- [16] F. Tárkányi, A. Hermanne, S. Takács, K. Hilgers, S. F. Kovalev, A. V. Ignatyuk, S. M. Qaim, Study of the 192os(d,2n) reaction for, production of the therapeutic radionuclide 192ir in no-carrier added form, Applied Radiation and Isotopes 65 (11) (2007) 1215–1220.
- [17] A. Hermanne, F. Tárkányi, S. Takács, F. Ditrói, M. Baba, T. Ohtshuki, I. Spahn, A. V. Ignatyuk, Excitation functions for production of medically relevant radioisotopes in deuteron irradiations of pr and tm targets, Nuclear Instruments & Methods in Physics Research Section B-Beam Interactions with Materials and Atoms 267 (5) (2009) 727–736.
- [18] A. J. Koning, D. Rochman, S. van der Marck, J. Kopecky, J. C. Sublet, S. Pomp, H. Sjostrand, R. Forrest, E. Bauge, H. Henriksson, O. Cabellos, S. Goriely, J. Leppanen, H. Leeb, A. Plompen, R. Mills, Tendl-2013: Talys-based evaluated nuclear data library (2012).
- [19] A. J. Koning, D. Rochman, Modern nuclear data evaluation with the talys code system, Nuclear Data Sheets 113 (2012) 2841.
- [20] A. V. Ignatyuk, Phenomenological systematics of the (d,p) cross sections, http://www-nds.iaea.org/fendl3/000pages/rcm3/slides//ignatyuk_fendl-3(2011).