HST IMAGES REVEAL DRAMATIC CHANGES IN THE CORE OF IRC+10216
Abstract
IRC+10216 is the nearest carbon star with a very high mass-loss rate. The existence of a binary companion has been hinted by indirect observational evidence, such as the bipolar morphology of its nebula and a spiral-like pattern in its circumstellar material; however, to date, no companion has been identified. We have examined archival Hubble Space Telescope images of IRC+10216, and find that the images taken in 2011 exhibit dramatic changes in its innermost region from those taken at earlier epochs. The scattered light is more spread out in 2011. After proper motion correction, the brightest peak in 2011 is close to, but not coincident with, the dominant peak in previous epochs. A fainter point-like object was revealed at 05 from this brightest peak. We suggest that these changes at the core of IRC+10216 are caused by dissipation of intervening circumstellar dust, as indicated by the brightening trend in the lightcurve extracted from the Catalina photometric survey. We tentatively identify the brightest peak in 2011 as the primary star of IRC+10216 and the fainter point-like source as a companion. The cause of non-detections of the companion candidate in earlier epochs is uncertain. These identifications need to be verified by monitoring of the core of IRC+10216 at high resolution in the future.
1 INTRODUCTION
Direct detection of binary companions of asymptotic giant branch (AGB) stars is challenging because the companions are overwhelmed by the luminous AGB stars. Moreover, companions of very dusty “infrared” AGB stars can be totally obscured by the circumstellar envelopes (CSEs). To date, binary companions have been detected for only a small number of AGB stars with low mass-loss rates through composite spectra or lightcurves (Jorissen, 2003). There are indications that a significant fraction of AGB stars have binary companions, such as elliptical CSEs (Mauron et al., 2013) as expected from binary AGB stars (Huggins et al., 2009) and spiral-shell patterns in the CSEs (Mauron & Huggins, 2006; Mayer et al., 2011; Maercker et al., 2012; Kim et al., 2013; Mayer et al., 2014; Cernicharo et al., 2014; Decin et al., 2015) as modeled by AGB winds under the gravitational influence of binary companions (Theuns & Jorissen, 1993; Soker, 1994; Mastrodemos & Morris, 1999; Kim & Taam, 2012a, b, c; Kim et al., 2013).
Since its discovery (Becklin et al., 1969), IRC+10216, the nearest carbon star, has been the subject of multi-wavelength observations aimed at detecting new molecules or studying the circumstellar dust and chemistry (e.g., Guelin & Thaddeus, 1977; Jura, 1983; Glassgold, 1996; Guélin, 2011). The overall shape of its CSE, detected up to radius , is fairly spherical. Due to its proximity (distance pc, Groenewegen et al., 1998, 2012), the envelope has been resolved, exhibiting multiple shells with noticeably different geometric centers (Crabtree et al., 1987; Mauron & Huggins, 1999, 2000; Fong et al., 2003; Decin et al., 2011). The dynamical timescale of shell separation, 200–800 years, is far longer than the pulsation period of IRC+10216 ( 649 days, Le Bertre, 1992) and significantly shorter than the periods between thermal pulses (of order of years, Bloecker, 1995). The shell geometry must have been caused by other mechanisms, possibly binary interactions as considered previously (e.g., Mauron & Huggins, 1999; Decin et al., 2011). Indeed, the shell center offsets can be reproduced by a spiral-shell model of IRC+10216 with enhanced mass loss when a companion approaches periastron (e.g., Cernicharo et al., 2014). Recent Atacama Large Millimeter/submillimeter Array (ALMA) observations show that the morphology and kinematics of its inner parts are consistent with those expected from binary interactions (Decin et al., 2015).
High-resolution optical images of IRC+10216 taken in the years around 2000 revealed a bipolar nebula – in size, with the northeast lobe significantly fainter than the southwest lobe (e.g., Haniff & Buscher, 1998; Skinner et al., 1998; Mauron & Huggins, 2000; Leão et al., 2006). This nebula was further modeled as an inclined bi-conical structure (Dyck et al., 1987; Haniff & Buscher, 1998). Upon examination of all archival Hubble Space Telescope (HST) images of IRC+10216’s core, we find that in 2011 the aforementioned bipolar nebula had disappeared and a different set of peaks appeared. We identify the brightest peak and a fainter point-like source as the central star and its companion. In this paper, we report our analysis of archival data of IRC+10216 and discuss its physical nature.
2 Archival Data
2.1 Hubble Space Telescope Images
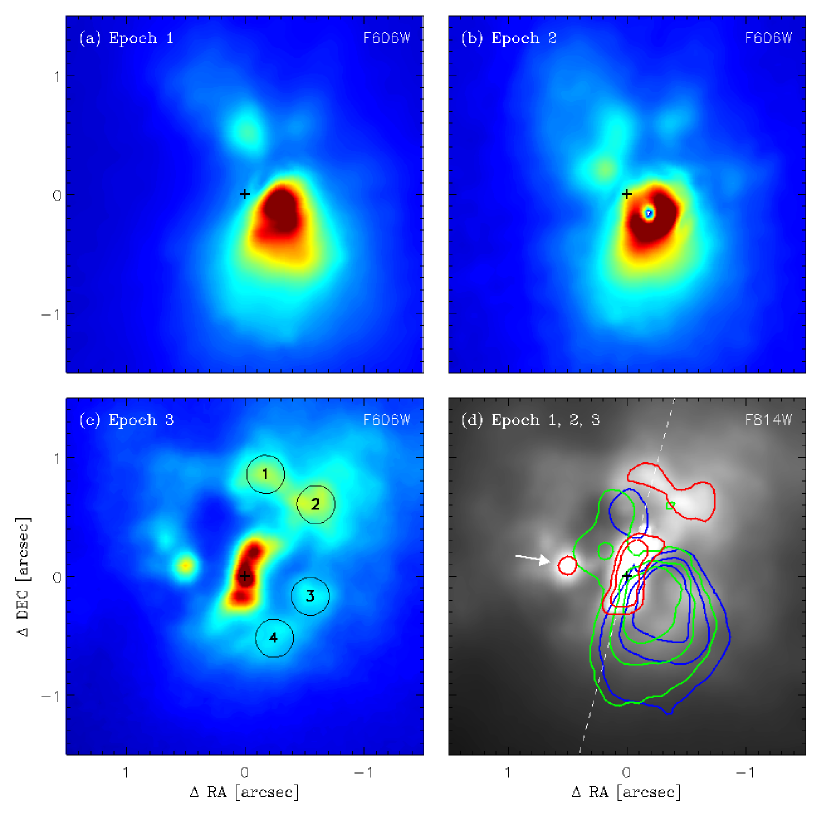
Three images of IRC+10216 taken with the F606W filter were retrieved from the HST archives: Epoch 1 on 1998 March 30 with the WFPC2 camera (PID 6856; P.I. John Trauger) for a total integration time of s; Epoch 2 on 2001 January 7 with the WFPC2 and s (PID 8601; P.I. Patrick Seitzer), and Epoch 3 on 2011 June 4 with the WFC3 camera and s (PID 12205; P.I. Toshiya Ueta). The WFPC2 and WFC3 fields are about 2525 and 3′3′, and the pixel sizes are 01 and 004, respectively. The three F606W images are displayed in Figure 1. It can be seen at once that a very drastic change of structure has occurred between Epoch 2 and 3. A F814W image taken at Epoch 3 (Figure 1(d)) from the same program is saturated at the brightest peak but shows an, otherwise, almost identical morphology to the F606W image.
To compare these images, an astrometric analysis was performed using the CCMAP package of IRAF (Tody, 1993). Three well-detected stars located within 40″ from IRC+10216 and identified in the Sloan Digital Sky Survey (SDSS) catalog (Aihara et al., 2011) were chosen for reference. Only one of these stars is well-detected in the shallow Epoch 2 image; therefore, we use two compact galaxies and one star to bootstrap the astrometry from the Epoch 1 and 3 images. The combined uncertainty in the astrometric alignment between each pair of images is 008.
2.2 Photometric Monitoring Data from the Catalina Sky Survey
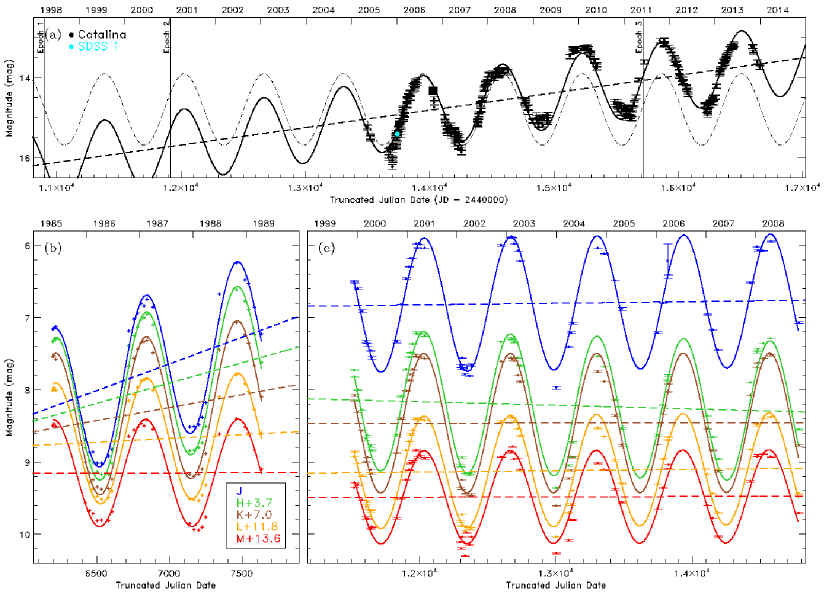
We have used the Catalina Sky Survey (Drake et al., 2014) data to investigate the variability of IRC+10216. The Catalina lightcurve of IRC+10216, shown in Figure 2(a), covers 2005–2014. As the Catalina Sky Survey used unfiltered images to maximize throughput, these photometric measurements correspond to passbands depending on a star’s spectral energy distribution (SED) and the CCD responses. IRC+10216 is a very red object with possible phase-dependent color variations. Therefore, we compared the Catalina photometry with contemporaneous SDSS data (from 2006 January 6) in different passbands, and found that the SDSS band had a similar value (indicated by a filled cyan circle in Figure 2(a); Ahn et al., 2012). The SDSS and band magnitudes were off by and mag, respectively.
We searched for similar monitoring data from earlier epochs, and found two with extensive coverage and both were in infrared wavelengths: for 1985–1989 (Le Bertre, 1992) and for 2000–2008 (Shenavrin et al., 2011). The latter overlapped the Catalina monitoring for 3–4 years. These infrared lightcurves are shown in Figure 2(b)–(c).
3 Optical and Near-Infrared Variations
3.1 Morphological Variations in the Core
The HST F606W images from the three epochs are shown in Figure 1. The 1998 and 2001 images are qualitatively similar, exhibiting a bright southwest lobe and a fainter northeast lobe, previously identified as a bipolar structure (e.g., Mauron & Huggins, 2000). The 2011 image shows a dramatically different morphology: the brightest peak appears to be at a different location, and the region within from the peak has a more complex structure, including a point-like source at 05 east of the peak. There is no trace of the previously identified bipolar structure. Using a 6″-radius source aperture and a background annulus of radii 14″–16″, we have measured the HST F606W magnitudes of IRC+10216 to be 17.29, 17.15, and 16.93 mag in 1998, 2001, and 2011, respectively.
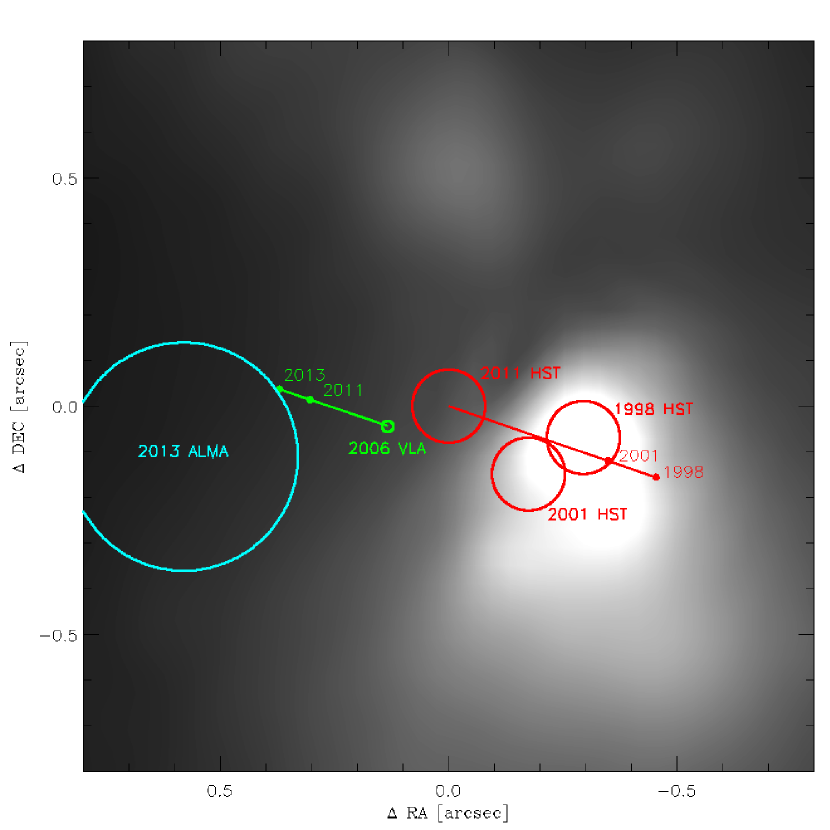
Images from the three epochs have been aligned astrometrically with respect to background stars and galaxies; however, to properly determine the differences among the images, the proper motion of IRC+10216 has to be considered. Using radio continuum observations made with the Very Large Array (VLA), the proper motion of IRC+10216 has been reported to be mas yr-1 in RA and mas yr-1 in Dec (Menten et al., 2012). For this proper motion, the brightest peak in 2011 would correspond to positions close to, albeit not exactly on, the peaks in 1998 and 2001. The offsets (both about 018) are small, but larger than the uncertainty in the differential astrometry (008). The observed peak positions from 1998, 2001, and 2011 and the expected 1998 and 2001 positions of the 2011 peak are plotted in Figure 3.
It is interesting to compare the 2011 peak position with the central position of IRC+10216 reported from high-resolution radio observations. The radio continuum emission of IRC+10216 originates from its radio photosphere (Menten et al., 2006), and its J2000 coordinates observed with the VLA in Epoch 2006.16 are 09h47m57s.4255, (Menten et al., 2012). The J2000 coordinates of IRC+10216 derived from ALMA observations at a higher radio frequency in the Epoch 2012.92 are 09h47m57s.4553, 43749, different from the proper-motion-corrected VLA position by 026, close to the error limit (Decin et al., 2015). Comparing these positions with the optical position of the 2011 peak (09h47m57s.4189, ; see Figure 3), we see a 03 offset between the optical peak in 2011 and the VLA radio peak expected in 2011. Considering that the absolute astrometry of HST can reach 01–03 when a large number of reference stars are available (Koekemoer et al., 2006), the uncertainty of our absolute astrometry of IRC+10216 based on only 3 reference stars must be at least 03. Therefore, we suggest that the radio peak and the 2011 optical peak are coincident within the uncertainty of the HST astrometry.
3.2 Trends in the Lightcurves of IRC+10216
The Catalina lightcurve of IRC+10216 in Figure 2(a) shows a gradual trend of brightening from 2005 to 2014, in addition to the stellar pulsation of the carbon star. To quantify the brightening, we fit the lightcurve in Figure 2(a) with a sinusoidal term and a linear term:
| (1) |
where is the observed magnitude at epoch and – are constants. The best-fit model has mag for the amplitude of the sinusoidal variations; days for the period of the sinusoidal variations; and mag yr-1 for the brightening rate in the Catalina photometry. The derived pulsation period of the carbon star is consistent with the range of values from infrared bands (649 days, Le Bertre, 1992; 630 days, Menten et al., 2012). No similar monitoring records at earlier epochs in unfiltered or band are available to show the onset of the brightening trend. The HST F606W measurements span 14 years, but do not provide sufficient data points to constrain the parameters in Equation (1).
IRC+10216 was monitored in the infrared bands in 1985–1989 (Le Bertre, 1992) and 2000–2008 (Shenavrin et al., 2011). These lightcurves are plotted in Figure 2(b) and (c), and fitted by Equation (1). We find that the , , and lightcurves in the 1980s show systematic brightening trends at rates of , , and mag yr-1, but at longer wavelengths the and lightcurves have nearly null brightening rates. Interestingly, the brightening trends in the near-infrared wavelengths vanished in the 2000s, when all observed infrared magnitudes stayed at a constant level with smaller amplitudes of sinusoidal variations (see Figure 2(c)). The , , , and magnitudes seem to become fainter by 0.3–0.7 mag from epoch 1989.5 to epoch 1999.9.
The lightcurves of IRC+10216 are clearly complex. The important features that need to be noted are: (1) there is the brightening trend of broad-band optical magnitudes in 2005–2014 and of near-infrared bands in 1985–1989; (2) the near-infrared magnitudes vary around nearly constant levels in 2000–2008, although the optical magnitudes show brightening in 2005-2008; and (3) the mid-infrared bands of and show periodic variations around constant levels during all monitoring campaigns, regardless of the brightening trends in other bands.
4 DISCUSSION
4.1 Nature of the Changes in the Core Region
The innermost region in the CSE of IRC+10216 in the 2011 HST image exhibits a strikingly different appearance from those of 1998 and 2001 (Figure 1). This large modification of optical core structure has occurred in 10 years; optical and infrared lightcurves have both shown brightening trends with a similar timescale. This timescale is much shorter than the stellar evolutionary timescale (– years) associated with thermal pulsing behavior and is not likely due to variation in the stellar luminosity. Since the dust envelope of IRC+10216 is optically thick, the stellar radiation is absorbed and reemitted mostly in infrared wavelengths; its SED peak is near m or beyond in mid-infrared (Ladjal et al., 2010). The lack of long-term variations in the mid-infrared and bands indicates that the stellar luminosity is steady.
The timescale of 10 years may be appropriate for photospheric or inner circumstellar changes. For example, a progressive rarefaction of the inner envelope allows penetration of stellar radiation, which can be detected in optical and near-infrared bands as a gradual brightening. The brightening trend could be also variable scattering due to changes in the geometry of the circumstellar material. Therefore, the brightening trends in the optical and near-infrared lightcurves likely imply the change of intervening circumstellar dusts in the 10-year timescale, which may account for the recent changes of optical morphology in the core of IRC+10216.
4.2 Optical Identification of Central Star
The 2011 HST F606W image of IRC+10216’s core shows an elongated feature centered on the brightest peak. We have established in Section 3.1 that this peak is coincident with the expected radio peak within the uncertainties of absolute astrometry; therefore, we identify this brightest peak as the central star of IRC+10216. The expected locations of this central star in 1998 and 2001 are both offset from the brightest peak by 018 (or 23 AU). This offset is larger than the uncertainty in the relative astrometry (008). It is likely that the brightest peaks in 1998 and 2001 were both dust clump in close vicinity of the central star.
A dust lane of IRC+10216, extending up to in the east-west direction, is recently presented by Jeffers et al. (2014) in a linearly polarized optical intensity map. By placing the brightest peak in the HST 2011 image at their suggested location of central star in the dust lane, we have noticed that our elongated structure (PA ) is perpendicular to their dust lane (PA ) and connects the brightest parts in the two lobes of polarized optical light. The width of our elongated structure is 10–20 AU (or 5–10 stellar radii with the photospheric radius of IRC+10216 2 AU suggested by Menten et al. 2012), which is similar to the radius of a dust formation zone or the inner radii used in the torus and ring models of Jeffers et al. (2014). The elongated structure could be caused by either an illumination or a confined outflow through the central hole of a dense equatorial torus.
The elongated structure consists of two compact blobs on two opposite sides of our suggested central star. Both blobs are 02 from the central star; assuming the same expansion speed as the outer envelope ( 15 km s-1, Loup et al., 1993), they could be launched about 8 years ago. We also note that the elongated structure extends up to 04, which corresponds to about 26 stellar radii. The elongated structure is slightly curved, thus shaped like a spiral or a point-symmetric structure.
4.3 Candidate for Companion of IRC+10216
One of the exciting findings from the 2011 HST image is the emergence of a point-like source at 05 east of the central star (indicated by an arrow in Figure 1(d)). This source is projected within the dust lane of Jeffers et al. (2014). The FWHM of its profile, 015, is within the range of 009–017 measured for 10 unsaturated images of isolated stars. The color () of this point-like source is redder than those of diffuse clumps scattered over the inner region (denoted by 1 to 4 in Figure 1(c)) by a factor of , suggesting a different nature from the ambient matter. We posit that this point-like source is a companion star of IRC+10216.
Its magnitude determined by referencing to SDSS stars is mag. Assuming that circumstellar extinction follows the interstellar extinction law and adopting the distance 130 pc, one can derive physical parameters of this companion candidate. For a density distribution of the envelope, the column density to the source at radius is calculated to be of that to the center, where represents the radius of dust formation zone (15 AU is adopted). For a visual optical depth derived from an SED fitting by Ladjal et al. (2010), the visual extinction toward the companion candidate would be mag. With this extinction, its magnitude best matches a main-sequence star with a spectral type of M1 (). It is, however, very tentative because of uncertainties in the circumstellar extinction coefficients, inhomogeneity of AGB wind, and unknown line-of-sight location of the point-like source.
If the point-like source seen in 2011 is indeed a binary companion, we can assess its possible orbit and proper motion. Assuming that the projected separation of 05 (i.e., 65 AU) corresponds to the orbital semi-major axis , the orbital velocity of a binary component with respect to the other is , where is the total binary mass. This speed corresponds to 001 per year for an assumed total binary mass of . Assuming a fitting accuracy of , its movement may be observable in a few years from 2011 in the best case. The formula for binary dynamics yields the orbital period of 330 yr . This period is consistent with the timescale of 200–800 yr derived from the intervals between the outer shell patterns (Crabtree et al., 1987; Mauron & Huggins, 1999, 2000), which, in binary-induced spiral-shell models, represents the orbital period (e.g. Kim & Taam, 2012b).
The candidate for companion of IRC+10216 is proposed based on its point-like appearance, projection onto the dust lane, and color difference from nearby diffuse clumps. Its photometric and orbital period properties are not inconsistent with a low-mass main-sequence star. However, the absence of the companion candidate in the earlier epochs remains an open question since its orbital motion, if circular, is rather slow to explain its relative position. A speed is required to move 05 in 10 years. From a single imaging data, we cannot rule out a possibility that this point-like source could be a compact clump originated from small scale fluctuations in the dust condensation radius of IRC+10216. Further observations and quantitative modeling are desired to better investigate this object in the current and near future, especially since the giant star in IRC+10216 will reach the next light minimum in March 2016 when the companion is less overwhelmed.
References
- Ahn et al. (2012) Ahn, C. P., Alexandroff, R., Allende Prieto, C., et al. 2012, ApJS, 203, 21
- Aihara et al. (2011) Aihara, H., Allende Prieto, C., An, D., et al. 2011, ApJS, 193, 29
- Becklin et al. (1969) Becklin, E. E., Frogel, J. A., Hyland, A. R., Kristian, J., & Neugebauer, G. 1969, ApJ, 158, L133
- Bloecker (1995) Bloecker, T. 1995, A&A, 297, 727
- Cernicharo et al. (2014) Cernicharo, J., Marcelino, N., Agundez, M., & Guelin, M. 2014, arXiv:1412.1948
- Crabtree et al. (1987) Crabtree, D. R., McLaren, R. A., & Christian, C. A. 1987, in Late Stages of Stellar Evolution, ed. S. Kwok & S.R. Pottasch (Dordrecht: Reidel), 145
- Decin et al. (2015) Decin, L., Richards, A. M. S., Neufeld, D., et al. 2015, A&A, 574, AA5
- Decin et al. (2011) Decin, L., Royer, P., Cox, N. L. J., et al. 2011, A&A, 534, AA1
- Drake et al. (2014) Drake, A. J., Graham, M. J., Djorgovski, S. G., et al. 2014, ApJS, 213, 9
- Dyck et al. (1987) Dyck, H. M., Howell, R. R., Zuckerman, B., & Beckwith, S. 1987, PASP, 99, 99
- Fong et al. (2003) Fong, D., Meixner, M., & Shah, R. Y. 2003, ApJ, 582, L39
- Groenewegen et al. (1998) Groenewegen, M. A. T., van der Veen, W. E. C. J., & Matthews, H. E. 1998, A&A, 338, 491
- Groenewegen et al. (2012) Groenewegen, M. A. T., Barlow, M. J., Blommaert, J. A. D. L., et al. 2012, A&A, 543, L8
- Huggins et al. (2009) Huggins, P. J., Mauron, N., & Wirth, E. A. 2009, MNRAS, 396, 1805
- Glassgold (1996) Glassgold, A. E. 1996, ARA&A, 34, 241
- Guélin (2011) Guélin, M. 2011, Observational astrochemistry, European Physical Journal Web of Conferences, 18, 01002
- Guelin & Thaddeus (1977) Guelin, M., & Thaddeus, P. 1977, ApJ, 212, L81
- Haniff & Buscher (1998) Haniff, C. A., & Buscher, D. F. 1998, A&A, 334, L5
- Jeffers et al. (2014) Jeffers, S. V., Min, M., Waters, L. B. F. M., et al. 2014, A&A, 572, AA3
- Jorissen (2003) Jorissen, A. 2003, Asymptotic giant branch stars, by Harm J. Habing and Hans Olofsson. Astronomy and astrophysics library, New York, Berlin: Springer, 2003, p. 461, 461
- Jura (1983) Jura, M. 1983, ApJ, 267, 647
- Kim et al. (2013) Kim, H., Hsieh, I.-T., Liu, S.-Y., & Taam, R. E. 2013, ApJ, 776, 86
- Kim & Taam (2012a) Kim, H., & Taam, R. E. 2012a, ApJ, 744, 136
- Kim & Taam (2012b) Kim, H., & Taam, R. E. 2012b, ApJ, 759, 59
- Kim & Taam (2012c) Kim, H., & Taam, R. E. 2012c, ApJ, 759, L22
- Koekemoer et al. (2006) Koekemoer, A. M., McLean, B., McMaster, M., & Jenkner, H. 2006, The 2005 HST Calibration Workshop: Hubble After the Transition to Two-Gyro Mode, 417
- Ladjal et al. (2010) Ladjal, D., Justtanont, K., Groenewegen, M. A. T., et al. 2010, A&A, 513, AA53
- Le Bertre (1992) Le Bertre, T. 1992, A&AS, 94, 377
- Leão et al. (2006) Leão, I. C., de Laverny, P., Mékarnia, D., de Medeiros, J. R., & Vandame, B. 2006, A&A, 455, 187
- Loup et al. (1993) Loup, C., Forveille, T., Omont, A., & Paul, J. F. 1993, A&AS, 99, 291
- Maercker et al. (2012) Maercker, M., Mohamed, S., Vlemmings, W. H. T., et al. 2012, Nature, 490, 232
- Mastrodemos & Morris (1999) Mastrodemos, N., & Morris, M. 1999, ApJ, 523, 357
- Mauron & Huggins (1999) Mauron, N., & Huggins, P. J. 1999, A&A, 349, 203
- Mauron & Huggins (2000) Mauron, N., & Huggins, P. J. 2000, A&A, 359, 707
- Mauron & Huggins (2006) Mauron, N., & Huggins, P. J. 2006, A&A, 452, 257
- Mauron et al. (2013) Mauron, N., Huggins, P. J., & Cheung, C.-L. 2013, A&A, 551, AA110
- Mayer et al. (2011) Mayer, A., Jorissen, A., Kerschbaum, F., et al. 2011, A&A, 531, L4
- Mayer et al. (2014) Mayer, A., Jorissen, A., Paladini, C., et al. 2014, A&A, 570, AA113
- Menten et al. (2012) Menten, K. M., Reid, M. J., Kamiński, T., & Claussen, M. J. 2012, A&A, 543, AA73
- Menten et al. (2006) Menten, K. M., Reid, M. J., Krügel, E., Claussen, M. J., & Sahai, R. 2006, A&A, 453, 301
- Shenavrin et al. (2011) Shenavrin, V. I., Taranova, O. G., & Nadzhip, A. E. 2011, Astron. Rep., 55, 31
- Skinner et al. (1998) Skinner, C. J., Meixner, M., & Bobrowsky, M. 1998, MNRAS, 300, L29
- Soker (1994) Soker, N. 1994, MNRAS, 270, 774
- Theuns & Jorissen (1993) Theuns, T., & Jorissen, A. 1993, MNRAS, 265, 946
- Tody (1993) Tody, D. 1993, in Astronomical Data Analysis Software and Systems II, A.S.P. Conference Ser., 52, ed. R.J. Hanisch, R.J.V. Brissenden, & J. Barnes, 173