This work has been submitted to the IEEE Nuclear Science Symposium 2014 for publication in the conference record. Copyright may be transferred without notice, after which this version may no longer be available.
Performance of a Large-Area
GEM Detector Prototype for the
Upgrade of the CMS Muon Endcap System
Abstract
Gas Electron Multiplier (GEM) technology is being considered for the forward muon upgrade of the CMS experiment in Phase 2 of the CERN LHC. Its first implementation is planned for the GE1/1 system in the region of the muon endcap mainly to control muon level-1 trigger rates after the second long LHC shutdown. A GE1/1 triple-GEM detector is read out by 3,072 radial strips with 455 rad pitch arranged in eight -sectors. We assembled a full-size GE1/1 prototype of 1m length at Florida Tech and tested it in 20-120 GeV hadron beams at Fermilab using Ar/CO2 70:30 and the RD51 scalable readout system. Four small GEM detectors with 2-D readout and an average measured azimuthal resolution of 36 rad provided precise reference tracks. Construction of this largest GEM detector built to-date is described. Strip cluster parameters, detection efficiency, and spatial resolution are studied with position and high voltage scans. The plateau detection efficiency is [97.1 0.2 (stat)]%. The azimuthal resolution is found to be [123.5 1.6 (stat)] rad when operating in the center of the efficiency plateau and using full pulse height information. The resolution can be slightly improved by 10 rad when correcting for the bias due to discrete readout strips. The CMS upgrade design calls for readout electronics with binary hit output. When strip clusters are formed correspondingly without charge-weighting and with fixed hit thresholds, a position resolution of [136.8 2.5 stat] rad is measured, consistent with the expected resolution of strip-pitch/ = 131.3 rad. Other -sectors of the detector show similar response and performance.
I Introduction
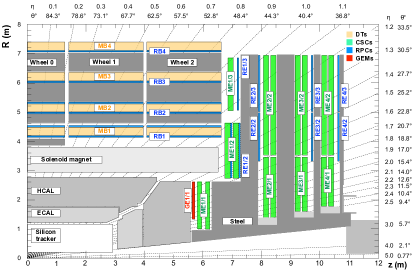
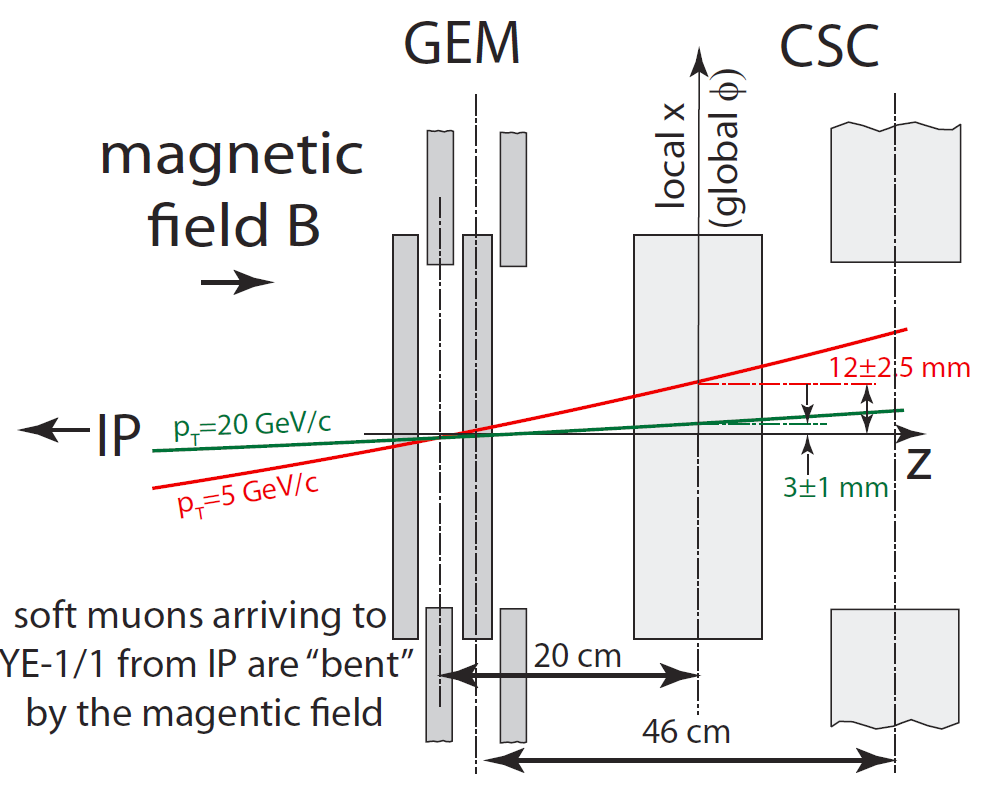
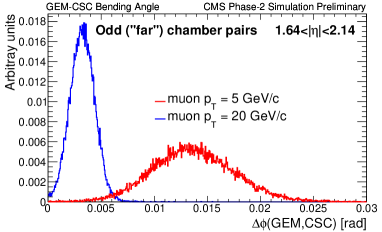
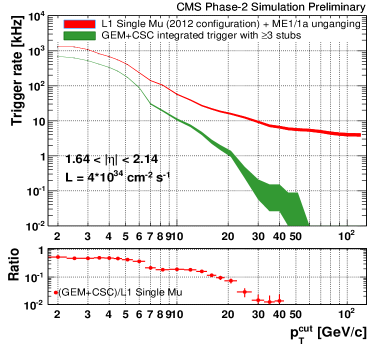
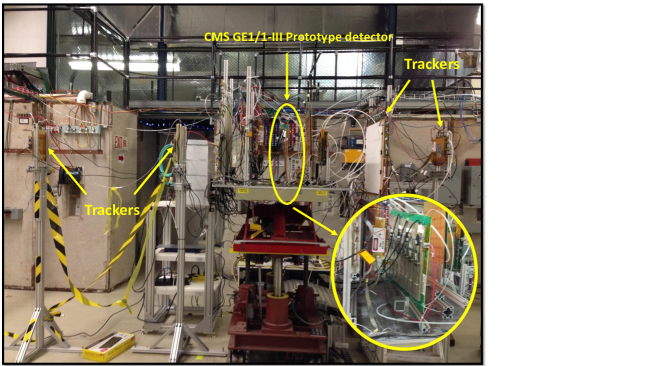
During the phase II upgrade of the Compact Muon Solenoid (CMS) experiment at the CERN, CMS GEM collaboration intends to install large-area GEM [1] detectors in the forward muon endcap in the high- region . Fig. 1 shows the quadrant of the muon system, where installation of GE1/1 detectors is proposed. This installation will help to restore redundancy for tracking and triggering in the muon system, as GEM detectors provide very precise tracking information due to high spatial resolution. They can also sustain high particles rates up to MHz/cm2. Cathode Strips chambers (CSC) alone many times misidentify multiply scattered lower pT muons as high pT muons. This problem can be overcome by using GEM detectors in conjuction with the CSC system as shown in Fig. 2; together they provide an accurate measurement of the muon bending angle that is not affected by multiple scattering. This discriminates lower pT muons from higher pT muons and reduces the soft muon rate at the level-1 trigger as shown in Fig. 3, which will help control the muon trigger rate at the high luminosity LHC.
We have constructed a 1m-long GE1/1 prototype, one of the largest GEM detectors in existance, at Florida Institute of Technology and tested it in a hadron beam at Fermilab. This particular prototype represents the third generation of GE1/1 prototypes. Performance characteristics of the detector such as strip cluster parameters, detection efficiency, and spatial resolution have been studied using full pulse height information as well as with binary hit reconstruction. A correction for the non-linear strip response is also implemented in an attempt to improve overall spatial resolution of the GE1/1 detector.
II Construction of a Large-Area GEM detector at Florida Tech
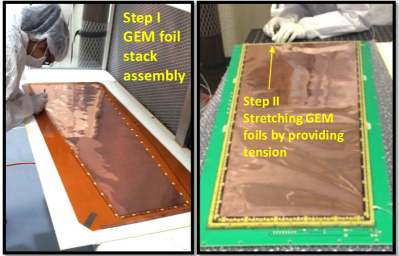
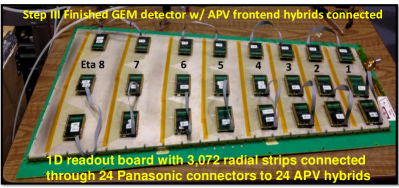
The large-area GEM detector proposed for the CMS muon endcap upgrade is a trapezoidal Triple-GEM detector with approximately 99(28-45) cm2 active surface area. This detector has a 3/1/2/1 mm (drift, transfer 1, transfer 2, induction) internal electrode gap configuration. The GEM foils used in this detector are produced by single-mask etching technique at CERN. Each GEM foil is divided into 35 high voltage sectors that are transverse to the direction of the readout strips. A stack of these three GEM foils is mounted on the drift electrode; the gas volume is closed with the readout board. This detector is constructed using an internal mechanical stretching method [3] introduced in 2011. There are a total of 3072 radial readout strips with 455 rad pitch along the azimuthal direction and distributed over eight -sectors. In each of the sectors, induced signals are read out via 384 radial strips. Fig. 4 shows the main steps involved in the construction of the GE1/1-III prototype detector.
III Test Beam setup
The GE1/1-III prototype detector was tested in a 32 GeV mixed hadron beam at the Fermilab test beam facility (FTBF) in October 2013. For tracking studies, this detector was positioned on a movable table between four GEM detectors with 2D Cartesian readout [4]. Three of them were small 10 cm 10 cm GEM detectors and one was a 50 cm 50 cm (Provided by University of Virginia) GEM detector for which only the central 10 cm 10 cm area was instrumented shown in Fig. 5. These 2D GEM detectors contained 256 straight strips along each horizontal (y-coordinate) and vertical (x-coordinate) plane with 0.4 mm pitch. The data were collected using the RD51 scalable readout system [5] [6] with an external trigger provided by scintillators. During this beam test, all detectors used an Ar/CO2 70:30 gas mixture.
IV Beam Test results
IV-A Performance Characteristics
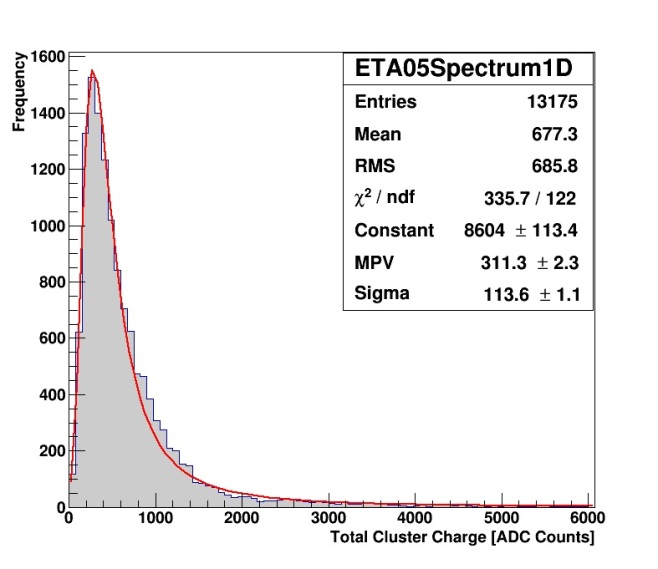
Performance characteristics of the GE1/1 detector were studied using high voltage and position scan data. In the high voltage scan, the beam was focused on sector 5 and the voltage of the GE1/1 detector was varied from 2900V to 3350V, whereas voltages of all tracker detectors were set so that the trackers operated on their efficiency plateaus throughout all measurements. Fig. 6 shows the cluster charge distribution for -sector 5 at 3250V. All distributions obtained at different high voltages are fitted with a Landau function and the Most Probable Values (MPV) obtained from these fits are used for obtaining the uniformity results for the GE1/1 detector.
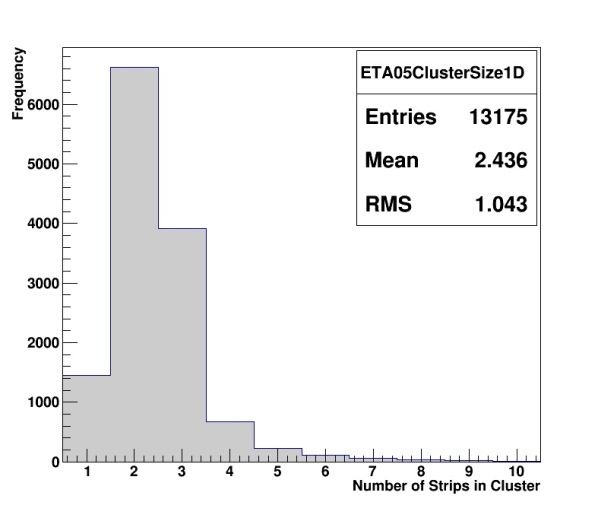
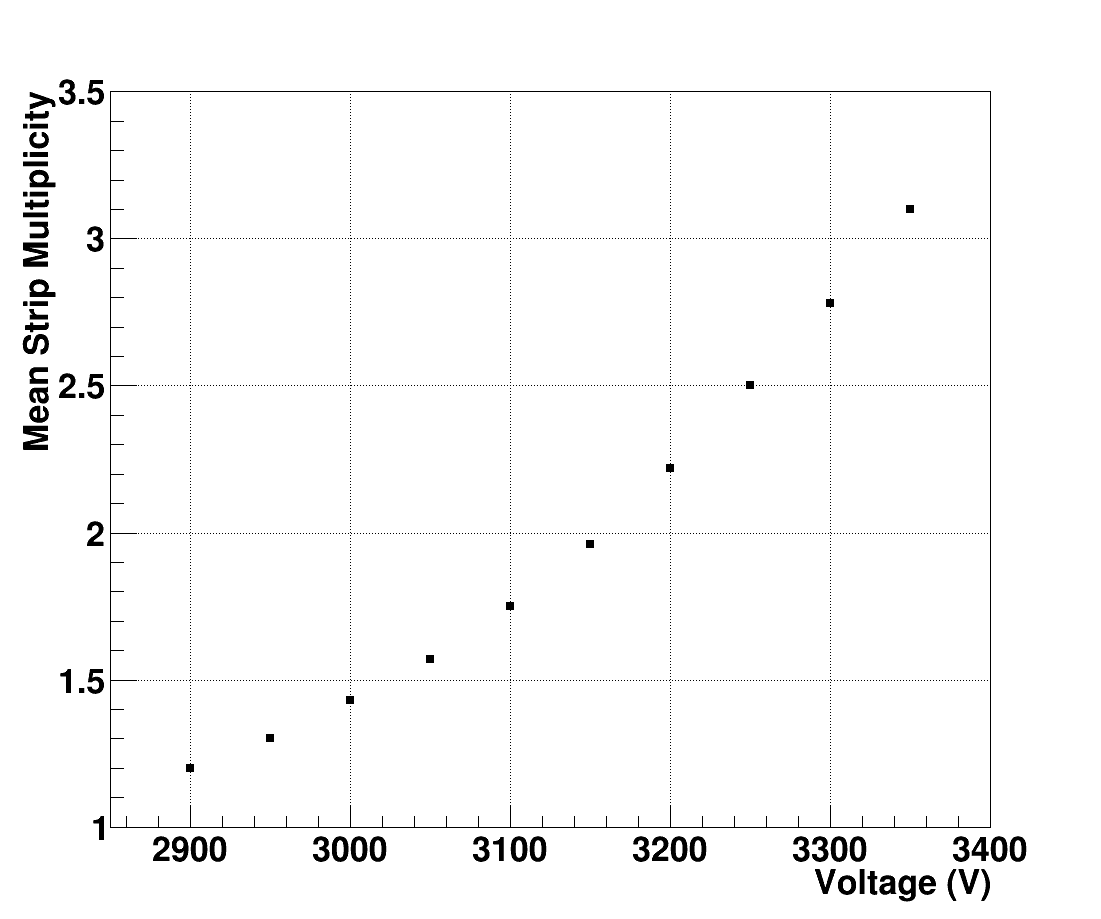
The number of strips above threshold in a strip cluster define the strip multiplicity of that cluster. For the GE1/1 detector, the distribution of multiplicity in strip clusters is shown in Fig. 7; the average strip multiplicity is 2.4 strips. Fig. 8 shows that the strip multiplicity increases with high voltage, i.e. gas gain.
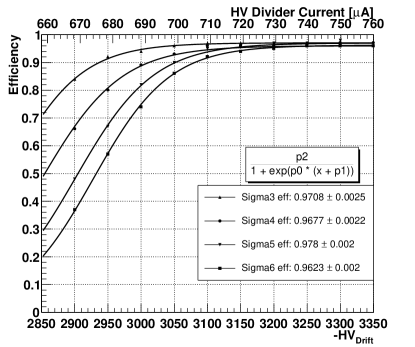
The detection efficiency is obtained as , where N = total number of triggered events; = number of events with Cluster Multiplicity (CM) 1 for given sector; = number of events with CM 1 for other sectors. A few strips from neighboring sectors triggered sometimes due to scattering of particles or because the beam was hitting near the edge of the sector. To obtain accurate efficiency of the given sector, we eliminate such events from the total number of events. The overall detection efficiency of the detector is measured for four threshold cuts on the pedestal width, namely 3, 4, 5, and 6, where is the width of the pedestal distribution from a Gaussian fit. Fig. 9 shows efficiency curves fitted with a sigmoid function for these threshold cuts. The efficiency curves show a long plateau for higher voltages and the efficiency values on plateau are not much affected by different threshold cuts. The detection efficiency of the GE1/1 detector with 5 cut on the pedestal width is [97.1 0.2 (stat)]%.
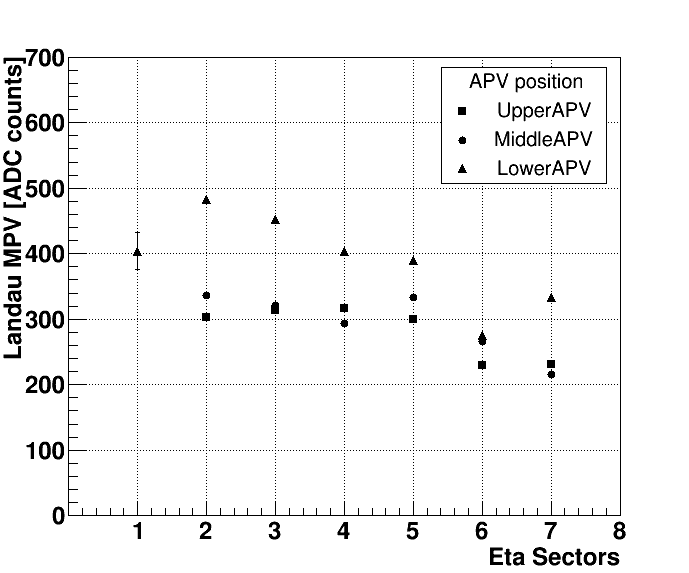
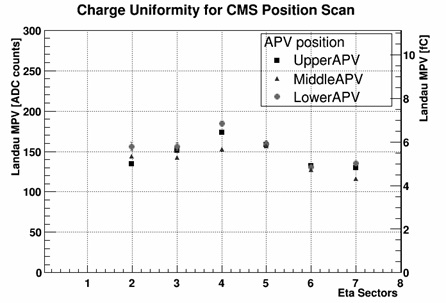
The position scan is used to measure the uniformity response of the detector for all -sectors at operating voltage 3250V. The scan was performed for three APV positions (see Fig. 4 (b)). For each sector, the charge uniformity was measured using the Landau MPV from the cluster charge distribution. Fig. 10 shows the uniformity response for the first seven sectors. The uniformity varies by 25% across different sectors. The variation in sector 6 and 7 has been improved in subsequent prototypes by carefully stretching foils in that region and by minimizing any bending of pcbs.
The response uniformity of the detector is also calculated by considering only single-strip single-cluster events. Fig. 11 shows the uniformity response of the -sectors of the detector.
IV-B Tracking Analysis
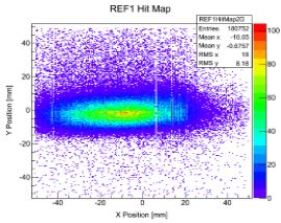
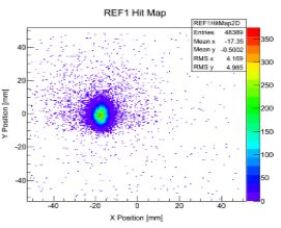
Beam profiles can be obtained using 2D hit maps of the reference tracker detectors. The beam profile for the secondary 32 GeV mixed-hadron beam is oval while the beam profile for the 120 GeV proton beam is more circular and more focused as shown in Fig. 12.
The tracking analysis is done in three steps to study the spatial resolution of the GE1/1 detector. The first step is alignment which is performed in two steps. The first one is to shift all tracker detectors so that their origins in x-y coordinate coincide and their residuals are centered at zero. In the second step, the three downstream tracking detectors are rotated with respect to the first tracker detector by using initial shift parameters from step one. The rotating angle for each detector is optimized such that the residual width of each detector is minimized.
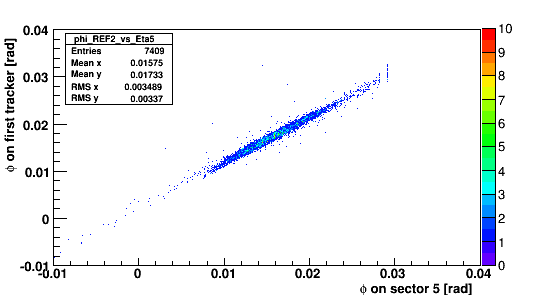
The next step in the tracking analysis is a transformation from Cartesian (x, y) coordinates to polar (r, ) coordinates, because the GE1/1 detector measures the azimuthal coordinate () with its radial strips. Fig. 13 shows correlation in for hits in the GE1/1 detector and in the first tracker detector.
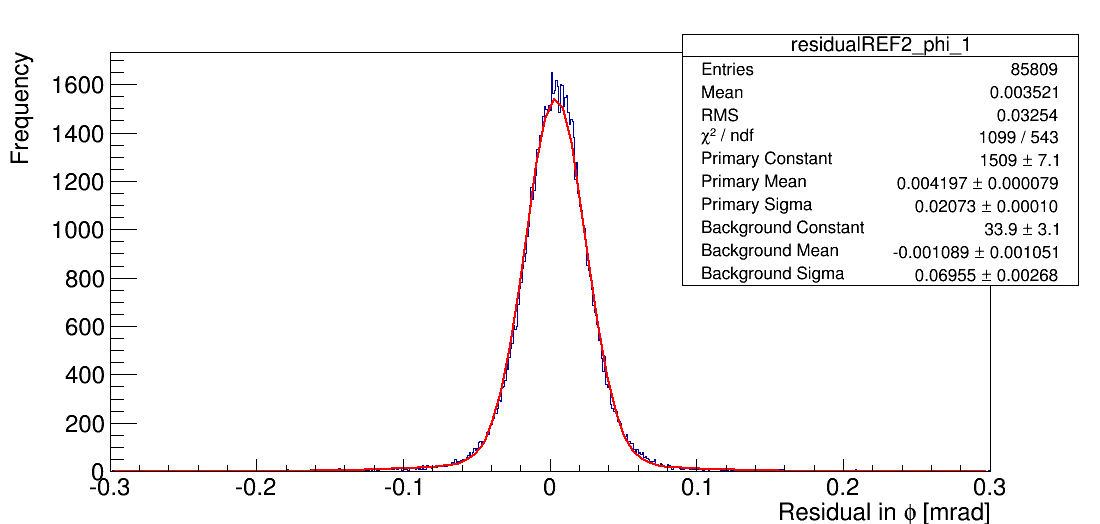
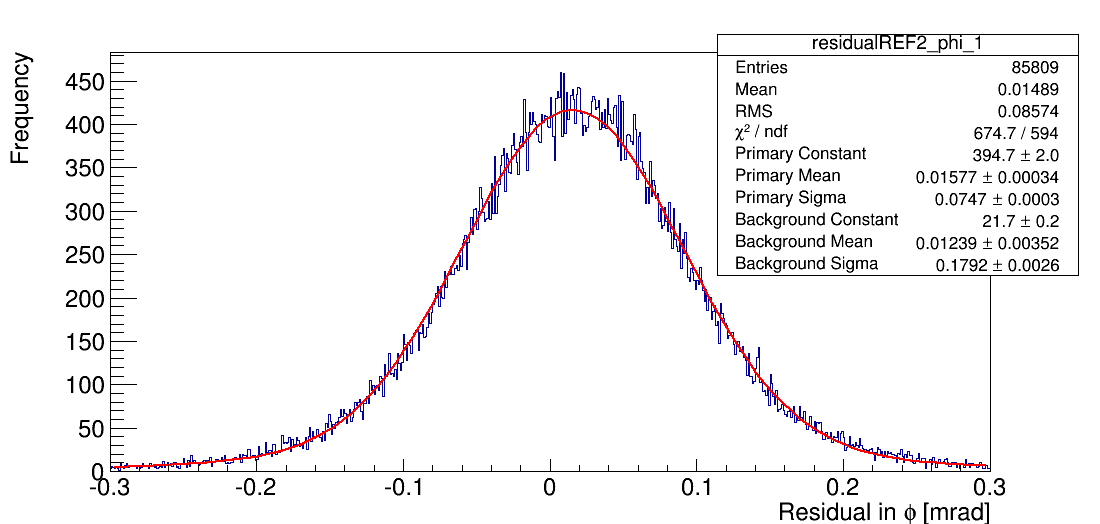
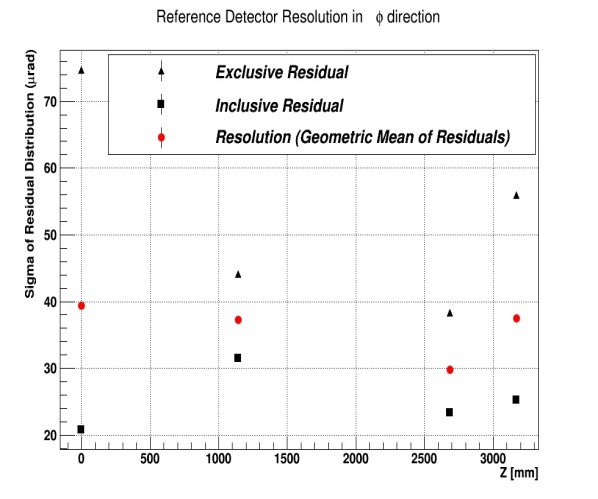
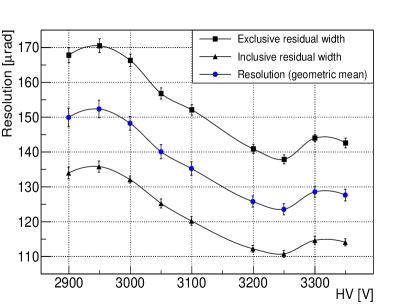
In the final step of the tracking analysis, both inclusive and exclusive track-hit residuals are calculated. The definition of an inclusive (exclusive) residual is the residual calculated by including (excluding) the probed detector in the track fitting. The spatial resolution of the detector is calculated from the geometric mean [7] [8] of the widths of inclusive and exclusive residuals, i.e. [9]. Fig. 14 shows both residual widths for the first tracker detector. The inclusive residual width is = 21 rad and exclusive residual width is = 75 rad; with a geometric mean of 40 rad. Similarly, the residual widths of the other three tracker detectors are calculated. Fig. 15 summarizes the angular resolution of all four tracking detectors.
The angular resolution of the GE1/1-III prototype GEM detector is calculated using two different methods for obtaining the hit position. The barycentric method uses the full pulse height information to find the strip cluster barycenter and the binary method uses binary hits reconstructed offline from the analog APV readout to emulate the behavior of VFAT [10] chips with binary output. The results are as follows:
IV-B1 The Barycentric Method
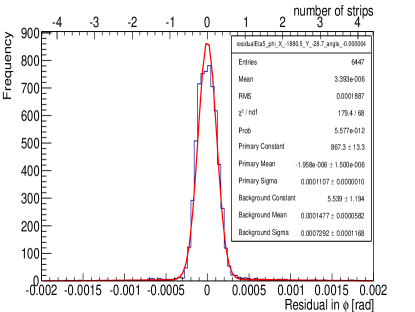
Fig. 16 shows inclusive and exclusive residuals of the GE1/1 detector at the center of sector 5 at 3250V using a 5 cut on the pedestal width. The inclusive residual is 110.7 rad and the exclusive residual is 137.9 rad in azimuthal direction; this corresponds to 208.1 m and 259.3 m, respectively, with R = 1880.5 mm. The resulting resolution of the GE1/1 detector using pulse height analog readout is [123.3 1.6 (stat)] rad, i.e. 27% of the strip pitch.
Residuals for sector 5 are plotted against the different applied high voltages in Fig. 17. The best resolution is obtained on the efficiency plateau as expected.
IV-B2 The Binary Method (Emulated VFAT Threshold)
During this beam test, all data were collected using APV25 hybrid chips that provide the analog signal, whereas for the CMS upgrade electronics the VFAT3 is proposed that produces a binary output for each readout strip (charge above or below threshold). Hence, it is important to study the characteristics of the GE1/1 detector using binary output. By applying a fixed threshold cut on the pedestal width, binary hits are reconstructed offline from the pulse height data. The detector efficiency is calculated again by applying fixed cuts of 0.8 fC, 0.98 fC, and 1.2 fC, which are equivalent to 10 VFAT, 12 VFAT, and 15 VFAT units; where 1 VFAT unit = 0.08 fC. The efficiency curve is again fitted with the sigmoid function and from its parameter the efficiency of the detector is found to be [96.9 0.2 (stat)]% on the plateau.
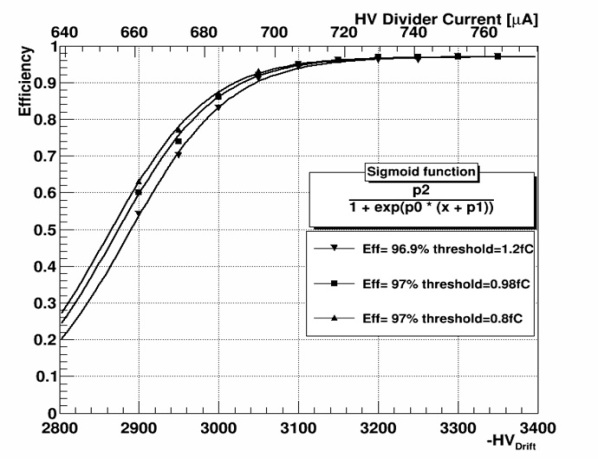
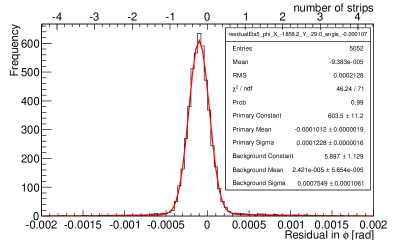
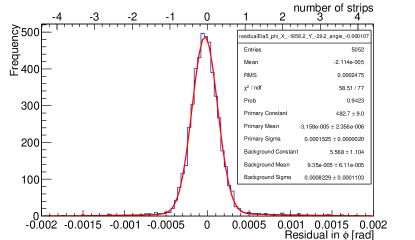
Fig. 19 (a) shows that the inclusive residual width of the detector is 122.8 rad (228.1 m) and (b) shows that the exclusive residual width is 152.5 rad (283.3 m) with binary hits. The geometric mean of these widths is 136.8 rad (254.2 m), which is consistent with the expectation from angular strip pitch/ = 131.3 rad.
The total radiation length of all chambers used in the test beam setup is about 14% which causes multiple scattering of the 32 GeV beam particles on the order of 147 rad RMS of the multiple scattering angle. This value is not negligible as it is within the range of the expected residual widths of the detector. We are currently setting up a Monte Carlo simulation of the full tracking setup including material budgets of all chambers to correct for multiple scattering. We expect that the corrected result for the resolution will be somewhat better than the above preliminary results.
IV-C Correction of non-linear strip response
The motivation for implementing this correction for the barycentric method is to further improve the spatial resolution of the GE1/1 detector. In this study, the strip cluster position is reconstructed in the detector via the cluster barycenter, or centroid [11]. A -correction factor is developed to correct the barycenter position in the GE1/1 detector for biases due to the discretized readout with strips. For the strip cluster with more than one strip, is defined as [12], where gives the barycenter position in terms of strip numbers; and are strip number and charge of the strip, respectively; is the strip number with the maximum charge. This correction was done for 2, 3, and 4-strip clusters.
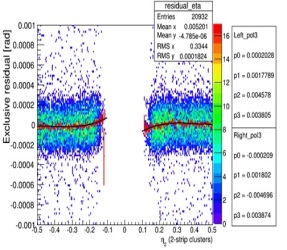
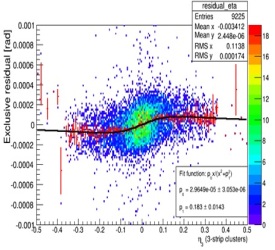
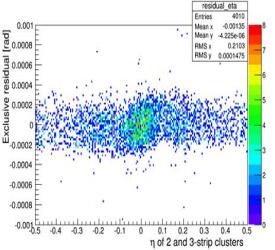
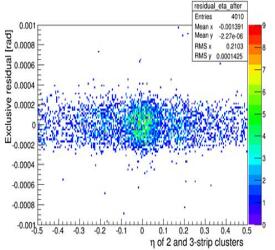
Fig. 20 (a) and (b) show the scatter plots of exclusive residual against for 2-strip and 3-strip clusters, respectively. They show different behavior and hence are fitted with different functions. Finally, a corrected resolution is obtained for the GE1/1 detector after correcting the measured hit positions by subtracting the value of the fitted function at from the original hit position. Fig. 20 (c) shows a scatter plot of the residuals for 2-strip and 3-strip clusters before correcting the hit position and (d) shows the corrected residuals for these strip clusters.
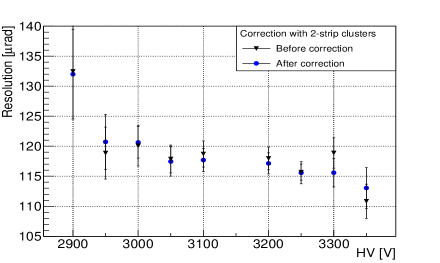
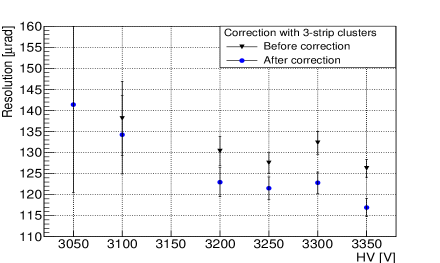
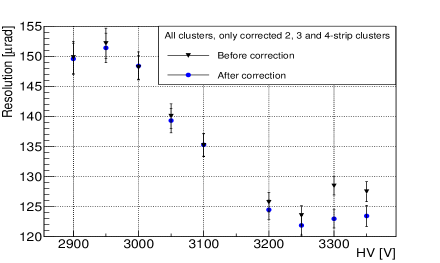
For the high voltage scan data, the strip correction factor changes negligibly over the entire voltage range. Consequently, all HV scan data were combined before implementing the strip correction for more statistics. However, the strip correction was performed individually on each sector for the position scan. Fig. 21 shows resolutions before and after correction. Since the readout of the GE1/1 has a fine strip segmentation, the overall improvement factor is small (less than 8%, i.e. within 10 rad) compared to detectors having coarser readout strips [13].
V Summary and Conclusion
A CMS GE1/1-III prototype GEM detector was successfully built and tested at Florida Tech and Fermilab, respectively, in 2013. The detector performed well in terms of detector efficiency, which is greater than 97% with two different methods for defining hits. It shows good charge uniformity for all -sectors except for sectors 6 and 7. The uniformity should be improved in future assemblies by making sure that all the foils have the same tension in all eight sectors. The spatial resolution of the GE1/1 detector is 123 rads with the barycentric method and 136 rads with the binary method. The binary method meets the expected value of resolution from the pitch of the strip. The spatial resolution of the barycentric mehod of the detector is improved by 10 rad after correcting for non-linear strip response. In conclusion, the tested GE1/1 prototype detector meets all but one performance expectation for use in the CMS muon endcap upgrade.
VI Acknowledgement
We thank the RD51 collaboration for its technical support. Also we thank the FLYSUB consortium as well as the staff of the Fermilab Test Beam Facility for their support during the beam test. Also, we gratefully acknowledge support from FRS-FNRS (Belgium),
FWO-Flanders (Belgium), BSF-MES (Bulgaria), BMBF (Germany), DAE
(India), DST (India), INFN (Italy), Uni. Roma (Italy), NRF (Korea),
QNRF (Qatar), DOE (USA), and WSU (USA).
References
- [1] F. Sauli, ”GEM: A new concept for electron amplification in gas detectors,” Nucl. Instrum. Meth. A 386, 531 (1997).
- [2] M. Tytgat et al., ”Status of the Triple-GEM project for the upgrade of the CMS Muon System,” IOP science, 2013 Available: http://www.ieee.org/portal/cms_docs/pubs/confstandards/pdfs/IEEE-PDF-SpecV401.pdf.
- [3] S. Colafranceschi, M. Hohlmann, et al., ”Beam Test Results for New Full-scale GEM Prototypes for a Future Upgrade of the CMS High- Muon System,” in Proc. IEEE NSS-MIC 2012, N14-137, pp. 1172-1176, arXiv:1211.3939v1 [physics.ins-det].
- [4] B. Ketzer, et al., ”Performance of triple GEM tracking detectors in the COMPASS experiment,” Nucl. Instrum. Meth. A 535 (2004) p.314-318.
- [5] K. Gnanvo, et al., ”Detection and Imaging of High-Z Materials with a Muon Tomography Station Using GEM Detectors,” in Proc. IEEE NSS-MIC 2010, NI19-90, pp. 552-559, arXiv:1011.3231 [physics.ins-det].
- [6] ALICE DAQ and ECS Manual, 2010, ALICE Internal Note/DAQ, ALICE-INT-2010-001.
- [7] R.K. Carnegie et al., ”Resolution studies of cosmic-ray tracks in a TPC with GEM readout,” Nucl. Instrum. Meth. A, 535(2005), p. 372-383.
- [8] T Alexopoulos et al 2014 JINST 9 P01003 doi:10.1088/1748-0221/9/01/P01003
- [9] D.C. Arogancia et al., Nucl. Instrum. Meth. A, 602(2007), p. 403-414.
- [10] P. Aspell, et al., ”The VFAT production test platform for the TOTEM experiment,” in Proc. Topical Workshop on Electronics for Particle Physics 2008, CERN-2008-008.
- [11] Gregorio Landi, ”Properties of the center of gravity as an algorithm for position measurements,” Nucl. Instrum. and Meth. A, 485 (2002) p. 698-719.
- [12] Marco Villa, CERN-Thesis-2013-284.
- [13] A. Zhang, et al., ”Study of a large-area GEM detector readout with radial zigzag strips for forward tracking in experimentas at a future Electron-Ion Collider,” IEEE NSS-MIC 2014, N05-12.