Molecular gas and nuclear activity in early-type galaxies:
any
link with radio-loudness?††thanks: Based on observations carried out with
the IRAM 30m telescope. IRAM is supported by INSU/CNRS (France), MPG
(Germany), and IGN (Spain).
Aims. We want to study the amount of molecular
gas in a sample of nearby early-type galaxies (ETGs) which host
low-luminosity Active Galactic Nuclei (AGN). We look for possible differences
between the radio-loud (RL) and radio-quiet (RQ) AGN.
Methods. We observed the CO(1-0) and CO(2-1)
spectral lines with the IRAM 30m and NRO 45m telescopes for eight
galaxies. They belong to a large sample of 37 local ETGs which host
both RQ and RL AGN. We gather data from the literature for the
entire sample.
Results. We report the new
detection of CO(1-0) emission in four galaxies (UGC 0968,
UGC 5617, UGC 6946, and UGC 8355) and CO(2-1) emission in two of
them (UGC 0968 and UGC 5617). The CO(2-1)/CO(1-0) ratio in these sources is
. Considering both the new observations and the
literature, the detection rate of CO in our sample is 55
9%, with no statistically significant difference between the
hosts of RL and RQ AGNs. For all the detected galaxies we converted
the CO luminosities into the molecular masses, , that
range from 106.5 to 108.5 M⊙, without any
statistically significant differences between RL and RQ
galaxies. This suggests that the amount of molecular gas does not
likely set the radio-loudness of the AGN. Furthermore, despite
the low statistical significance, the presence of a weak trend
between the H2 mass with various tracers of nuclear activity
(mainly [O III] emission line nuclear power) cannot be
excluded.
Key Words.:
Galaxies: active – Galaxies: elliptical and lenticular, cD – Galaxies: nuclei – Galaxies: ISM – ISM: molecules1 Introduction
CO is the most abundant molecule in galaxies after H2 (CO/H2 ); it is easy to excite, and it radiates efficiently at frequencies which can be observed fairly easily from the ground. Rotational transitions of CO are therefore the best tracers of cold molecular gas in galaxies.
In general, early-type galaxies (ETGs) contain an interstellar medium (ISM) with components similar to those found in spiral galaxies as shown by radio, optical, and X-ray observations. However, the detailed analysis of the gas components of large samples of galaxies has shown the existence of differences in ISM between galaxies of different morphological types. In addition, the spatial distribution and the relative gas fraction of the different phases differ between early and late-type galaxies. The molecular gas in ETGs seems to be more centrally concentrated than in later types (e.g., Böker et al. 2003; Komugi et al. 2008; Davis et al. 2013). In elliptical galaxies a hot X-ray radiating coronal halo is the most massive gaseous component with masses between 108 and 1010 M⊙ (e.g., Fabbiano 1989). Warm ionized gas with estimated masses of M⊙ is found in 60% of the observed ellipticals (e.g., Phillips et al. 1986; Sadler 1987; Burstein et al. 1997; Beuing et al. 1999; Bettoni et al. 2003). The presence of a cold gas component in ellipticals has been initially inferred from observations of HI and mid- and far-infrared emission (Knapp et al. 1985, 1989). A growing number of ellipticals are found to contain a molecular gas component with masses ranging from 107 to 1010 M⊙ (e.g., Lees et al. 1991; Wiklind et al. 1995; Young 2002, 2005; Bettoni et al. 2003; Combes et al. 2007; Sage et al. 2007; Young et al. 2011; O’Sullivan et al. 2014).
Moreover, since an ETG can host both RL and RQ AGN, this type of galaxies appears to be a critical class of objects where a large variety of nuclear and host properties might help us to understand their connection. The relative fraction of hot and cold gas phase, traced by the X-ray emitting coronal emission and the CO molecule present in the ISM of ETGs, might play an important role in their accretion mode and their radio-loudness. Recently, Werner et al. (2014) studied the properties of the multi-phase gas in ETGs and their role in fueling radio-mode AGN feedback.
In order to quantify the molecular gas content in the ETGs, we will take advantage on the substantial knowledge about the multiband nuclear and host properties of a sample of ETGs described below. Capetti & Balmaverde (2005) studied the optical surface brightness profiles based on the HST images of 37 nearby ETGs, by separating the ETGs on the basis of the inner logarithmic slope into Core (0.3) and Power-law (0.5) galaxies (hereafter CoreG and PlawG, respectively). This sample includes both RL and RQ AGN. On one hand, the CoreG show flat optical core and host RL AGN, with multiwavelength nuclear and host properties similar to those of the FR Is (Fanaroff & Riley 1974). On the other hand, PlawG are the counterparts of the RQ Seyfert galaxies in ETGs at smaller nuclear luminosities with similar sharp inner optical profiles (Capetti & Balmaverde 2007).
In this work we will explore the link between the molecular gas present in these complete samples of ETGs and the radio-loudness and the nuclear properties. The structure of this paper is as follows. In Sect. 2, we describe our observations and the literature data we used to complete the sample. In Sect. 3, we present the results giving H2 masses of galaxies and the computed CO(2-1)/CO(1-0) ratio. In Sect 4. we search for empirical relations between the molecular gas and the nuclear activity, considering the entire sample of CoreG and PlawG. In Sect. 5, we summarize the results and draw the conclusions.
We adopt a Hubble constant of H0 = 71 km s-1 Mpc-1 and q0 = 0.5. Assuming a different cosmology would not affect our results since the redshift of the sources considered in this paper is limited to .
2 Sample, observations and data
The galaxies studied in this work belong to a sample of luminous (B 14), nearby (Vrec 3000 km s-1) ETGs. Wrobel & Heeschen (1991) performed a VLA survey with a flux cutoff of 1 mJy at 5 GHz on this sample. For the radio-detected objects, Capetti & Balmaverde (2005) used archival HST observations, available for 48 objects, to study their surface brightness profiles and to separate these ETGs following the Nukers scheme (Faber et al. 1997) rather than the traditional morphological classification (i.e. into E and S0 galaxies). They divided the sample in CoreG and PlawG, characterized respectively by a flat and a sharp inner logarithmic slope of their optical brightness profiles. For 37 galaxies the surface brightness profile is sufficiently well-behaved to yield a successful classification. These sources constitute the sample studied in this work.
Their multiwavelength (radio, optical, X-ray, and emission line) properties have been analyzed in a series of papers by Capetti & Balmaverde (2005), Balmaverde & Capetti (2006), Balmaverde et al. (2006), Capetti & Balmaverde (2006), Capetti & Balmaverde (2007), Baldi & Capetti (2009), and Baldi & Capetti (in prep.). These studies show that the two optical classes of objects correspond to different AGN properties. On one hand, the CoreG represent ’miniature radio galaxies’, i.e. a scaled-down version of FR Is (Baldi & Capetti 2009). They invariably host RL nuclei, spectroscopically classified as low-excitation galaxies, with an average radio-loudness parameter of R=L/L4000, similarly to FR Is. In addition, they share with the FR Is a common non-thermal AGN jet origin of the radio, X-ray, and optical nuclear emission (e.g., Chiaberge et al. 1999; Balmaverde & Capetti 2006). On the other hand, the PlawG are low-luminosity RQ AGN (on average 100 time less RL than the CoreG), mostly with LINER spectra, but in a few cases they are also associated with Seyfert optical spectra (Baldi & Capetti in prep.). They show a deficit in radio luminosity at a given optical and X-ray luminosity with respect to the CoreG (Capetti & Balmaverde 2006, 2007; Kharb et al. 2012). Although the sample is detected in the radio band as well in other wavelengths thanks to deep multiband surveys, the sample is not radio-selected since it includes both RQ and RL AGN (20 and 17 sources, respectively).


| 12CO(1-0) | 12CO(2-1) | ||||||||||
|---|---|---|---|---|---|---|---|---|---|---|---|
| Galaxy Name | V | Telescope | rms | Profile | rms | M | CO ratio | ||||
| km s-1 | K km s-1 | km s-1 | mK | K km s-1 | s-1 | mK | 108 M⊙ | ||||
| UGC0968 | 2379 | IRAM | 3.450.58 | 430 | 7.2 | dh | 5.91.2 | 430 | 10 | 1.480.25 | 0.600.2 |
| UGC5617 | 1151 | IRAM | 1.400.40 | 304 | 5.9 | sp | 3.030.37 | 300 | 3.8 | 0.310.09 | 0.750.2 |
| UGC6860 | 1259 | NRO | 9.4 | - | 11.0 | 0.85 | |||||
| UGC6946 | 1040 | IRAM | 4.8 | - | 4.1 | 1.2 | - | 3.7 | 0.71 | ||
| UGC6946 | 1040 | NRO | 2.50.7 | 187 | 9.0 | dh | 0.170.05 | ||||
| UGC7203 | 2215 | IRAM | 4.5 | - | 4.5 | 1.4 | - | 4.6 | 2.95 | ||
| UGC8355 | 2778 | NRO | 2.30.7 | 240 | 8.2 | sp | 0.910.28 | ||||
| UGC8499 | 2533 | NRO | 10.5 | - | 14.9 | 3.6 | |||||
| UGC9706 | 1714 | IRAM | 4.3 | - | 3.7 | 2.9 | - | 7.3 | 1.6 | ||
Column description: (1) name; (2) recession velocity; (3) telescope used for the observation; CO(1-0) observations: (4) integrated line emission in K km s-1; (5) velocity width; (6) rms of the spectrum in mK; (7) shape of the line profile: dh (double-horn), sp (single peak); CO(2-1) observations: (8) integrated line emission in K km s-1; (9) spectral region of integration; (10) rms of the spectrum in mK; (11) evaluation of H2 mass from CO(1-0) line intensity; (12) CO(2-1)/CO(1-0) ratio.


We proposed to observe with the Nobeyama Radio Observatory (NRO) 45 m telescope in Nobeyama (Japan) and with IRAM 30 m telescope in Pico Veleta (Spain) the sources of the sample which do not have previous CO detections. In this work we report the CO data for the eight sources whose we got observing time in April and October-November 2007, respectively for the NRO and IRAM telescopes. Four galaxies were observed with the NRO telescope covering the CO(1-0) line at 115 GHz, and five with the IRAM 30m telescope to detect the CO(1-0) line as well as the CO(2-1) line at 230 GHz. UGC 6946 was observed with both telescopes. The beam full width at half maximum (FWHM) of NRO at 115 GHz is 15″, while those of the IRAM 30m telescope are, respectively, 22″ and 13″ at the two CO lines frequencies. The observations at NRO were carried out with S100 receiver and with Auto Correlator (AC) spectrometer with a band width of 512 MHz, whereas those at IRAM 30m telescope using the wobbler switching mode with band widths of 512 and 1024 MHz, respectively, for the two frequencies.
For NRO we spent 5 hours for single object to reach an RMS noise of 3 mK for 30 km s-1 channel. Instead the total integration time for each source observed with the IRAM 30m telescope was 1–3 hours, resulting in a relatively homogeneous level of noise of 2 mK per 15 and 30 km s-1 channel, respectively, for the two CO frequencies. The signal is expressed in main beam temperature Tmb, since the sources are not expected to be extended and homogeneous. Tmb is related to the equivalent antenna temperature reported above the atmosphere (T) by TTmb, where is the telescope main-beam efficiency. For IRAM telescope, at 115 GHz = 0.79 and at 230 GHz = 0.54, while for NRO telescope 0.34 at 115 GHz. Each spectrum was summed and reduced using linear baselines.
3 Results
3.1 CO spectra
Let us now present the new CO observations of the 8 objects: Fig. 1 shows the NRO spectra for the CO(1-0) rotational transition for four objects and Fig. 2 shows the IRAM spectra for both the CO(1-0) and CO (2-1) lines for five objects. We detect the CO(1-0) and CO(2-1) lines for 4 (out of 9) and 2 (out of 5) of the observed objects, respectively.
Since some lines have complex profiles, to yield a correct measurement of the flux for the 3- detected line, we directly integrate the Tmb profile on the spectrum for all the sources:
For the undetected CO lines, assuming a typical 250 km s-1 line width (e.g., Young et al. 2011), corresponding to a good sampling of the line with at least 8 (16) points in the spectrum with 30 (15) km s-1 of spectral resolution for NRO (IRAM) telescope, the 1 upper limits are evaluated in this way:
where Nch is the number of channel covered in 250 km s-1 line width () and RMS is the temperature rms of the spectrum.
Among the 4 sources showing CO(1-0) detection, UGC 0968 and UGC 6946 exhibit double-horn profiles, while UGC 5617 and UGC 8355 have single-peak profiles. Galaxies detected in the CO(2-1) line (UGC 0968 and UGC 5617) have profiles similar to those found in the CO(1-0) line. In Tab. 1, we collect the CO(1-0) and CO(2-1) line properties for the observed objects.
Among the objects of the sample, a few have additional CO measurement in the literature. For UGC 5617, Lisenfeld et al. (2008) measured both the CO lines with IRAM telescope: ICO(1-0) = 1.3 K km s-1, consistent with our IRAM CO flux and ICO(2-1) = 0.7 K km s-1, slightly smaller than our measurement. Our non-detections of CO(1-0) for UGC 8499 and UGC 9706 are also consistent with the upper limits reported by Combes et al. (2007) with IRAM telescope, 2.37 and 4.8 K km s-1, respectively.
3.2 CO emission and H2 mass estimation
From standard, empirical calibrations, it is possible to deduce the interstellar H2 mass content from the integrated CO intensity ICO (K km s-1). We adopt here the conversion factor commonly used for
in molecule/cm2 unit. From this equation, the mass of cold molecular hydrogen contained in one beam of the telescope is:
where is the conversion factor, whose commonly used value is 4.8 M⊙ (K km s-1 pc2)-1 (Solomon & Barrett 1991), derived from galactic molecular cloud observations, and Abeam is the beam area at the galaxy in pc2.
The conversion between CO and M column densities/masses remains controversial. Its value varies with the physical gas conditions, metallicity, and environmental factors (e.g., Maloney 1990; Israel 1997; Boselli et al. 2002; Bolatto et al. 2008; Glover & Mac Low 2011; Magrini et al. 2011) and can change by a factor 4-15 (e.g., Wilson & Colbert 1995; Casasola et al. 2007). The conversion H2-CO value also changes with galaxy morphological type: galaxies earlier than Scd type usually show values comparable to, or lower than, the Galactic one, while extremely late-type spirals or irregular galaxies tend to show higher values (Arimoto et al. 1996).
The H2 can be underestimated if the molecular cloud is more extended than the beam area covered on the galaxy. In our case such a physical region at the distance of the sources corresponds to an aperture which ranges from 0.5 to 4 kpc for the CO(1-0) transition. CO interferometric observations show that the molecular gas in ETGs is centrally concentrated in the central kiloparsecs (e.g., Braine et al. 1993; Boselli et al. 2002; Böker et al. 2003; Komugi et al. 2008; Davis et al. 2013). Recently, Alatalo et al. (2013), by comparing the CO fluxes recovered from 30m spectra and from full interferometric maps (from CARMA) for a sample of local ETGs, found that up to half of the molecular mass of a source (at a similar distance to our sample) measured with the 30m telescope can be missed. However, no large differences are expected between the 30m and 45m telescope observations. Therefore, this effect should not effect significantly our results.
With the method explained above, the H2 masses estimated for the eight galaxies are , and all values, including the CO upper limits, are listed in Tab. 2.
3.3 CO(2-1)/CO(1-0) ratio
The CO(2-1)/CO(1-0) is measured by the ratio between the integrated emission of the two lines on equal regions of the galaxy. Because of the different beam sizes at 115 and 230 GHz, a beam dilution factor is necessary to correct the different spatial resolution, that corresponds to 4, the ratio of the beam areas for the two lines, assuming the gas distribution of both CO(3-2) and CO(1-0) is compact. Therefore the CO(1-0) lines intensities have been multiplied by this beam correcting factor to be compared to the CO(2-1) lines. It is possible to evaluate this ratio only for two objects, namely UGC 0968 and UGC 5617 (Tab. 1). For UGC 0968 the assumption of a compact CO distribution is less obvious, since one peak of the CO(2-1) horn profile is less pronounced than in CO(1-0). This might suggest that the H2 emitting region is intermediate between the two beam sizes. However, both values are consistent within the uncertainties with the CO(2-1)/CO(1-0) line ratio (0.6) found for samples of radio galaxies (Ocaña Flaquer et al. 2010) and Seyfert galaxies (Papadopoulos & Seaquist 1998).
| Name | z | Ref. | class | dust | |||||
| UGC 0968 | 0.007935 | 8.17 | this work | 36.96 | 39.77 | 37.75 | CoreG | Y | |
| UGC 5902 | 0.003039 | 6.70 | CO07 | 35.83 | 39.10 | 38.40 | 37.96 | CoreG | N |
| UGC 6297 | 0.003202 | 8.37 | WE03 | 36.84 | 39.06 | 38.40 | 38.21 | CoreG | Y |
| UGC 7203 | 0.007388 | 8.47 | this work | 37.44 | 39.85 | 38.93 | 38.08 | CoreG | N |
| UGC 7360 | 0.007465 | 7.84 | OC10 | 39.22 | 39.71 | 40.95 | 38.91 | CoreG | N |
| UGC 7386 | 0.002165 | 7.36 | CO07 | 38.38 | 38.76 | 39.72 | 38.95 | CoreG | N |
| UGC 7494 | 0.003536 | 7.51 | WI95 | 38.57 | 39.27 | 39.30 | 38.20 | CoreG | N |
| UGC 7629 | 0.003326 | 7.60 | HU94 | 36.73 | 38.79 | 38.23 | 37.40 | CoreG | Y |
| UGC 7654 | 0.004360 | 7.72 | OC10 | 39.90 | 40.72 | 40.30 | 38.99 | CoreG | N |
| UGC 7760 | 0.001134 | 7.23 | CO07 | 37.30 | 38.73 | 38.40 | 37.28 | CoreG | Y |
| UGC 7797 | 0.006605 | 7.96 | SO93 | 38.05 | 40.19 | 38.79 | CoreG | Y | |
| UGC 7878 | 0.003129 | 6.85 | SA07 | 36.90 | 39.07 | 38.41 | 37.89 | CoreG | Y |
| UGC 7898 | 0.003726 | 7.80 | SA89 | 37.46 | 39.13 | 38.52 | 37.34 | CoreG | N |
| UGC 8745 | 0.005851 | 37.81 | 38.41 | CoreG | Y | ||||
| UGC 9655 | 0.006578 | 7.46 | CO07 | 36.96 | 38.04 | CoreG | Y | ||
| UGC 9706 | 0.005717 | 8.20 | this work | 37.31 | 39.25 | 38.26 | 38.18 | CoreG | Y |
| UGC 9723 | 0.002242 | 7.92 | TA94 | 36.92 | 38.18 | 37.33 | CoreG | Y | |
| UGC 5617 | 0.003839 | 7.49 | this work | 36.88 | 40.51 | 40.30 | 38.75 | PlawG | Y |
| UGC 5663 | 0.004383 | 8.31 | SA89 | 36.87 | 40.57 | 38.80 | 38.59 | PlawG | Y |
| UGC 5959 | 0.004717 | 6.95 | CO07 | 37.16 | 40.54 | 39.80 | 38.77 | PlawG | Y |
| UGC 6153 | 0.008836 | 8.61 | MA97 | 38.14 | 42.11 | 42.40 | 40.80 | PlawG | Y |
| UGC 6860 | 0.004200 | 7.93 | this work | 36.38 | 40.15 | 39.60 | 38.28 | PlawG | N |
| UGC 6946 | 0.003469 | 7.24 | this work | 38.16 | 41.40 | 41.00 | 39.42 | PlawG | Y |
| UGC 6985 | 0.003102 | 7.94 | WE03 | 36.31 | 40.56 | 37.51 | PlawG | N | |
| UGC 7005 | 0.004820 | 36.94 | 40.37 | 40.40 | 39.09 | PlawG | Y | ||
| UGC 7103 | 0.002692 | 7.20 | WE03 | 36.39 | 40.85 | 39.40 | 38.45 | PlawG | N |
| UGC 7142 | 0.003196 | 6.65 | WE03 | 36.96 | 40.44 | 39.90 | 38.71 | PlawG | Y |
| UGC 7256 | 0.003623 | 6.88 | WE03 | 37.33 | 40.57 | 40.20 | 39.01 | PlawG | Y |
| UGC 7311 | 0.007909 | 37.07 | 38.35 | PlawG | Y | ||||
| UGC 7575 | 0.002672 | 7.98 | VO05 | 36.00 | 39.30 | 38.72 | PlawG | Y | |
| UGC 7614 | 0.004036 | 8.23 | CO07 | 36.15 | 40.47 | 40.40 | 37.85 | PlawG | Y |
| UGC 8355 | 0.009267 | 7.96 | this work | 36.69 | 41.27 | 38.31 | PlawG | N | |
| UGC 8499 | 0.008449 | 8.56 | this work | 37.09 | 40.37 | 38.31 | PlawG | N | |
| UGC 8675 | 0.003549 | 7.90 | MA97 | 36.34 | 40.33 | 40.60 | 39.66 | PlawG | Y |
| UGC 9692 | 0.004533 | 7.34 | CO07 | 36.65 | 40.41 | 37.92 | PlawG | Y | |
| UGC 10656 | 0.009306 | 37.05 | 40.96 | 40.10 | 38.90 | PlawG | N | ||
| UGC 12759 | 0.005704 | 8.12 | MA97 | 36.93 | 40.49 | 41.47 | 39.51 | PlawG | N |
Column description: (1) name; (2) redshift; (3) mass in M⊙ and references (4): CO07 Combes et al. (2007), WE03 Welch & Sage (2003), OC10 Ocaña Flaquer et al. (2010), WI95 Wiklind et al. (1995), HU94 Huchtmeier et al. (1994), SO93 Sofue & Wakamatsu (1993), SA07 Sage et al. (2007), SA89 Sage & Wrobel (1989), TA94 Taniguchi et al. (1994), MA97 Maiolino et al. (1997), VO05 Vollmer et al. (2005); nuclear luminosities [erg s-1] from Balmaverde & Capetti (2006) and Capetti & Balmaverde (2006) in (5) radio, (6) optical, and (7) and X-ray (2-10 keV); (8) [O III] emission line luminosity [erg s-1] from Capetti & Balmaverde (2006), Baldi & Capetti (2009); (9) optical profile; (10) presence of dust structure in HST optical image? Y for yes and N for no.

4 H2 mass for the sample of nearby ETGs
We collect from the literature the masses, estimated from CO(1-0) observations, of the remaining objects of the sample studied by Capetti & Balmaverde (2006). Combining our new results and the literature data, we now have CO observations for all but 4 (out of 37) sources. Tab. 2 shows the values of molecular masses and the appropriate references for the entire samples of CoreG and PlawG.
The overall CO detection rate is 559% and it is similar for the two classes of brightness profiles (5012% for the CoreG and 5912% for the PlawG, respectively). The distributions of the molecular masses for the two sub-samples (left panel in Fig. 3) is 106.5 - 108.5 M⊙. This broad range is consistent with the molecular masses found in other samples of ETGs, on average, of several 107 M⊙ (e.g., Lees et al. 1991; Wiklind et al. 1995; Combes et al. 2007; Crocker et al. 2011; Young et al. 2011).
Given the presence of no-detections in the data, we use the Kaplan-Meier product-limit estimator (Kaplan & Meier 1958) which provides the mean values for distribution of with the assumption that the censoring is random, condition fulfilled in our data. For CoreG, = (7.4 0.2) M⊙ and for PlawG, = (7.5 0.2) M⊙. The two average values are consistent with each other within the errors.
To asses the presence of significantly statistical difference between the distributions of CoreG and PlawG, we use the ‘twosampt’ task of the Astronomy Survival Analysis (ASURV) package (Lavalley et al. 1992). This package is available under IRAF/STSDAS and provides us a tool to deal with censored data (Feigelson & Nelson 1985, Isobe et al. 1986). In particular, the Peto-Prentice test (Peto & Peto 1972) quantifies the distance between the empirical distribution functions of two samples, with the null hypothesis that they are drawn from the same distribution. The result of the test is that the M distribution of CoreG and PlawG are not drawn from different parent populations with a confidence level greater than 95%.
In Fig. 4 we compare the molecular masses and stellar luminosity, , estimated from the K-band absolute magnitude of the galaxy. The contribution of molecular mass is in the range of the galaxy luminosity (corresponding to the galaxy mass). Capetti & Balmaverde (2006) found that the CoreG hosts are more luminous and so more massive than those of the PlawG. Yet, the Peto-Prentice test keeps on confirming that the CoreG and PlawG are not significantly different in terms of fraction , with a confidence level greater than 95%.

We further investigate the presence of a difference between CoreG and PlawG in the HST optical images (Capetti & Balmaverde 2005) to look for an association between the presence of dust and the CO detection. We exclude the 4 objects (UGC 7005, UGC 7311, UGC 8745, and UGC 10656) that have no CO observations (Tab. 2). Most of the objects (20/33) shows evident optical obscuration in the nuclear region. Among the 20 objects with dust presence in their hosts, 11 have a CO detection. Among the 13 objects without dust structure, 7 have a CO detection. This implies that there is no a clear association between the presence of dust and the CO detection in the ETGs of our sample. In addition, the dust is indifferently present in CoreG and PlawG.
4.1 Molecular gas and nuclear properties
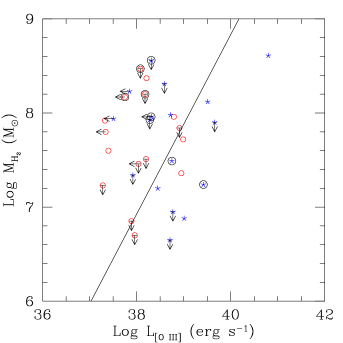
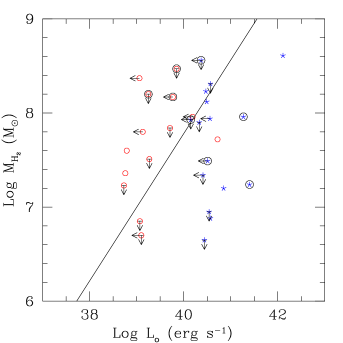
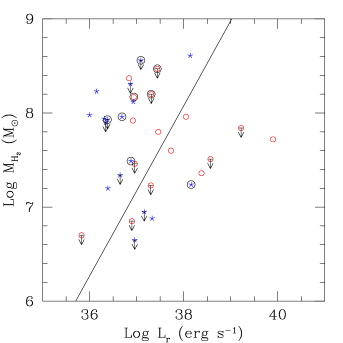
Another approach to study the molecular gas content in our sample of ETGs is to look for a possible connection with their nuclear properties by considering the multiwavelength emission from their AGN. Operatively, we compare M with various tracers of nuclear activity, in terms of radio (at 5 GHz), optical, X-ray (2-10 keV) and [O III] emission line nuclear power for the entire sample (see panels in Fig. 5).
At a first glance, the panels of Fig. 5 shows ’trends’, with relatively large scatters, between the H2 mass and different indicators of the AGN power. Our new CO measurements are, on average, located at large molecular masses and intermediate nuclear luminosities. However, it is interesting to point out that UGC 6946 which has the lowest mass among the new CO detection is one of the most luminous sources in [O III], X-ray, optical, and radio of the sample.
To assess the presence of correlations, we performed a statistical censored analysis using the ASURV package. Note that the method we use is based on the assumption that the censored data are uniformly distributed, condition that is satisfied for our data. We used the “schmittbin” task (Schmitt 1985) to calculate the associated linear regression coefficients for two sets of variables. Operatively, we carried out this procedure twice, obtaining two linear regressions: first, we considered the former quantity as the independent variable and the latter as the dependent one; second, we switched the roles of the variables. The best fit is represented by the bisector of these two regression lines. This follows the suggestion of Isobe et al. (1990) that consider such a method preferable for problems that require a symmetrical treatment of the two variables. In order to estimate the quality of the linear regression, we derived the generalized Kendall’s (Kendall 1983) between the two variables, using the “bhkmethod” task. The statistical parameters of all the linear regressions are reported in Tab. 3.
Although the low statistical parameters, the presence of a weak trend between the [O III] line luminosity and (upper left panel of Fig. 5) can be marginally considered. The Kendall’s coefficient is 0.140 with an associated probability, that a fortuitous correlation appears at a level measured by our test statistic, of 0.42. For the other tracers of the nuclear activity, X-ray, optical and radio band (right upper panel and lower panels of Fig. 5), the statistical significance of a relation with the molecular gas mass is lower. In fact, the probability which a fortuitous relation appears in those plots are 0.65, 0.69, and 0.67, respectively (Table 3). In the - panel the lack of the relation is also probably driven by the the different radio-loudness of CoreG and PlawG. We cannot establish the type of relation between LAGN and M since the slopes of the trends are not well constrained due to the low statistics.
Although caution is advised, the significant scatter observed in the observed trends M-LAGN suggests that, if a connection between nuclear properties and molecular gas content is present, it is certainly affected by complex mechanisms. The lack of clear starburst regions in the optical HST images (Capetti & Balmaverde 2005) and no evidence of young stellar populations in their optical spectra (Baldi & Capetti 2009) rule out the star formation origin of these trends. A reasonable, but not obvious, explanation of the trends might be the most basic mechanism of heating of the molecular clouds by high-energy photons (e.g., UV and X-ray photons) from the AGN, as suggested by Braine & Combes (1992). The increase of the AGN luminosity might account for the increase of the CO luminosity, i.e. the molecular mass heated by the radiation field and, then, emitting CO lines. The possible sources of the production of high-energy photons are the accretion disk and the relativistic radio jet. The contribution of the former is important for the (RQ) PlawG, while the latter for the (RL) CoreG (Capetti & Balmaverde 2006; Balmaverde & Capetti 2006). This explanation is in line with the results of Nesvadba et al. (2010) and Ogle et al. (2010) for RL AGN, consistent with a model of cold gas emission powered by the dissipation of mechanical energy through shocks by radio jets.

| Relation | Class | Nd | Nc | Pτ | m | q | |
|---|---|---|---|---|---|---|---|
| (1) | (2) | (3) | (4) | (5) | (6) | (7) | (8) |
| L-M | all | 13 | 20 | 0.140 | 0.416 | 0.950.30 | -2917 |
| LX-M | all | 11 | 15 | 0.092 | 0.647 | 0.820.40 | -2520 |
| Lo-M | all | 11 | 19 | 0.064 | 0.694 | 0.780.40 | -2422 |
| Lr-M | all | 17 | 15 | -0.079 | 0.674 | 0.900.40 | -2617 |
Column description: (1) relation studied; (2) sample considered; (3) number of sources with both the two quantities detected; (4) number of sources that show, at least, an upper limit in one of the two quantities; (5) the generalized Kendall’s , considering all the data; (6) Pτ probability associated with that the correlation is not present; (7)-(8) slope coefficient and intercept coefficient for the linear regression ().
5 Summary and conclusions
We have analyzed the CO(1-0) and CO(2-1) transition spectra for eight nearby galaxies observed with NRO and IRAM telescopes. These sources belong to a sample of 37 ETGs whose nuclear and host properties are well studied: they host low-luminosity RL and RQ AGN associated with flat (CoreG) or sharp (PlawG) optical profile, respectively. We convert the CO(1-0) luminosities in H2 mass using standard correction factors. To complete the sample, we found in literature the molecular masses for the remaining of the sample, ranging from 106.5 to 108.5 M⊙.
Despite they differ in nuclear and host properties, we do not find any statistical significant difference in terms of molecular gas content between CoreG and PlawG. This suggests that the amount of molecular gas does not seem to be related to the radio-loudness of the AGN in an ETG. Since single-dish observations do not provide a spatial information of the molecular gas distribution, it is reasonable to propose that the properties of the multi-phase gas at the nuclear scale, instead of the galaxy scale, sets the accretion mode and the radio-loudness of the AGN. In fact, at the center of low-luminosity radio galaxies (which include CoreG), on some parsecs scale, hot gas is known to be responsible to regulate the nuclear activity (e.g., Allen et al. 2006; Balmaverde et al. 2008; Nemmen & Tchekhovskoy 2014).
Furthermore, we look for possible connection between the molecular gas content and the nuclear activity in [O III] line, X-ray, optical, and radio band. We do not find highly significant correlations. However, the censored analysis indicates that the presence of a trend between the H2 mass and the [O III] luminosity cannot be excluded. We interpret this link in terms of a possible increase in CO luminosity produced by heating of the molecular mass by the AGN radiation field which also illuminates the narrow-line region. This scenario still needs to be confirmed on a larger sample of RQ/RL AGN. This will be addressed to a forthcoming paper. Furthermore, it is fundamental to increase the number of CO detection to improve the statistics. The ALMA telescope certainly will play a decisive role in this field in the next future.
Acknowledgements.
This work has benefited from research funding from the European Community’s sixth Framework Programme under RadioNet R113CT 2003 5058187. RDB was supported at the Technion by a fellowship from the the Lady Davis Foundation. We thank the referee for the constructive comments that have helped us to improve the paper.References
- Alatalo et al. (2013) Alatalo, K., Davis, T. A., Bureau, M., et al. 2013, MNRAS, 432, 1796
- Allen et al. (2006) Allen, S. W., Dunn, R. J. H., Fabian, A. C., Taylor, G. B., & Reynolds, C. S. 2006, MNRAS, 372, 21
- Arimoto et al. (1996) Arimoto, N., Sofue, Y., & Tsujimoto, T. 1996, PASJ, 48, 275
- Baldi & Capetti (2009) Baldi, R. D. & Capetti, A. 2009, A&A, 508, 603
- Balmaverde et al. (2008) Balmaverde, B., Baldi, R. D., & Capetti, A. 2008, A&A, 486, 119
- Balmaverde & Capetti (2006) Balmaverde, B. & Capetti, A. 2006, A&A, 447, 97
- Balmaverde et al. (2006) Balmaverde, B., Capetti, A., & Grandi, P. 2006, A&A, 451, 35
- Bettoni et al. (2003) Bettoni, D., Galletta, G., & García-Burillo, S. 2003, A&A, 405, 5
- Beuing et al. (1999) Beuing, J., Dobereiner, S., Bohringer, H., & Bender, R. 1999, MNRAS, 302, 209
- Böker et al. (2003) Böker, T., Lisenfeld, U., & Schinnerer, E. 2003, A&A, 406, 87
- Bolatto et al. (2008) Bolatto, A. D., Leroy, A. K., Rosolowsky, E., Walter, F., & Blitz, L. 2008, ApJ, 686, 948
- Boselli et al. (2002) Boselli, A., Lequeux, J., & Gavazzi, G. 2002, A&A, 384, 33
- Braine & Combes (1992) Braine, J. & Combes, F. 1992, A&A, 264, 433
- Braine et al. (1993) Braine, J., Combes, F., Casoli, F., et al. 1993, A&AS, 97, 887
- Burstein et al. (1997) Burstein, D., Bender, R., Faber, S., & Nolthenius, R. 1997, AJ, 114, 1365
- Capetti & Balmaverde (2005) Capetti, A. & Balmaverde, B. 2005, A&A, 440, 73
- Capetti & Balmaverde (2006) Capetti, A. & Balmaverde, B. 2006, A&A, 453, 27
- Capetti & Balmaverde (2007) Capetti, A. & Balmaverde, B. 2007, A&A, 469, 75
- Casasola et al. (2007) Casasola, V., Combes, F., Bettoni, D., & Galletta, G. 2007, A&A, 473, 771
- Chiaberge et al. (1999) Chiaberge, M., Capetti, A., & Celotti, A. 1999, A&A, 349, 77
- Combes et al. (2007) Combes, F., Young, L. M., & Bureau, M. 2007, MNRAS, 377, 1795
- Crocker et al. (2011) Crocker, A. F., Bureau, M., Young, L. M., & Combes, F. 2011, MNRAS, 410, 1197
- Davis et al. (2013) Davis, T. A., Alatalo, K., Bureau, M., et al. 2013, MNRAS, 429, 534
- Fabbiano (1989) Fabbiano, G. 1989, ARA&A, 27, 87
- Faber et al. (1997) Faber, S. M., Tremaine, S., Ajhar, E. A., et al. 1997, AJ, 114, 1771
- Fanaroff & Riley (1974) Fanaroff, B. L. & Riley, J. M. 1974, MNRAS, 167, 31P
- Feigelson & Nelson (1985) Feigelson, E. D. & Nelson, P. I. 1985, ApJ, 293, 192
- Glover & Mac Low (2011) Glover, S. C. O. & Mac Low, M.-M. 2011, MNRAS, 412, 337
- Huchtmeier et al. (1994) Huchtmeier, W. K., Bregman, J. N., Hogg, D. E., & Roberts, M. S. 1994, A&A, 281, 327
- Isobe et al. (1990) Isobe, T., Feigelson, E. D., Akritas, M. G., & Babu, G. J. 1990, ApJ, 364, 104
- Isobe et al. (1986) Isobe, T., Feigelson, E. D., & Nelson, P. I. 1986, ApJ, 306, 490
- Israel (1997) Israel, F. P. 1997, A&A, 328, 471
- Kaplan & Meier (1958) Kaplan, E. L. & Meier, P. 1958, Nonparametric estimation from incomplete observations, Vol. 53 (J. Am. Stat. Assoc.), 457–481
- Kendall (1983) Kendall, M. 1983, A New Measure of Rank Correlation, Vol. 30 (Biometrika), 81–89
- Kharb et al. (2012) Kharb, P., Capetti, A., Axon, D. J., et al. 2012, AJ, 143, 78
- Knapp et al. (1989) Knapp, G. R., Guhathakurta, P., Kim, D., & Jura, M. A. 1989, ApJS, 70, 329
- Knapp et al. (1985) Knapp, G. R., Turner, E. L., & Cunniffe, P. E. 1985, AJ, 90, 454
- Komugi et al. (2008) Komugi, S., Sofue, Y., Kohno, K., et al. 2008, ApJS, 178, 225
- Lavalley et al. (1992) Lavalley, M., Isobe, T., & Feigelson, E. 1992, in Astronomical Society of the Pacific Conference Series, Vol. 25, Astronomical Data Analysis Software and Systems I, ed. D. M. Worrall, C. Biemesderfer, & J. Barnes, 245–+
- Lees et al. (1991) Lees, J. F., Knapp, G. R., Rupen, M. P., & Phillips, T. G. 1991, ApJ, 379, 177
- Lisenfeld et al. (2008) Lisenfeld, U., Mundell, C. G., Schinnerer, E., Appleton, P. N., & Allsopp, J. 2008, ApJ, 685, 181
- Magrini et al. (2011) Magrini, L., Bianchi, S., Corbelli, E., et al. 2011, A&A, 535, A13
- Maiolino et al. (1997) Maiolino, R., Ruiz, M., Rieke, G. H., & Papadopoulos, P. 1997, ApJ, 485, 552
- Maloney (1990) Maloney, P. 1990, in Astrophysics and Space Science Library, Vol. 161, The Interstellar Medium in Galaxies, ed. H. A. Thronson Jr. & J. M. Shull, 493–523
- Nemmen & Tchekhovskoy (2014) Nemmen, R. S. & Tchekhovskoy, A. 2014, ArXiv e-prints
- Nesvadba et al. (2010) Nesvadba, N. P. H., Boulanger, F., Salomé, P., et al. 2010, A&A, 521, A65+
- Ocaña Flaquer et al. (2010) Ocaña Flaquer, B., Leon, S., Combes, F., & Lim, J. 2010, A&A, 518, A9+
- Ogle et al. (2010) Ogle, P., Boulanger, F., Guillard, P., et al. 2010, ApJ, 724, 1193
- O’Sullivan et al. (2014) O’Sullivan, E., Combes, F., Hamer, S., et al. 2014, ArXiv e-prints
- Papadopoulos & Seaquist (1998) Papadopoulos, P. P. & Seaquist, E. R. 1998, ApJ, 492, 521
- Peto & Peto (1972) Peto, R. & Peto, J. 1972, Asymptotically efficient rank invariant procedures, Vol. 135 (Journal of the Royal Statistical Society), 185–207
- Phillips et al. (1986) Phillips, M. M., Jenkins, C. R., Dopita, M. A., Sadler, E. M., & Binette, L. 1986, AJ, 91, 1062
- Sadler (1987) Sadler, E. M. 1987, in IAU Symposium, Vol. 127, Structure and Dynamics of Elliptical Galaxies, ed. P. T. de Zeeuw, 125–132
- Sage et al. (2007) Sage, L. J., Welch, G. A., & Young, L. M. 2007, ApJ, 657, 232
- Sage & Wrobel (1989) Sage, L. J. & Wrobel, J. M. 1989, ApJ, 344, 204
- Schmitt (1985) Schmitt, J. H. M. M. 1985, ApJ, 293, 178
- Sofue & Wakamatsu (1993) Sofue, Y. & Wakamatsu, K. 1993, PASJ, 45, 529
- Solomon & Barrett (1991) Solomon, P. M. & Barrett, J. W. 1991, in IAU Symposium, Vol. 146, Dynamics of Galaxies and Their Molecular Cloud Distributions, ed. F. Combes & F. Casoli, 235–+
- Taniguchi et al. (1994) Taniguchi, Y., Murayama, T., Nakai, N., Suzuki, M., & Kameya, O. 1994, AJ, 108, 468
- Vollmer et al. (2005) Vollmer, B., Braine, J., Combes, F., & Sofue, Y. 2005, A&A, 441, 473
- Welch & Sage (2003) Welch, G. A. & Sage, L. J. 2003, ApJ, 584, 260
- Werner et al. (2014) Werner, N., Oonk, J. B. R., Sun, M., et al. 2014, MNRAS, 439, 2291
- Wiklind et al. (1995) Wiklind, T., Combes, F., & Henkel, C. 1995, A&A, 297, 643
- Wilson & Colbert (1995) Wilson, A. S. & Colbert, E. J. M. 1995, ApJ, 438, 62
- Wrobel & Heeschen (1991) Wrobel, J. M. & Heeschen, D. S. 1991, AJ, 101, 148
- Young (2002) Young, L. M. 2002, AJ, 124, 788
- Young (2005) Young, L. M. 2005, ApJ, 634, 258
- Young et al. (2011) Young, L. M., Bureau, M., Davis, T. A., et al. 2011, MNRAS, 414, 940