ASTRO-H Space X-ray Observatory
White Paper
Plasma Diagnostic and Dynamics of the Galactic Center Region
K. Koyama (Kyoto University),
J. Kataoka (Waseda University),
M. Nobukawa (Kyoto University),
H. Uchiyama (Shizuoka University),
S. Nakashima (JAXA),
F. Aharonian (Max Planck Institute für Kernphysik & Dublin Institute for Advanced Studies),
M. Chernyakova (Dublin Institute for Advanced Studies),
Y. Ichinohe (JAXA & University of Tokyo),
K. K. Nobukawa (Kyoto University),
Y. Maeda (JAXA),
H. Matsumoto (Nagoya University),
H. Murakami (Tohoku Gakuin University),
C. Ricci (Kyoto University),
L. Stawarz (JAXA),
T. Tanaka (Kyoto University),
T. G. Tsuru (Kyoto University),
S. Watanabe (JAXA),
S. Yamauchi (Nara Women’s University), and
T. Yuasa (RIKEN)
on behalf of the ASTRO-H Science Working Group
Complete list of the ASTRO-H Science Working Group
Abstract
The most characteristic high-energy phenomena in the Galactic center (GC) region is the presence of strong K-shell emission lines from highly ionized Si, S, Ar, Ca, Fe and Ni, which form the Galactic Center X-ray Emission (GCXE). These multiple lines suggest that the GCXE is composed of at least two plasmas with temperatures of 1 and7 keV. The GCXE also exhibits the K-shell lines from neutral Si, S, Ar, Ca, Fe and Ni atoms. A debatable issue is the origin of the GCXE plasma; whether it is a diffuse plasma or integrated emission of many unresolved point sources such as cataclysmic variables and active binaries. Detailed spectroscopy for these lines may provide a reliable picture of the GCXE plasma. The origin of the K-shell lines from neutral atoms is most likely the fluorescence by X-rays from a putative past flare of Sgr A∗. Therefore ASTRO-H may provide unprecedented data for the past light curve of Sgr A∗. All these lines may provide key information for the dynamics of the GCXE, using possible Doppler shift and/or line broadening. This paper overviews these line features and the previous interpretation of their origin. We propose extended or revised science with the ASTRO-H observations of some select objects in the GC region.
1 Background and Previous Studies
1.1 GC Hot Plasma
Diffuse (unresolved) X-ray emission from our Galaxy was discovered just 7 years after the birth of X-ray astronomy (Cooke et al., 1969). The HEAO-A2 data were systematically searched, and revealed diffuse X-rays in the 2–10 keV band along the Galactic plane extending by about 7 kpc with half thickness of 2412 pc, and hence called as the Galactic “Ridge” X-ray emission (GRXE) (Worrall & Marshall, 1983). The EXOSAT data also show an extended emission over more than along the Galactic plane but only across it (Warwick et al., 1985).
The K-shell line from He-like iron at 6.7 keV was first discovered with the Tenma satellite (Koyama et al., 1986a). The Ginga satellite found that the 6.7 keV line profile shows a sharp peak ( and ) around the Galactic center (GC) region (Koyama et al., 1989). This peak emission is separately named as the Galactic Center X-ray Emission (GCXE). The origin of the GRXE and the GCXE has been a mystery since its discovery.
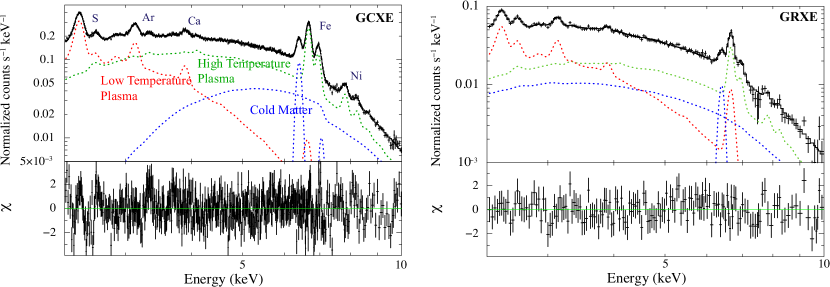
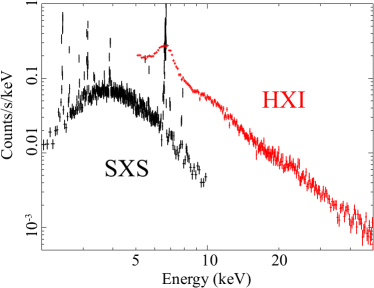
Recently, the superior spectral capability of the Suzaku satellite provide excellent X-ray spectra of the GCXE and GRXE as are shown in figure 1. The co-existence of the highly ionized S and Fe lines indicates that the GCXE and GRXE are due to hot plasmas consisting of at least two temperature components: low temperature plasma (LP; keV) and high temperature plasma (HP; keV). If the plasmas are truly “diffuse” gases, the temperatures are too high to be confined by the gravity of the Galaxy, and hence the plasma gas should escape from the Galactic center and plane regions. In order to sustain such hot plasmas in our Galaxy, huge amounts of energy need to be supplied continuously. This energy can be a result of high energy activities in the Galaxy [e.g. jets of a supermassive black hole (SMBH) Sgr A∗ (Koyama et al., 1996), reconnections of the Galactic magnetic field (Tanuma et al., 1999), presence of a large amount of supernovae remnants (Koyama et al., 1986b)].
To solve these potential problems, a “point source” scenario for the origin of the GCXE and GRXE has been also proposed. Worrall & Marshall (1983), for example, pointed out that integrated emission of many faint X-ray stars like cataclysmic variables (CVs) and active binaries (ABs) contribute up % of the GRXE. The long-exposure (1 Ms) observation of Chandra resolved about 90% of the 6.7 keV line from the Chandra Bulge Field (CBF) at into many faint point sources (Revnivtsev et al., 2009). Revnivtsev et al. (2009), Hong (2012) and Morihana et al. (2013) argued that these point sources in the CBF are mainly CVs and ABs. The CBF corresponds to the Galactic disk and bulge components and not the GC (nuclear stellar bulge and disk) components (see figure 3). Thus hereafter we regard the CBF as a part of the GRXE region. The Suzaku spectra of the GRXE in the keV band can be explained as an assembly of CVs (Yuasa et al., 2012). The extrapolated number density of these unresolved point sources can be enough to explain the luminosity of the GRXE (Sazonov et al., 2006). These results may support an idea that the major component of the GRXE is the superposition of many X-ray point sources, possibly combination of CVs and ABs. This scenario however contains a serious problem, the equivalent widths (EWs) of Fe XXV He and Fe XXVI Ly111We use the terminologies of He and He for the transition to K-shell (quantum number ) from higher excited states (quantum number and 3) of He-like atoms, respectively. in the GRXE are significantly larger than those of any mixture of known CVs and ABs (Uchiyama et al., 2013; Warwick et al., 2014).
To answer this problem, unresolved faint CVs and ABs should have about 2–3 times larger iron line EWs than those of the known bright CVs and ABs. In the faint sources, either the iron abundance is larger than known sources or other unknown mechanisms to enhance the iron line are at work.
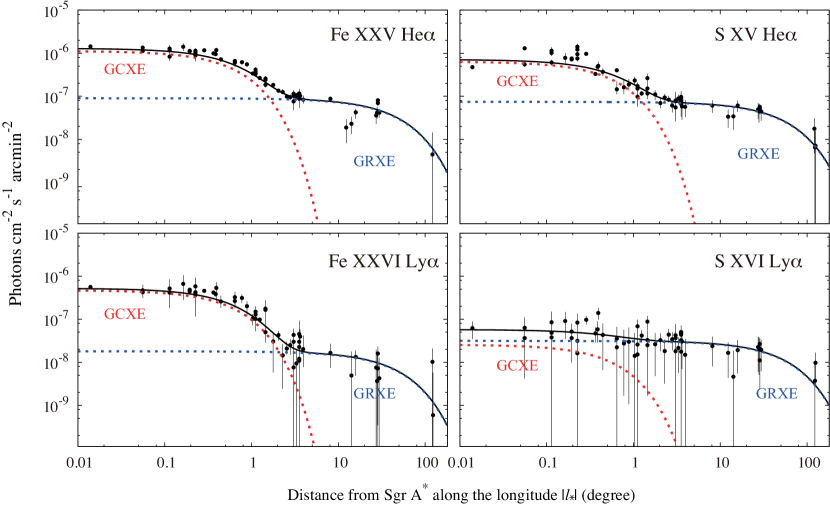
Figure 2 is the flux distributions of Fe XXV He, Fe XXVI Ly, S XV He and S XVI Ly along the Galactic plane. The longitudinal distribution profiles are different among these lines; the Fe XXVI Ly flux at the GCXE () shows larger excess relative to those of the GRXE compared to Fe XXV He, and vice versa for S XV He and S XVI Ly. Thus the temperatures of the GCXE and the GRXE are different such that the temperature of LP in the GCXE is lower than the GRXE and HP at the GCXE is higher than the GRXE.
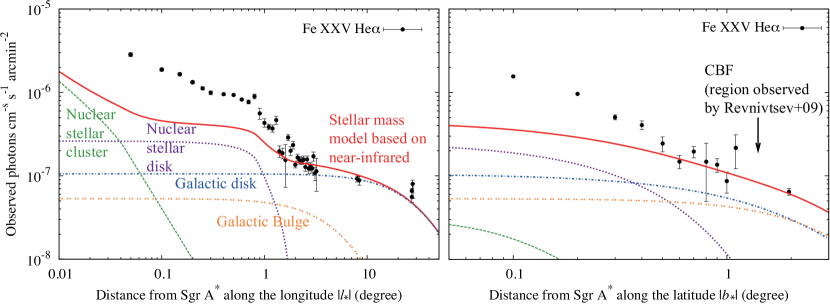
Figure 3 shows the comparisons between profiles of the Fe XXV He line, which is a typical component of the HP, and the stellar mass distribution based on near-infrared observations (Uchiyama et al., 2011). The emissivity of Fe XXV He per stellar mass in the GCXE is about two times larger than that in the GRXE. Heard & Warwick (2013) also found similar excesses with XMM-Newton. The authors mainly used the COBE results (Launhardt et al., 2002) so that the stellar mass profile has a large uncertainty (Heard & Warwick, 2013). Nishiyama et al. (2013), on the other hand, used high-quality SIRIUS/IRSF data for the near-infrared observation and confirmed the Fe XXV He line excess at the GCXE above the prediction from the stellar number distribution in the GRXE.
These results strongly suggest that the origin of the GCXE is different from that of the GRXE, whose origin is likely to be superposition of faint X-ray stars. In fact, unlike in the case of the GRXE, only 10–40% of the GCXE could be resolved into point sources even with long-exposure Chandra observations (–900 ks; Muno et al. 2003; Revnivtsev et al. 2007). If major fraction of the GCXE is point sources origin for the GCXE, more serious problem of the iron line EWs than that in the GRXE appears, because the enhancement of the iron EWs above the known point sources is much larger in the GCXE than in the GRXE. Thus we argue that truly diffuse plasma is a major contributor to the GCXE. The plasma may be related to past high energy activities (flare of Sgr A∗) in the GC (see the following sections), responsible for the X-ray echo (section 1.2) and jet-like structures (section 1.3). The putative large flares from Sgr A∗ might produce hot plasma, as is found around the micro-quasar SS433 (Kotani et al., 1994).
Another possibility is superposition of supernova remnants (SNRs). In fact, Suzaku has found many new SNR candidates in the GC region. Some of these SNRs have high-temperature plasmas which are not found in the other regions of the Galaxy (e.g. G0.610.01; Koyama et al. 2007a). In any case, the GCXE should contain key information about the extreme conditions in the GC region. The very high-resolution and wide-band spectra of the GCXE by SXS and HXI will be a clue to reveal the origin of these extremes.
1.2 X-ray Echo: K-shell Lines from Neutral Atoms
The other K-shell lines notable in the GCXE and GRXE are those of neutral atoms, in particular the 6.4 keV line from neutral iron (figure 4). The spectra also exhibit a strong Fe K-shell absorption edge. These spectral features support the X-ray Reflection Nebula (XRN) scenario (e.g. Koyama et al. 1996) in which X-rays are due to fluorescence and Compton scattering by the cold gas of the giant molecular clouds (MCs) in the central molecular zone (CMZ). Since the fluxes of the XRNe require a high X-ray luminosity for an irradiating source, which is brighter than any of the brightest Galactic X-ray sources, the potential candidate of the illuminating X-ray source should be the SMBH, Sgr A∗.
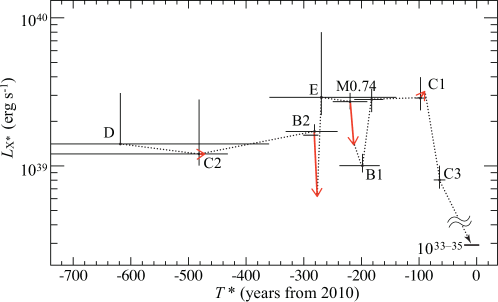
The observed spectrum of the GCXE is a mixture of the GC plasma and XRNe. Since X-rays of the GC plasma located behind the XRNe are largely absorbed, while those coming from the plasma in front the XRNe are not, the combined spectra have positional information of XRNe in the GC plasma. Ryu et al. (2009, 2013) analyzed the GCXE spectra as the sum of emission coming from the GC plasma in front and behind the XRNe, and additional emission of XRN itself. The results give line-of-sight positions of the XRNe in the GC plasma. Combining with the projected position (2-dimension), we construct the three-dimensional distribution of the XRNe. Then using the flux of XRNe, we can obtain the fluxes of Sgr A∗ at different epochs (figure 5). The X-ray luminosity of Sgr A∗ was about times higher than it is now. Then the flux dropped down to the current level about 100 years ago.
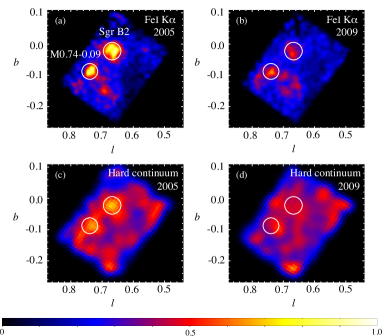
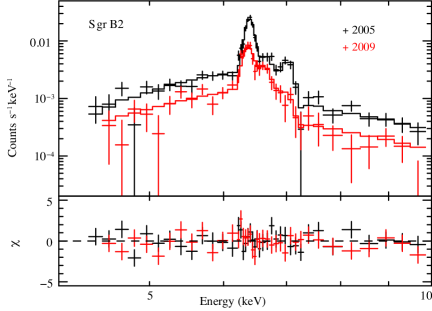
Some of the XRNe exhibit time variability on a timescale of few years (figure 6), (e.g. Koyama et al. 2008; Inui et al. 2009; Terrier et al. 2010; Ponti et al. 2010). Thus the high flux level between 100–700 years ago cannot be a single flat-top flare, but would be due to multiple short-time flares of the peak flux about (1– erg s-1. Ponti et al. (2010) argued that apparent superluminal motion of a light front illuminating a molecular nebula might be due to a source outside the MC (such as Sgr A∗ or a bright and long outburst of an X-ray binary). Monte Carlo simulations by Odaka et al. (2011) presented the detailed morphologies and spectra of the reflected X-ray emission for several realistic models of Sgr B2.
Other than in the giant molecular clouds, the weaker 6.4 keV emission is prevailing all over the GC region. The origin has still been an open issue. Chernyshov et al. (2012) suggests that the extended 6.4 keV emission can be explained by ambient molecular gas reflecting the past X-rays from Sgr A∗ like the XRNe. An alternative explanation is due to fluorescence and bremsstrahlung or inverse bremsstrahlung emission of low energy electrons or ions (e.g. Yusef-Zadeh et al. 2002; Dogiel et al. 2009). We do not have crucial information, such as line broadening and equivalent width of the 6.4 keV line, to constrain the origin, which will be obtained by ASTRO-H.
1.3 Other Relics of Big Flares of Sgr A∗
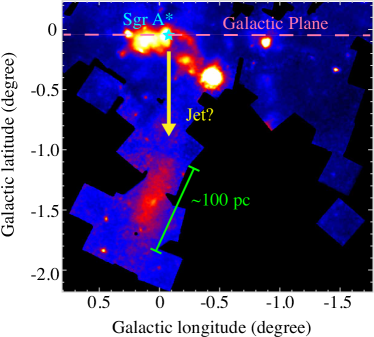
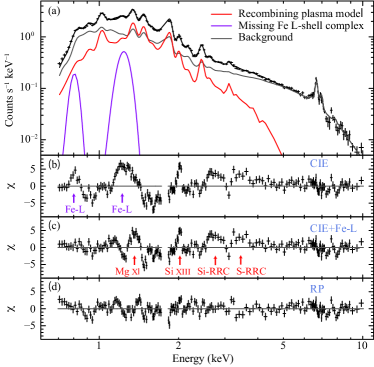
Suzaku recently discovered a thermal emission of about 0.5 keV at around (, )= (0∘, .5) (see figure 7 left; Nakashima et al. 2013). Remarkable features of this plasma is that it has a jet-like structure ejected from Sgr A∗ (here, the Galactic bulge jet). Also the X-ray spectra cannot fit with a collisional ionization equilibrium (CIE) plasma model, leaving clear excesses at the Si XV Ly line and the radiative recombination continuum (RRC) structure of Si and S at around 2–4 keV. The spectra are nicely fitted with a recombining plasma (RP) model as is shown in figure 7 (right). One plausible scenario is that the almost fully ionized (at least, for Si and S) plasma was made by a jet-like activity (flare) of Sgr A∗ years ago, and is now in a recombining phase.
The Fermi satellite discovered the large scale GeV gamma-ray emissions called “the Fermi bubble”. The Fermi bubbles are extending about (or kpc) above and below the GC (Dobler et al., 2010; Su et al., 2010), suggesting that a starburst or nuclear outburst happened near/within the GC years ago. This scenario is consistent with the origin of the North Polar Spur (NPS) proposed by Sofue (2000). The Fermi bubble is spatially correlated with the “haze” observed with WMAP, and the edge follows along NPS in the ROSAT X-ray maps. The Suzaku X-ray spectra show keV plasma with large , consistent with a scenario of shock-heated Galactic halo during the bubble expansion (Kataoka et al., 2013).
In addition to the recent flares (100–700 years ago), Sgr A∗ likely experienced an energetic flare in the far past of years ago, and even more energetic flares years ago. We thus propose that energetic flares of Sgr A∗ may not be a rare event in the past. The high and low temperature plasmas of keV and keV, as well as a lower temperature plasma of – keV in the Fermi bubble and the Galactic south jet (Nakashima et al., 2013) may be produced in a single (or multiple) flare events in GC, tracing the history of “shock evolution” from the GC to the outermost regions, the Fermi bubble.
A Chandra 1 Ms observation of Sgr A∗ revealed many small flares ( erg s-1) at a frequency of once per day (Neilsen et al., 2013). From the past activity history, we suggest that big flares with erg s-1 has occurred once per thousand years, and possibly erg s-1 flares once per million years. A radio observation has detected that a gas cloud with a few Earth masses is falling into Sgr A∗, and hence we may have a chance to observe a big flare in the near future (Gillessen et al., 2013). Since Sgr A∗ is the nearest SMBH, ASTRO-H should not miss this one-in-thousand year’s chance.
1.4 Serendipitous Discovery; Sterile Neutrino
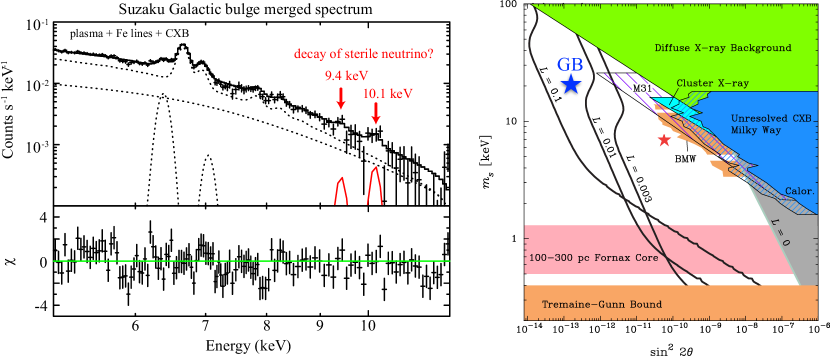
The Galactic center region is revealed to be a “treasure box” of high energy astronomy. In fact, we have made many serendipitous discoveries in addition to the results given in the previous subsections. We show one example, a hint of the sterile neutrino line. In the Suzaku GCXE spectrum, possible sterile neutrino signal is found at 8.7 keV (Prokhorov & Silk, 2010; Chan & Chu, 2011). However the GCXE is very strong X-ray background, and hence possible artificial structure due to the strong X-rays may not be excluded. The Galactic Bulge (GB) region has a lower background, and we find more faint line-like features at 9.4 keV and 10.1 keV with the Suzaku GB observations (figure 8). Neither atomic line nor instrumental structure exists at these energies (the closest line is Au-L at 9.7 keV). Although, at this moment, the significance level of the line emission is only 2.5, these residuals should not be ignored, because it can be a hint of a new important discovery, may or may not be a decay line of sterile neutrinos. In fact many outstanding discoveries in the GC, particularly the 6.4 keV echoes (and hence past Sgr A∗ flares), are established by an initial faint signature in the ASCA and Chandra observations (Koyama et al., 1996; Murakami et al., 2001). We note that, similarly, there is a new suggestion of a weak line at keV in the X-ray spectra of clusters of galaxies with deep exposures observations of XMM-Newton satellite (Bulbul et al. , 2014).
2 Prospect of ASTRO-H
The general objectives in the Galactic center science have been overviewed in section 1. The immediate objectives of ASTRO-H is to give more secure constraint on the origin of the K-shell lines from highly ionized and neutral atoms with the best quality spectra. The high resolution spectra will provide unprecedented information on plasma diagnostics, and also a good tool for understanding the dynamics of the Galactic cool gas (XRNe) and Galactic hot plasma (mainly GCXE). In the following subsections, we will separately discuss for the regions of Radio Arc (2.1), Sgr A West (2.2), Sgr A East (2.3), Sgr A∗ (2.4) and Sgr B/C/D/E (2.5).
2.1 Radio Arc
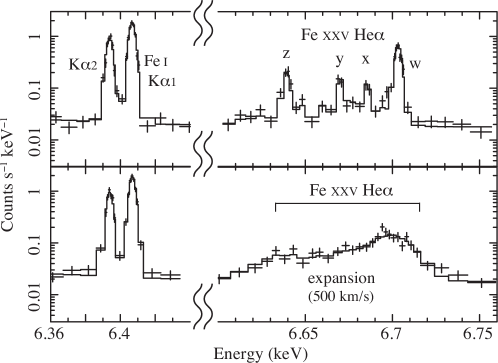
This is the brightest region of the GC plasma and the XRNe, and hence this region would be the best position to study the nature of both the GC hot plasmas and cool XRNe. As is shown in the simulated SXS spectrum given in figure 9, these two major components are clearly separated. The 6.4 keV lines come from cold molecular clouds (XRNe), hence have no thermal broadening. If the 6.7 keV lines are of diffuse origin in a free expanding plasma, the velocity is km s-1. However, Suzaku measured the line broadening (FWHM) of 3741 eV (F XXV He), 2935 eV (Fe I K) and 023 eV (Fe XXVI Ly) (Koyama et al., 2007c). The line width of Fe XXV He is biased by 25 eV (1 ) due to the mixture of resonance , inter-combination and forbidden lines within the energy band of 60 eV. Thus, we can safely assume that the intrinsic line broadening is 10 eV or 500 km s-1 (1 ) for the expansion velocity. This smaller velocity than that of the free expansion would be due to some confinement mechanisms of the hot plasma (e.g. magnetic field). If we determine the expansion velocity, then we can constrain the plasma confining mechanisms. We show the simulated SXS spectra with 100 ks exposures in figure 9 with the expansion velocity 0 km s-1 (Upper) and 500 km s-1 (Lower). We constrain the expansion velocity of the 6.7 keV line to be km s-1 (hereafter, errors are at 90% confidence levels).
If the 6.7 keV lines are of point source origin, although less likely as we discuss in section 1, the width of the 6.7 keV line should be narrow, similar to the 6.4 keV line. Thus by the width measurement of the 6.7 keV line, we can constrain the origin.
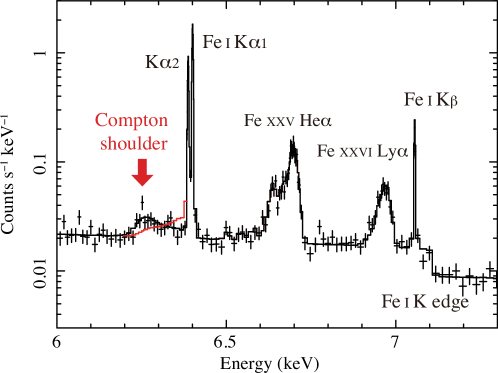
Since this region is the bright in the 6.4 keV line, we can easily measure the Compton shoulder of the 6.4 keV line with a reasonable exposure time. The lowest energy of the Compton shoulder gives the scattered angle (); is the angle between two lines of Sgr A∗–Radio Arc and our line-of-sight. Thus it provides the line-of-sight position of the XRNe. The flux of the Compton shoulder is proportional to the hydrogen column density of the scattered gas. We can also detect Fe K-edge absorption, which immediately tells us the of these clouds (Nobukawa et al., 2011). The equivalent width (EW) of the 6.4 keV line depends on , because Compton scattering flux (continuum band) is proportional to . Thus if we can determine the Fe abundance, the EW can also be an indicator of the scattering angle . We simulate the Compton shoulder profile for the backside reflection (scattering angle ) and normal reflection (). With a 200 ks exposure, we can determine with an error of , corresponding to the time-bin of 50 year in the look-back light-curve of Sgr A∗. This error is a similar value of Ryu et al. (2013), and hence the light curve can be smoothly combined. Together with the scattering angle , and the 6.4 keV line flux, we can accurately derive the period and luminosity of the past activity of Sgr A∗.
2.2 West of Sgr A∗
This is a mirror position of Radio Arc with respect to Sgr A∗. Unlike the Radio Arc region, this region is weak in the 6.4 keV line, hence rather pure GC hot plasma spectra will be obtained. The He line complex and Ly would be essentially the same as the Radio Arc region (see fig 9). The major objective is to resolve the fine structure of the He line complex. The line ratios of resonance/forbidden and inter combination lines give good plasma diagnostics. We note that pointing positions discussed in sections 2.1 and 2.2 are very close to those of the Suzaku pointing described in Koyama et al. (2007c).
2.3 Sgr A East
This is a young mix-morphology (MM) SNR, whose plasma temperature is the highest ( keV) among the Galactic SNRs. Within the central 5 pc () from Sgr A∗, Sgr A East is a unique object surely identified as an SNR. It may provide a rare probe to search the central 5 pc region. The Suzaku spectrum shows clear emission of Fe XXV K-shell line and a hint of a Cr line (Koyama et al., 2007b). Unlike many young-intermediate aged SNRs, the spectrum is not in IP, but rather in CIE (Koyama et al., 2007b). However we cannot exclude the more exotic case of RP, because many of MM SNRs that were previously known as a CIE plasma are now found to be RP (e.g. Yamaguchi et al. 2009; Ozawa et al. 2009; Ohnishi et al. 2011; Uchida et al. 2012; Sawada et al. 2012; Yamauchi et al. 2013; Ohnishi et al. 2014; Yamauchi et al. 2014).
The shell size is 8pc2 with the density of cm-3 (Koyama et al., 2007b). The expansion velocity is constrained by the Suzaku observation; The line width of Fe XXV He and Fe XXVI Ly are 4147 eV and 035 eV, respectively. The line width of Fe XXV He is biased by 25 eV (1) (see section 2.1). Thus the intrinsic line broadenings is 10 eV or 500 km s-1 of the expansion velocity. Then the dynamical age and ionization parameter are 6000 years and cm-3 s, respectively. Thus if normal SNR, the spectrum should be IP with the Fe XXV He line energy of 6.6 keV. However Suzaku gives the energy to be 6.7 keV (Koyama et al., 2007b), the same as the RP of W49B.
We can obtain SXS spectra up to 10 keV, and check whether a radiative recombination continuum (RRC) structure of Fe at about 9 keV is present or not. Another critical test to distinguish between CIE (or IP) and RP would be done with the help of Fe XXV He fine structure lines. In CIE (IP), the line flux of is larger than , while in RP is smaller than (see figure 11 right).
Sgr A East is in the unique circum-Sgr A* medium: dense star populations, strong magnetic field, high-energy particle field (seen by the GeV/TeV -rays), strong shearing by the Galactic rotation (see figure 13 Left) and so on. These environments may make the SNR to be unusual, which will be revealed by RP, hard X-ray tail (HXI) or else. Figure 11 right shows the simulated RP spectrum in cm-3 s on the faked CIE data (100 ks exposure). In RP, we separate and line with excess over the CIE value with 20 level. Together with the discovery of the RRC edge at 8.8 keV, we obtain new and detailed structures of the Sgr A East plasma. Then we investigate a unique evolutional history of Sgr A East in the GC environment.
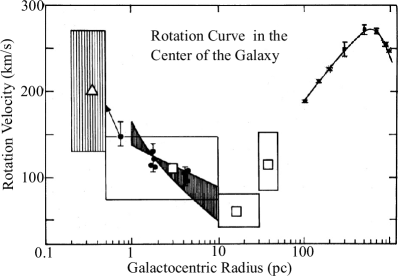
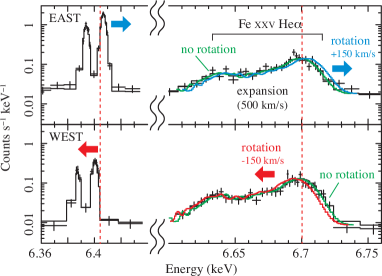
The age is rather old, and hence the elongated morphology along the Galactic plane can be due to the shear by the large differential rotation near at the center (see section 2.6 and figure 13). Then the Doppler shift of the Fe-K lines will follow the stellar rotation in figure 13 ( km s-1), since the hot plasma emitting Fe-K lines is relaxed with the Galactic rotation. On the other hand, if the SNR is young, the plasma could have not enough time for the relaxation and the motion of the plasma may not follow the Galactic rotation curve. The spectrum of Sgr A East may be contaminated by the GCXE, but with the help of the Sgr A West observation discussed in section 2.2, we can determine the contribution of the GCXE very accurately.
Hard-X/gamma-rays from a compact region around Sgr A∗ were discovered with INTEGRAL in the energy range between 20 and 100 keV (Bélanger et al., 2004), and also with HESS between 0.16 and 10 TeV (Aharonian et al., 2004). These sources may be slightly offset from Sgr A∗, and likely to be associated to Sgr A East. However, given the 13 resolution of INTEGRAL/IBIS, whether these emissions are associated to Sgr A East or not was unclear. Also exact nature of highly energetic emission from the Sgr A complex is still unknown. The wide-band spectroscopy of ASTRO-H between 0.4 and 80 keV with much better angular resolution of will reveal the exact nature of the hard X-ray emission (figure 11) for the first time. Using the information of the Fe XXV He fine structure, RRC, possible shearing effects and hard X-ray tail structure, we may constrain the physical parameters on this unique SNR.
2.4 Sgr A∗
This is a super massive black hole (SMBH) in our Galaxy. Sgr A∗ is in the same SXS field of the Sgr A East SNR, the position is only about off-set from the center of the SNR. Unlike many SMBHs, the X-ray flux is extremely lower than the Eddington limit at present. However, as we argued in section 1.3, energetic flares of Sgr A∗ may not be a very rare event, possibly one per 1000 years.
In the ASTRO-H era, we may be lucky to witness such an event (Gillessen et al., 2013). We should not miss the one-in-thousand year’s chance. We can get the wide band spectrum (SXS, SXI, HXI and SGD) of the flare state of Sgr A∗, for the first time. In the previous studies, we were only able to constrain the Sgr A∗ spectrum in the past flare to be a simple power-law with , due to the limited information of the XRN spectra. The wide band spectra of ASTRO-H will give new information: a Fe K line from the SMBH, Sgr A∗ itself and a cutoff shape at the hard X-ray band.
By comparing with the past flare investigated in sections 1.2–1.3, we can study whether the past flare was attributed to the Radiation Inefficient Accretion Flow (RIAF), or to a standard accretion flow and whether phase transition of accretion occurred between the past flares and low (quiescent or weak flare) state at present.
The observed 511 keV line emission most recently confirmed by INTEGRAL (e.g., Jean et al. 2006; Weidenspointer et al. 2008) toward the GC can be explained naturally in a standard framework of RIAF, if the typical accretion rate was about 1000 times higher than the current rate in the past 10 Myrs (Totani et al., 2006). The outflow energy by such an accretion rate is expected to be erg (or erg s-1). Thus identification of the origin of 511 keV line emission using the SGD, together with unresolved connection to GeV/TeV gamma-rays recently reported by the Fermi-LAT and HESS (e.g., Chernyakova et al. 2011) are key science left in the ASTRO-H era.
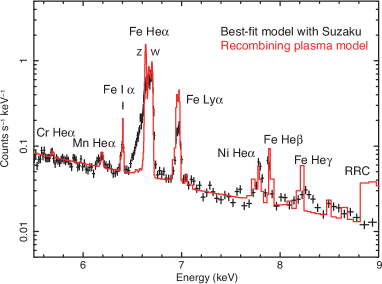
If we concentrate on the Fe XXV He line in the GCXE from the close vicinity of Sgr A∗, we may discover a relic of the past activity of Sgr A∗ of erg s-1 at years ago (Nakashima et al., 2013). The putative flare would photo-ionize (e.g. Fe XXV Fe XXVI, in the GCXE) to make recombining plasma (RP). Using the density of 0.1 cm-3 (Uchiyama et al., 2013), the recombination parameter is cm-3 s, hence the plasma is likely to be still in RP phase.
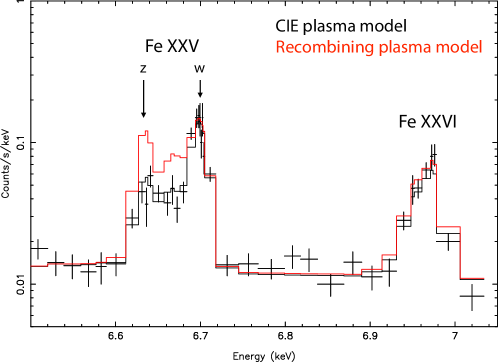
Using the flux ratio of resonance and forbidden lines in the Fe XXV He, we investigate whether GCXE plasma near Sgr A∗ is RP or not. This study was impossible with the XIS resolution. A 100 ks simulation of SXS gives to be in RP of cm-3 s, while collisional ionization equilibrium (CIE) is 0.43 (figure 12). Thus RP will be established by 5 level. This will provide firm evidence for the past ( years ago) activity of Sgr A∗. Furthermore from the value, we can trace the time history of the past flare.
2.5 Sgr B, C, D, and E
Sgr B and C are typical XRNe (Koyama et al., 2007a; Nakajima et al., 2009). Sgr D and E are also likely to be XRNe (Nobukawa et al.2014, private communication). Unlike Radio Arc, contaminations of the GCXE in these regions are small, and hence these sources are the best targets to investigate photo-ionized astrophysical plasma and XRNe scenario. Since short-term time-variability was observed with the Suzaku satellite, we may add further data for the light curve of Sgr A∗. However we need long time exposure because the 6.4 keV line fluxes are far smaller than that of Radio Arc. In a long time exposure, we can see detailed line physics like Compton shoulder, Doppler broadening etc. as in the case of Radio Arc. The measurements of the center energy of the 6.4 keV lines may add the Galactic rotation curve data up to pc (see section 2.6).
2.6 GC Dynamics
With the SXS observations of the selected regions given in section 2.1–2.5, we can obtain a systematic trend of the center energy of the Fe I K line as a function of the Galactic coordinate. The accuracy of center energy is 1 eV, corresponding to the velocity shift of km s-1. Thus we can measure a rotation curve of the XRNe with reasonable accuracy.
The comparison of the XRNe rotation curve with those of molecular emission line observations in radio may help to judge physical correlations between respective XRNe and MCs (figure 13). There are not only XRNe but also no X-ray emitting molecular clouds. Based on the accurate XRNe map including such dark clouds, we may establish the past light curve of Sgr A∗; which MCs in which distance are irradiated by past flare (XRNe).
If the majority of the GCXE is diffuse plasma origin, the rotation curve of the GC hot plasma may not be necessarily the same as that of the radio band, because the hot plasma is not bounded by the gravitational potential of the GC region. The rotation curve for the GCXE hot plasma would be obtained by the accurate SXS measurement of the line centers of Fe XXVI Ly and fine structure lines of Fe XXV He. The other dynamics such as expansion velocity as a function of the Galactic position will be obtained by the width measurement of these lines. Then we examine the key question; Is it out-flowing, in-flowing or rotating differently from the CMZ ? This may be the first information to provide the dynamics of the GC hot plasma.
2.7 Search for Dark Matter
Sterile neutrinos are one of the candidates for dark matter, with their mass lying in the range of 1–30 keV. With pair decay, a photon at half the energy of its mass will be observed. The Galactic center region may have high dark matter surface density and hence provides an attractive environment to search for radiative decay signals. This science will be also proposed from the galaxy clusters (ASTRO-H Galaxy Cluster Task Forces , 2014). As noted in section 1.4, with Suzaku, possible sterile neutrino signal is found at 8.7 keV (Prokhorov & Silk, 2010; Chan & Chu, 2011) in the Galactic center. The scale height of the GCXE is – (Uchiyama et al., 2013) which is far smaller than that of the dark matter distribution. Thus more suitable area for the sterile neutrino search would be the Galactic Bulge (GB) region. In fact, faint signals at 9.4 and 10.1 keV are also found in the GB spectra (figure 8). ASTRO-H will make many pointing observations of SXS near at the GC region (section 2.1–2.5). As by-products, we may obtain high statistics data of SXI and HXI with the larger collecting area and wider energy range (up to keV) than those of Suzaku. Adding all these spectra in the GC/GB regions, we may obtain unprecedented spectra, from which possible candidate for the sterile neutrino signals may be found. The SXS will of course produce an unprecedented high resolution spectrum. Our objective is not limited to only the sterile neutrino signal, but also other unidentified line-like features, a hint of new science.
References
- Aharonian et al. (2004) Aharonian, F., Akhperjanian, A. G., Aye, K.-M., et al. 2004, A&A, 425, L13
- ASTRO-H Galaxy Cluster Task Forces (2014) ASTRO-H Galaxy Cluster Task Forces, ASTRO-H white papers, 2014
- Bélanger et al. (2004) Bélanger, G., Goldwurm, A., Goldoni, P., et al. 2004, ApJL, 601, L163
- Bulbul et al. (2014) Bulbul, E., Markevitch, M., Foster, A., Smith, R. K., Loewenstein, M., & Randall, S. W. 2014, ApJ, 789, 13
- Chan & Chu (2011) Chan, M. H., & Chu, M.-C. 2011, ApJL, 727, L47
- Chernyakova et al. (2011) Chernyakova, M., Malyshev, D., Aharonian, F. A., Crocker, R. M., & Jones, D. I., 2011, ApJ, 726, 60
- Chernyshov et al. (2012) Chernyshov, D., Dogiel, V., Nobukawa, M., Tsuru, T., Koyama, K., Uchiyama, H., & Matsumoto, H. 2012, PASJ, 64, No.14
- Cooke et al. (1969) Cooke, B. A., Griffiths, R. E., & Pounds, K. A. 1969, Nature, 224, 134
- Crawford et al. (1985) Crawford, M. K., Genzel, R., Harris, A. I., et al. 1985, Nature, 315, 467
- Dobler et al. (2010) Dobler, G., Finkbeiner, D. P., Cholis, I., Slatyer, T., & Weiner, N. 2010, ApJ,717, 825
- Dogiel et al. (2009) Dogiel, V., Cheng, K.-S., Chernyshov, D., et al. 2009, PASJ, 61, 901
- Gillessen et al. (2013) Gillessen, S., Genzel, R., Fritz, T. K., et al. 2013, ApJ, 763, 78
- Heard & Warwick (2013) Heard, V., & Warwick, R. S. 2013, MNRAS, 428, 3462
- Hong (2012) Hong, J. 2012, MNRAS, 427, 1633
- Inui et al. (2009) Inui, T., Koyama, K., Matsumoto, H., & Tsuru, T. G. 2009, PASJ, 61, S241
- Jean et al. (2006) Jean, P., Knodlseder, J., Gillard, W., et al., 2006, A&A, 445, 579
- Kataoka et al. (2013) Kataoka, J., et al., 2013, ApJ, 779, 57
- Kotani et al. (1994) Kotani, T., Kawai, N., Aoki, T., et al. 1994, PASJ, 46, L147
- Koyama et al. (1986a) Koyama, K., Makishima,K., Tanaka,Y. & Tsunemi, H. 1986a, PASJ, 38, 121
- Koyama et al. (1986b) Koyama, K., Ikeuchi, S., & Tomisaka, K. 1986b, PASJ, 38, 503
- Koyama et al. (1989) Koyama, K., Awaki, H., Kunieda, H., Takano, S., Tawara, Y., Yamauchi, S., Nagase, F., & Hatsukade, I 1989, Nature, 339, 603
- Koyama et al. (1996) Koyama, K., Maeda, Y., Sonobe, T., et al. 1996, PASJ, 48, 249
- Koyama et al. (2007a) Koyama, K., Inui, T., Hyodo, Y., et al. 2007a, PASJ 59, S221
- Koyama et al. (2007b) Koyama, K., Uchiyama, H., Hyodo, Y., et al. 2007b, PASJ, 59, S237
- Koyama et al. (2007c) Koyama, K., Hyodo, Y., Inui, T., et al., 2007c, PASJ, 59, S245
- Koyama et al. (2008) Koyama, K., Inui, Matsumoto, H., & Tsuru, T., 2008, PASJ, 60, 201
- Launhardt et al. (2002) Launhardt, R., Zylka, R., & Mezger, P. G. 2002, A&A, 384, 112
- Lugten et al. (1986) Lugten, J. B., Genzel, R., Crawford, M. K., & Townes, C. H. 1986, ApJ, 306, 691
- Morihana et al. (2013) Morihana, K., Tsujimoto, M., Yoshida, T., & Ebisawa, K. 2013, ApJ, 766, 14
- Muno et al. (2003) Muno, M. P., Baganoff, F. K., Bautz, M. W., et al. 2003, ApJ, 599, 465
- Murakami et al. (2001) Murakami, H., Koyama, K., & Maeda, Y. 2001, ApJ, 558, 687
- Nakajima et al. (2009) Nakajima, H., Tsuru, T. G., Nobukawa, M., et al. 2009, PASJ, 61, S233
- Nakashima et al. (2013) Nakashima, S., Nobukawa, M., Uchida, H., et al. 2013, ApJ, 773, 20
- Neilsen et al. (2013) Neilsen, J., Nowak, M. A., Gammie, C., et al. 2013, ApJ, 774, article id 42
- Nishiyama et al. (2013) Nishiyama, S., Yasui, K., Nagata, T., et al. 2013, ApJL, 769, L28
- Nobukawa et al. (2011) Nobukawa, M., Ryu, S. G., Tsuru, T. G., & Koyama, K. 2011, ApJL, 739, L52
- Odaka et al. (2011) Odaka, H., Aharonian, F., Watanabe, S., et al. 2011, ApJ, 740, 103.
- Ohnishi et al. (2011) Ohnishi, T., Koyama, K., Tsuru, T., Masai, K., Yamaguchi, H., & Ozawa, M. 2011, PASJ, 63, 527
- Ohnishi et al. (2014) Ohnishi, T., Uchida, H. Tsuru, T., Koyama, K., Masai, K., & Sawada, M. 2014, ApJ, 784, article id 74
- Ozawa et al. (2009) Ozawa, M., Koyama, K., Yamaguchi, H., Masai, K., & Tamagawa, T. 2009, ApJL, 706, L71
- Ponti et al. (2010) Ponti, G., Terrier, R., Goldwurm, A., Belanger, G., & Trap, G. 2010, ApJ, 714, 732
- Prokhorov & Silk (2010) Prokhorov, D., & Silk, J. 2010, ApJL, 725, L131
- Revnivtsev et al. (2007) Revnivtsev, M., Vikhlinin, A., & Sazonov, S. 2007, A&A, 473, 857
- Revnivtsev et al. (2009) Revnivtsev, M., Sazonov, S., Churazov, E., et al. 2009, Nature, 458, 1142
- Ryu et al. (2009) Ryu, S. G., Koyama, K., Nobukawa, M., Fukuoka, R., & Tsuru, T. G. 2009, PASJ, 61, 751
- Ryu et al. (2013) Ryu, S. G., Nobukawa, M., Nakashima, S., et al. 2013, PASJ, 65, 33
- Sawada et al. (2012) Sawada, M. & Koyama, K. 2012, PASJ, 64, 81
- Sazonov et al. (2006) Sazonov, S., Revnivtsev, M., Gilfanov, M., Churazov, E., & Sunyaev, R. 2006, A&A, 450, 117
- Sofue (2000) Sofue, Y. 2000, ApJ, 540, 224
- Su et al. (2010) Su, M., Slatyer, T. R., & Finkbeiner, D. P. 2010, ApJ, 724, 1044
- Tanuma et al. (1999) Tanuma, S., Yokoyama, T., Kudoh, T., et al. 1999, PASJ, 51, 161
- Terrier et al. (2010) Terrier, R., Ponti, G., Bélanger, G., et al. 2010, ApJ, 719, 143
- Totani et al. (2006) Totani, T. 2006, PASJ, 58, 965
- Uchida et al. (2012) Uchida, H, Koyama, K., Yamaguchi, H. et al. 2012, PASJ, 64, 141
- Uchiyama et al. (2011) Uchiyama, H., Nobukawa, M., Tsuru, T., Koyama, K., & Matsumoto, H. 2011, PASJ, 63, 903
- Uchiyama et al. (2013) Uchiyama, H., Nobukawa, M., Tsuru, T. G., & Koyama, K. 2013, PASJ, 65, 19
- Warwick et al. (1985) Warwick, R. S., Turner, M. J. L., Watson, M. G., & Willingale, R. 1985, Nature, 317, 218
- Warwick et al. (2014) Warwick, R. S., Byckling, K., & Pérez-Ramírez, D. 2014, MNRAS, 438, 2967
- Weidenspointer et al. (2008) Weidenspointner, G., Skinner,. G.K., Jean. P. et al., 2008, NewAR, 52, 454
- Worrall & Marshall (1983) Worrall, D. M., & Marshall, F. E. 1983, ApJ, 267, 691
- Yamaguchi et al. (2009) Yamaguchi, H., Ozawa, M., Koyama, K., Masai, K., Hiraga, J. S., Ozaki, M., & Yonetoku, D. 2009, ApJL, 705, L6
- Yamauchi et al. (2013) Yamauchi, S., Nobukawa, M., Koyama, K., & Yonemori, M. 2013, PASJ, 65, 6
- Yamauchi et al. (2014) Yamauchi, S., Minami, S., Ota, N., & Koyama, K. 2014, PASJ, 66, 2
- Yuasa et al. (2012) Yuasa, T., Makishima, K., & Nakazawa, K. 2012, ApJ, 753, 129
- Yusef-Zadeh et al. (2002) Yusef-Zadeh, F., Law, C., & Wardle, M. 2002, ApJL, 568, L121