ASTRO-H Space X-ray Observatory
White Paper
High Resolution Spectroscopy of Interstellar and
Circumgalactic Gas in the Milky Way and Other Galaxies
F. Paerels (Columbia University),
N. Yamasaki (JAXA),
N. Anabuki (Osaka University),
E. Costantini (SRON),
C. de Vries (SRON),
R. Fujimoto (Kanazawa University),
A. Hornschemeier (NASA/GSFC),
R. Iizuka (JAXA),
C. Kilbourne (NASA/GSFC),
S. Konami (Tokyo Metropolitan University),
S. LaMassa (Yale University),
M. Loewenstein (NASA/GSFC & University of Maryland),
D. McCammon (University of Wisconsin),
K. Matsushita (Tokyo University of Science),
B. McNamara (University of Waterloo),
I. Mitsuishi (Nagoya University),
R. Nagino (Osaka University),
T. Nakagawa (JAXA),
S. Porter (NASA/GSFC),
K. Sakai (JAXA),
R. K. Smith (SAO),
Y. Takei (JAXA),
T. Tsuru (Kyoto University),
H. Uchiyama (Shizuoka University),
H. Yamaguchi (NASA/GSFC & University of Maryland),
and S. Yamauchi (Nara Women’s University)
on behalf of the ASTRO-H Science Working Group
Complete list of the ASTRO-H Science Working Group
Abstract
We describe the potential of high resolution imaging spectroscopy with the SXS on ASTRO-H to advance our understanding of the interstellar- and circumgalactic media of our own Galaxy, and other galaxies. Topics to be addressed range from absorption spectroscopy of dust in the Galactic interstellar medium, to observations to constrain the total mass-, metal-, and energy flow out of starburst galaxies.
1 Introduction
The microcalorimeter spectrometer on ASTRO-H (Soft X-ray Spectrometer; SXS) will be the first high-resolution imaging X-ray spectrometer in space. We will be able to perform sensitive emission- and absorption spectroscopy on the diffuse interstellar and circumgalactic media both in our own, and in external galaxies. We describe the potential for addressing a range of topics, from studying the physical chemistry of Galactic dust, to the ‘Missing Metals’ problem. We briefly introduce the main topics below.
There is a sizable body of high resolution absorption line spectroscopy of the Galactic interstellar medium (ISM) and halo/Intragroup medium, obtained with the diffraction grating spectrometers on Chandra and XMM-Newton along lines of sight towards bright point sources. These spectrometers cannot perform spectroscopy of extended sources. If we complement the grating spectroscopy with measurements of emission line intensities along the same, or close-by lines of sight with the ASTRO-H SXS, we can determine the average density and length scale along each sight line (e.g. Yao & Wang, 2007; Yoshino et al., 2009). The obvious improvement over data obtained with CCD spectrometers will be in the ability of the SXS to resolve the Fe L complex, and hence to obtain an unambiguous and improved measurement of the electron temperature(s) of the Circumgalactic gas, as well as the Fe/O abundance ratio.
The SXS will be the first astrophysical high-resolution spectrometer (virtually) without Si in the detectors. It also has by far the highest sensitivity of any spectrometer at Fe K. We will be able to turn both features to advantage to perform the first sensitive study of X-ray absorption by solid material (dust) in the ISM, at the Si and Fe K edges, using the XAFS technique.
Obviously, the SXS has the potential to provide us with emission line spectroscopy of diffuse gas (and unresolved point source populations) in external galaxies. Two target classes are discussed below, starburst galaxies and elliptical galaxies. We can address the physical state and chemical composition of the ISM, and determine outflow velocities from starbursts, and the implied metal mass flux into the intergalactic medium.
With the SXS, we will also have the exciting prospect of extending the study of the circumgalactic medium to other galaxies. Due to source confusion and a lack of sensitivity, absorption spectroscopy of point sources in other galaxies has not been possible with the diffraction grating spectrometers. With the SXS, this will be possible, using the brightest Ultra-Luminous X-ray sources observed in certain galaxies. In deep exposures, we will also be able to perform the complementary emission line spectroscopy on galactic halo’s with high surface brightness and large angular extent. We will also exploit the few coincidences between galaxies and bright background AGN for absorption spectroscopy.
2 Galactic Interstellar Dust Absorption
2.1 Background and Previous Studies
The interstellar matter bears the signature of the star formation and stellar evolution in our Galaxy. Dust is efficiently produced by late-type stars and supernova explosions. In turn, dust and gas provide the reservoir of matter for the formation of new stars and planets. Dust regulates the thermal balance in star formation regions at all red shifts. After decades of multi-wavelength (from radio to far-ultraviolet) studies, the broad characteristics of interstellar dust have been established (e.g. Draine, 2009). There are however important open issues, for instance the nature of the iron content of dust grains, as only a fraction of it is included in silicates (Whittet, 2003). Most of the astrophysical dust material appears to be in an amorphous phase, where the long-range crystalline structure has been broken up, either by the grain growth process, or by subsequent processing in the ISM; however, the degree of disorder is unknown. X-ray spectroscopy can address these issues directly.
It has become clear that advanced X-ray instruments are a powerful tool to characterize both the gas and dust phase of the ISM in our Galaxy. Dust both absorbs and scatters the X-ray radiation. The background light of bright X-ray emitters, as X-ray binaries are, allows us to study dust by both mechanisms. Absorption can be studied through high-signal-to-noise, high resolution absorption spectra. Here, the sensitivity to the short-range order or ‘micro-crystalline’ structure of the dust material arises from quantum interference of outgoing and scattered photoelectron wave functions, which gives rise to a unique ‘X-ray Absorption Fine Structure’ (XAFS) in the photoelectric absorption spectrum near absorption edges (e.g. de Vries & Costantini, 2009; Lee et al., 2009, and references therein). Scattered light, which results in a halo of diffuse emission around the source, is studied thanks to the unique feature of imaging coupled with spectral resolution of the SXS. X-ray binaries are mostly located within the Galactic plane, allowing to study the ISM in a variety of environments, with different dust and gas enrichment history. The information on the ISM therefore is embedded in every observation carried out on compact objects. The SXS instrument will access a spectral region up to now largely unexplored, in particular the Mg K, Si K and Fe K edge region, located between 1.3 and 7.1 keV. These are important to investigate the nature of the silicates in our Galaxy and in particular the iron inclusion in them, as in the X-ray band, unlike in other wavelength ranges, as many as two strong neutral iron features may be observed. The Fe K feature is an important metallicity indicator in the densest regions, like e.g. the Galactic Center, where absorption is such as to obliterate all other lower energy features.
The SXS will be able to access routinely the Si K edge, as this becomes a deep absorption feature for hydrogen column densities which are commonly measured towards X-ray binaries ( cm-2).
2.2 Prospects and Strategy
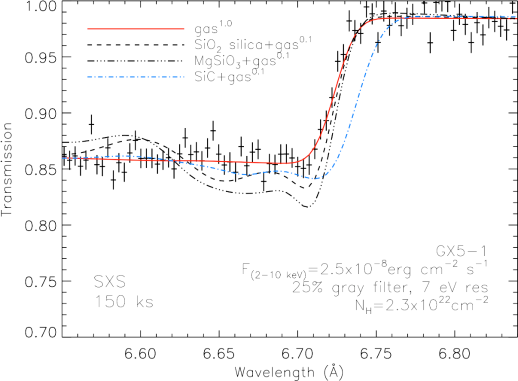
For the Si K edge, a number of persistently high-flux X-ray binaries can be observed. Indeed many of the brightest X-ray binaries lie behind a relatively high column density ( cm-2). The best targets for this kind of studies are Low Mass X-ray Binaries (LMXB), which display generally a featureless continuum. Therefore only absorption features (lines and edges) from dust and both neutral and possibly ionized gas are visible. In other classes of bright sources, like the High-Mass X-ray binaries or Supernova remnants is nearly impossible to study dust features from the ISM, because of the complex emission spectrum displayed by these sources. At the Si K edge, the resolution of SXS will be similar to the one of the Chandra HETG, but with higher effective area. Therefore we expect to resolve with high accuracy different possible chemical compositions of the dust (Figure 1). There is only a handful of sources which naturally lie in very dense environments ( cm-2), which would maximize the depth of the Fe K edge. In order to reach an acceptable signal to noise ratio, these sources must be in outburst. This is a crucial issue, as it will be the signal to noise level, rather than the resolution, that determines the feasibility of studying dust in the Fe K region. Several transients have been detected in the past behind a high column density medium. Table 1 lists five favorable binaries; the Fe K targets have to be observed during outburst or a high level flux. For this, a triggered observation will be needed.
2.3 Target and Feasibility
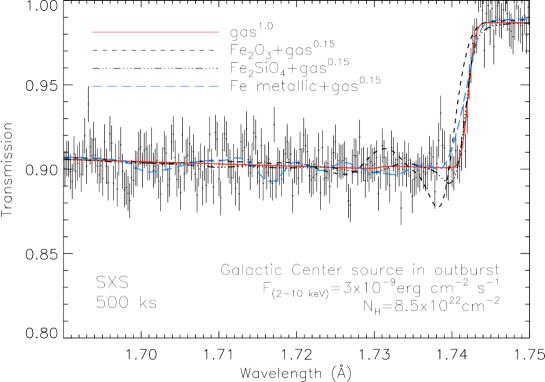
In Figure 1 an example of different edge shapes due to different dust compounds is shown for the Si K edge. In Figure 2 the Fe K edge is shown for a source with high- caught in a high flux state (e.g. in’t Zand et al., 2004). The dust detection here depends on the nature of the dust, as some compounds show little deviation from a ‘normal’ (i.e. atomic) photoelectric edge (dust absorption profiles from Lee et al. (2009)).
For the Si K simulations, we used a mixture of gas (10%) and two common dust compounds111Source of dust profiles: http://www.sron.nl/files/HEA/XRAY2010/talks/3/lee.pdf, SiO2 and MgSiO3, equally distributed in order to reach a proto-solar abundance for Si (Lodders & Palme, 2009). We estimated the exposure time imposing the requirement that the determination of the abundance of Si in gas form (i.e. a measure of depletion) be significant to 5. Detection of dust in the Fe K edge is difficult. Here we considered a mixture of gas (15%) plus one dominant dust component (Fe2SiO4). The total Fe abundance has been set to proto-solar. The exposure time has been calculated imposing the requirement that the determination of the abundance of Fe in gas form (i.e. a measure of depletion) to be significant at the 5 level.
| source | Flux 2–10 keV | edge | exposure | |
|---|---|---|---|---|
| cm -2 | erg cm-2 s-1 | ks | ||
| GX5–1 | 3 | 25 | SiK | 150 |
| GX340+0 | 5 | 9.5 | SiK | (300) |
| SAX1747.0-2853 | 8.5 | 4 | FeK | 300 |
| CirX-1 | 9 | 8 | FeK | (250) |
notes: exposure times calculated in order to have a 5 significance on the detection of absorption by Si or Fe in the gas phase. For
the Si-sources absorption by gas plus two dust components was assumed.
For the Fe-sources only gas and one dust component have been assumed. For Fe,
the actual dust detection strongly depends on the type of dust. These sources must be observed in a high-flux state to study iron.
The exposures for sources not proposed as PV targets are reported in brackets.
3 Hot Interstellar and Circumgalactic Gas
3.1 Background and Previous Studies
Studies of hot gas in the circum–Galactic environment, based on X-ray absorption- and emission line spectroscopy, have provided evidence for a reservoir of keV gas. As a typical value, the emission is as dim as a few to several photons cm-2 sec-1sr-1 in the strongest Oxygen K-shell lines. Combining absorption line columns and line emission measures allows one to estimate characteristic gas densities and path lengths. Interpretations of the existing data vary (see for instance Yao & Wang (2012)). Suzaku’s clean low-energy CCD response has allowed a study of emission line intensities in several directions (Yoshino et al., 2009). This has revealed revealed a constant contribution to the surface brightness of O line emission, observed in several directions (Yoshino et al., 2009). This component is present even in shadowing observation towards nearby molecular clouds, e.g. MBM20, at a distance of 150 pc. This indicates that some part of the soft X-ray background comes from our vicinity. Two major candidates are the so-called ”Local Hot Bubble”, which might be a local Supernova remnant with hot plasma, and Solar wind charge-exchange (SWCX) at the edge of heliosphere (Gupta et al., 2009). As Suzaku observed a temporal change of the O line surface brightness toward the Lockman Hole, the contribution from SWCX is not negligible (Yoshitake et al., 2013). This topic will be discussed in another ASTRO-H White Paper (17).
The higher resolution of the SXS in principle will allow more precise constraints to be placed on the properties of the diffuse gas. For instance, resolving the Fe L complex at 800 eV can produce an unambiguous measurement of the electron temperature. Combined with the O emission lines, we can measure the Fe/O ratio; there is evidence that this ratio varies across the sky. Also, the interpretation of the measured O VII absorption column densities hinges critically on the assumed ionization balance. At gas temperatures around keV, that correction varies strongly with temperature.
3.2 Prospects
We can pursue the measurement of the diffuse Galactic emission line spectrum with pointed observations, in addition to using archival data of near-blank fields (weak point source targets) and possibly accumulated slew data. The small field of view of the SXS requires deep observations to obtain significant emission line detections. Based on the Suzaku data gathered in Yoshino et al. (2009), we estimate that at least 200 ksec exposure on a single field is required. Figure 3 shows a simulated spectrum for 200 ksec exposure on a field near the North Ecliptic Pole, which will determine the O Ly line intensity with an accuracy of 30%. A single pointing to obtain an accuracy of 10% will require an exposure of order a Msec for SXS. This will be a challenging observation, since the uncertainty in the emission model is large, and this observation therefore appears less suitable for the PV phase schedule. Archival study in a later stage of the mission based on a compilation of blank sky data, on the other hand, may allow us to obtain unique information on the circumgalactic gas. The SWCX component may be identifiable through time variability correlated with changes in the Solar wind, or Coronal Mass Ejection Events, by tracking intensity variations in the O Ly line (which is relatively bright in recombining plasmas as opposed to collisional plasmas).

4 Starburst Galaxies and the Missing Metals
4.1 Background and Previous Studies
Galaxies and the Intergalactic Medium (IGM) are connected by flows of matter and energy. Both accretion onto galaxies and outflows from galaxies or their central black holes link galaxies to the IGM in what has been termed ”Cosmic Feedback”. To obtain a deeper physical understanding of both galaxy formation and evolution and the IGM requires that we better understand the physical processes that link them.
Mechanical feedback (stellar winds and SNe) is also the primary physical mechanism creating the hot phases of the interstellar and circumgalactic media (ISM and CGM) in star-forming galaxies (spiral, irregular and merging galaxies). The plasmas making up the hot phases of the ISM/CGM have temperatures in the range K and predominantly emit and absorb photons in the X-ray energy band from keV. Line emission (from highly-ionized ions of the astrophysically important elements O, Ne, Mg, Si, S, and Fe) dominates the total emissivity of plasmas with temperatures K, and at higher temperatures Ar, Ca and in particular Fe also produce strong lines. For a longer description of the outflow of metals and energy into the IGM, we refer the reader to the recent Astro2010 decadal white paper by David Strickland (paper 89, http://sites.nationalacademies.org/BPA/BPA_050603#galaxies).
The hot phase of the ISM dominates the energetics of the ISM and strongly influences its phase structure (Efstathiou et al., 2000). X-ray observations are a natural and powerful probe of the composition and thermodynamic state of hot phases of the ISM/CGM in and around galaxies, and thus are also a powerful tool for exploring the physics of feedback, as well as completing the ‘metal census’, and following the enrichment of the IGM.
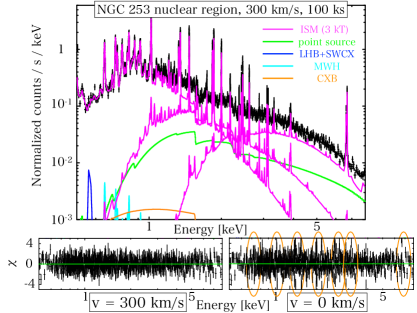
Recent results from XMM-Newton and Suzaku have revealed much about the ISM in starburst galaxies. Most recently, Mitsuishi et al. (2013) conducted a through study of the nearby starburst galaxy NGC 253, the ISM of which is well-modeled by a two-temperature plasma ( 0.2 keV and 0.6 keV) outside the nuclear region where the intense starburst activity occurs. On the other hand, Mitsuishi et al. (2011) shows the existence of hotter plasma ( 1 keV) possibly originating from the starburst activity in the nuclear region of NGC 253. Using detailed abundance measurements in three different regions from the central part of NGC 253 to the halo (10 kpc away from the center) within the galaxy they found all three regions were consistent with Type II supernova ejecta, indicating that the starburst activity in the central region provides metals toward the halo through a galactic-scale starburst-driven outflow. The outflow velocity was constrained to be 100 km s-1 from the X-ray data which may be compared with the 220 km s-1 escape velocity of NGC 253. Note that outflow velocities in the cooler entrained material (molecular cloud, cooler gas and dust) have been measured as well (50–400 km s-1 in CO, 100–300 km s-1 in Hα, and 300–2000 km s-1 in the far-infrared (dust outflow); Balatto et al. (2013); Westmoquette et al. (2011); Kaneda et al. (2009) respectively).
Similar results were obtained with Suzaku on M82, finding via detailed abundance measurements that starburst activity enriches the M82 outflow through SNcc metal ejection (Konami et al., 2011). Suzaku studies of farther-out regions in M82, including the M82 Cap located 11′ (11.6 kpc) away from the nucleus have demonstrated metals consistent with Type II supernovae even at these great distances (Tsuru et al., 2007).
While significant progress has been made in measuring abundances in hot gas, it should be noted that SXS with excellent energy resolution provides us with new possibilities to measure the outflow velocity of X-ray emitting hot gas directly. The starburst phenomenon itself is considered to be universal in the history of the Universe (e.g. Pettini et al., 2001) and a normal event in the life of a galaxy (e.g. McQuinn et al., 2010), and plays a key role in transporting material and energy into intergalactic space. Although X-ray emitting hot gas heated by successive supernovae is a direct tracer of the outflowing material, to date all existing observational velocity measurements are of entrained cooler material, e.g., molecular clouds and warm neutral and ionized gas, with outflow velocities in the range 200–1000 km s-1 measured using radio/optical/UV emission and/or absorption lines (e.g. Shapley et al., 2003; Rupke et al., 2005; Martin et al., 2005). Therefore, detecting the outflow velocity of the hot gas is the last piece in the verification of the starburst-driven outflow scenario.
4.2 Prospects & Strategy
The SXS will revolutionize studies of abundances and temperatures in starburst galaxies, allowing important conclusions regarding the physical state of the hot gas. Suzaku spectroscopic studies have already demonstrated how well this works (e.g. Tsuru et al., 2007; Konami et al., 2011; Mitsuishi et al., 2013) so we can naturally continue and extend this work into more precisely determining the state of the ISM and therefore modeling the flow of energy and metals to the IGM. Thus the prospects are excellent and the tools/machinery/expertise is well in hand to conduct thorough studies.
The ultimate smoking gun would be the direct measurement of the velocities of the outflowing gas and demonstrate that they exceed the escape velocities of the galaxies. With the SXS, we will in principle be able to see Doppler shifts from outflowing gas (in practice, Doppler broadening will probably be too hard to detect). With sufficient signal-to-noise, one can in principle detect shifts of order a fraction (a few tenths) of the energy resolution, or maybe eV, which corresponds to km s-1 at 1 keV and km s-1 at 6 keV. However, this assumes a perfect knowledge of the gain. This will be challenging if the gain uncertainty for the SXS is at the 2 eV requirement. We describe the prospects for velocity measurements below in “Beyond Feasibility.”
4.3 Targets & Feasibility
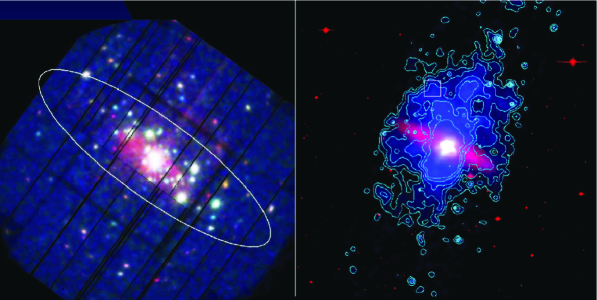
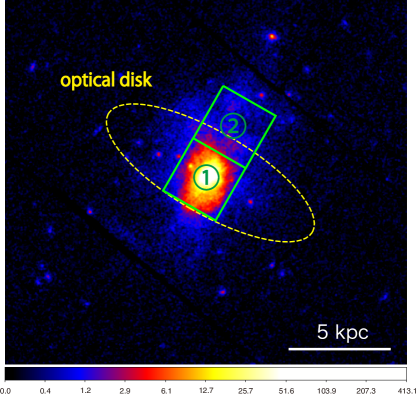
There are approximately 30 starburst galaxies in the local universe (within Mpc) with star formation properties and X-ray constraints that make them candidate targets for study with a high-resolution X-ray spectrometer (Strickland et al. 2009). However, of these, only two are sufficiently bright for consideration by ASTRO-H, and the exposures may be long enough that one should ultimately be chosen. These are NGC 253 ( Mpc) and M82 () Mpc. These two galaxies differ in a few key ways. NGC 253 is very large on the sky with a D25 extent of , making it possible to select different regions within the galaxy for study. M82 is more compact and more luminous. Figure 4 shows X-ray images of both galaxies.
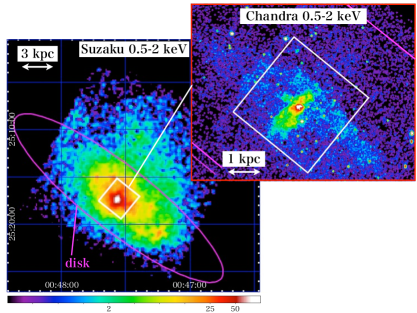
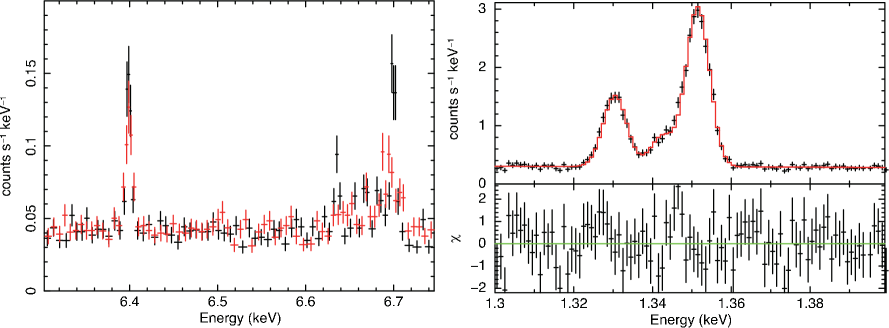
For instance in Mitsuishi et al. (2011) and Mitsuishi et al. (2013) there were four distinct regions studied in NGC 253 and we would likely suggest observing the nucleus to measure the outflow velocity of the observed hot gas. Its sufficient brightness (10-12 erg/s/cm2 in 0.5–2 keV) in the SXS Field of View (FOV)‘, ISM-dominant situation, large apparent size ( in optical disk), substantial multi-wavelength studies, and wide opening angle (, Westmoquette et al. (2011)) make the galaxy the best target in this study. Figure 5 shows Suzaku and Chandra images of the proposed region and an expected SXS spectrum with an exposure time of 100 ks and an outflow velocity of 300 km s-1. Here, 300 km s-1 is assumed as a reasonable value considering other wavelength studies (e.g. Balatto et al., 2013; Westmoquette et al., 2011; Kaneda et al., 2009) and an assumption that hot gas motion is faster than other components. Thanks to the excellent energy resolution of SXS with good photon statistics, typical statistical errors on temperatures and metal abundances are 10–40% at the 90% significance level, which enable us to investigate detailed plasma diagnostics. The outflow velocity is also tightly constrained, on the order of 50 km s-1, even with an exposure time of 50 ks within 5% accuracy assuming ideal gain calibration. However, considering the uncertainty on the gain scale (requirement: 2 eV, goal: 1 eV), emission lines at higher energies such as He-like Ar (3.14 keV), Ca (3.90 keV), and Fe (6.70 keV) should be utilized to distinguish an energy shift derived from the outflow from the gain uncertainty. Thus, to obtain sufficient photon numbers for these lines, 100 ks observation is required to determine the outflow velocity within 30% accuracy based on a fit to the 3–8 keV band. Table 2 summarizes the measurement accuracies as a function of exposure time.
| Exposure [ks] | 50 | 100 | 200 | 300 | |
|---|---|---|---|---|---|
| Accuracy† [%] | 5 | 5 | 5 | 5 | |
| -‡ | 30 | 30 | 20 |
∗Estimated exposure time for an outflow velocity of 300 km s-1.
†Resultant redshift does not include the input value within the 90% confidence level.
‡Measurement accuracy for the fit to 0.5–8 keV (top) and 3-8 keV (bottom).
The central region of M82 is very bright in X-rays, but it consists not only of diffuse hot ISM but also has several point sources including M82 X-1. The total energy spectrum is very complex, but the line profiles contains plenty information about the physical status of hot and cool ISM. Strickland et al. (2007) pointed out the Fe I (6.4 keV) line, and a velocity dispersion of a few 100 km-1 in the Fe XXV (6.7 keV) line. We simulated the energy spectrum based on Konami et al. (2011). If the only hot (Fe XXV) ISM has a velocity dispersion of 200 or 500 km s-1, it will be measured to 40% accuracy. If the cool ISM is static, while the hot ISM is expanding, we have an indication that physical processes associated with the starburst activity transfer energy directly to a hot outflow. If, on the other hand, the cool and hot ISM interact directly, charge exchange emission can be observed, and the intensity ratio between the forbidden plus intercombination lines to the resonance line in the He-like triplets (the ‘G-ratio’) will differ from the range observed in collisional equilibrium plasmas. Using the He-like Mg triplet, the G-ratio can be determined within a few % accuracy (or limited by systematic errors) by a 200 ksec SXS observation.
In order to study the chemical composition of the hot ISM in starburst galaxies, we select the M82 halo, because it is brighter that that of NGC 253, and less complex than in the core region. We select a region just above the core as shown in the figure 6, and call it the ”Wind” region. The stray light from the core shall be subtracted by the observed data. In a 200 ksec observation, the metal abundances can be determined by Fe L-line complex and the He-like Mg triplet to a 20% accuracy.
4.4 Beyond Feasibility
Alternative methods include SXS spectroscopy of the hard X-ray line emission (in particular Fe XXV He; Strickland & Heckman 2007) or absorption-line spectroscopy of background AGN or Ultra-Luminous X-ray sources (ULXs). A similar analysis on the circumgalactic gas of suitable starburst galaxies, using absorption spectroscopy on bright ULX’s and emission line spectroscopy from the halo, will be discussed below. We consider two cases, one using the ULXs in the outer galaxies, and the other is a QSO with an intervening absorption system. One bright ULX, M82 X-1, is 2 orders of magnitude fainter than Mrk 421. As the column density of M82 will be higher, emission from hot gas is difficult to eliminate from the observed spectrum of M82 X-1. Thus the Oxygen absorption lines will be hard to detect, and Ar or Si absorption lines may be better candidates.
The QSO A0235 +094 () has an intervening cloud at , observed by several satellites, with a column density of 2.4cm-2, as determined by XMM-Newton (Raiteri et al., 2005), which makes it an good candidate for spectroscopy with SXS, with a possible abundance determination for the intervening absorber. Absorption features of redshifted Oxygen with a column density of 1015 cm-2 were detected in Mrk 421 at outbursts with Chandra LETG (Nicastro et al., 2005) in 200 ksec exposure. The 0.5–2 keV flux of Mrk 421 in outburst reaches erg cm-2 sec-1 at the peak. The SXS has a larger effective area of 50 cm2 than Chandra LETG/ACIS ( 5 cm-2) in the Oxygen K band, while the resolving power of of 120 (or = 5 eV) is smaller than that of LETG (20). Thus the required exposure time will be, roughly, 1 Msec for a firm detection, using the approximate scaling with area and resolution of the sensitivity to weak absorption lines on a strong continuum.
5 Emission Line Spectroscopy of Early-type galaxies
5.1 Background and Previous Studies
Early-type galaxies have a hot, X-ray emitting ISM whose origin is considered to be the accumulation of stellar mass loss. The timescale for the accumulation of mass-loss products is smaller than 1 Gyr and the luminosities of the hot ISM in most early-type galaxies are consistent with the energy being input from such stellar mass loss (Matsushita, 2001). Recent supernovae (SN Ia) may inject additional metals, especially Si and Fe, and may also impart some energy to the ISM. Some early-type galaxies have ISM luminosities much higher than the rate of energy input from stellar mass loss. These galaxies are located within cool cores of group–scale potential structures that have a higher gravitational mass in the outer regions than the X-ray faint galaxies (Matsushita, 2001; Nagino & Matsushita, 2009). As in cool-cores in massive clusters of galaxies, there should be some form of energy injection. In these galaxies, Allen et al. (2006) found a tight correlation between the Bondi accretion rates and the power emerging from these systems in relativistic jets. As a result, they are also suitable to study feedback from active galactic nuclei.
The heating of the Intracluster Medium (ICM) may be driven by turbulent motions of the gas. Such turbulent motions in cool cores can be constrained by observing the effect of resonant scattering. Without turbulent motions, the hot Interstellar Medium (ISM) in the center of luminous early-type galaxies can be optically thick within some of the strong Fe-L lines. Xu et al. (2002) found that the flux of the Fe XVII line at 0.83 keV of the central region of an X-ray luminous elliptical galaxy, NGC 4636, observed with XMM-Newton RGS is smaller than what is expected from the APEC plasma code (Smith et al., 2001). This discrepancy indicates that resonant scattering suppresses the line flux emerging from the central region and the upper limit for the turbulent velocity in this galaxy is lower than 200 km/s, assuming isotropic turbulence (Xu et al., 2002; Werner et al., 2009). Werner et al. (2009) and de Plaa et al. (2012) also estimated the effect of the scattering for several elliptical galaxies, and found that the measured line ratios are different among galaxies. Although there is a systematic uncertainty in the theoretical line ratio, the difference in the measured values indicates a difference in the strengths of the turbulence.
Measurements of stellar metallicity in galaxies provide important information in understanding the history of star formation and the evolution of galaxies. Optical observations indicate that the abundance ratios of -elements and Fe of stars are super-solar in the cores of bright early-type galaxies and that they increase with the galactic mass (e.g. Kuntschner et al., 2010). This overabundance of -elements relative to Fe is a key indicator that galaxy formation occurred before a substantial number of SNe Ia could explode and contribute to lowering these ratios. However, absorption-line indices that account for abundance ratios also depend on the age distribution of stars. In addition, optical spectroscopy is limited to about the central half light radius of galaxies.
Using X-ray observations, we can both directly determine the metal abundances of the ISM and constrain the stellar metallicity of the entire galaxy. In particular, the O, Ne, and Mg abundances should reflect the stellar metallicity, since these elements are predominantly synthesized in core-collapse SNe (SNecc). The atomic data for lines at X-ray wavelengths are simpler than for those in optical spectra, and the structure of the hot ISM is also much simpler than stellar population data. Although some early-type galaxies show dust emission, the dust sputtering time scale in the ISM is much shorter than the timescale for the ISM. We can therefore estimate the temperature and metallicity of the hot ISM through X-ray spectra with small systematic uncertainties, after calibrating the systematic uncertainties in the Fe-L atomic data. In addition, because Ne is not injected into the ISM in the form of dust, to reduce the systematic uncertainties caused by the existence of dust we need measurements of Ne in the ISM.
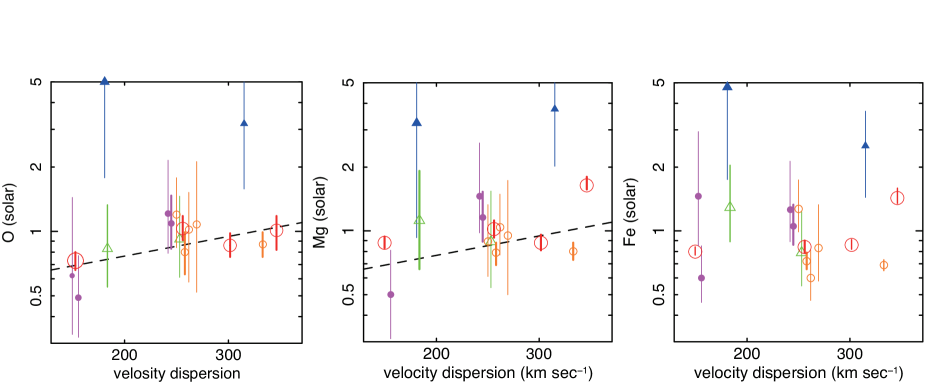
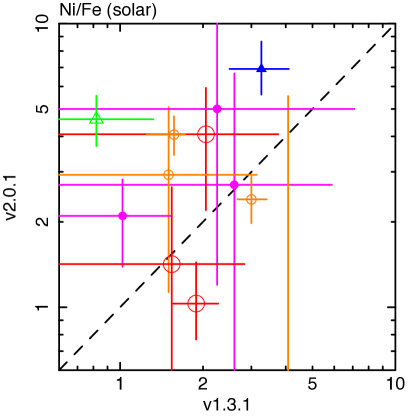
The metal abundances in the ISM have been studied with ASCA, Chandra, XMM-Newton and Suzaku. Early measurements of the ISM with ASCA showed that metallicity is less than half of solar abundances, which is significantly smaller than the stellar metallicity, and the expected contribution from SN Ia (e.g. Awaki et al., 1994). The uncertainties in the temperature structure and/or in the Fe-L atomic data sometimes yield very large systematic uncertainties in the derived abundances in the ISM, especially from CCD spectra (e.g. Matsushita, 2000). Using plasma code with revised atomic data, as shown in Figure 8, Konami et al. (2014) found that the derived O and Mg abundances in the ISM with Suzaku mostly agree with a metallicity- relation derived from optical spectroscopy within about the effective radius, or about the half light radius. In contrast, Figure 9 shows that the derived Ne/Fe ratios are about a factor of two higher than the O/Fe, Mg/Fe, and Si/Fe ratios in units of the solar ratio. The derived Ni/Fe ratios become 1–8 in units of the solar ratio, with a very large scatter, and the difference in the Ni/Fe ratios between the two versions of APEC codes sometimes reaches a factor of 5 (Figure 9). These large Ne/Fe and Ni/Fe ratios cannot be explained by any nucleosynthesis models for SNcc and SN Ia. Since Ni-L and Ne-K lines are hidden in the Fe-L lines, the abundances of these elements are derived from residuals between the data and the Fe-L model, which strongly depends on the plasma codes. These anomalies in the Ne and Ni abundances therefore may be caused by remaining systematic uncertainties in the plasma codes.
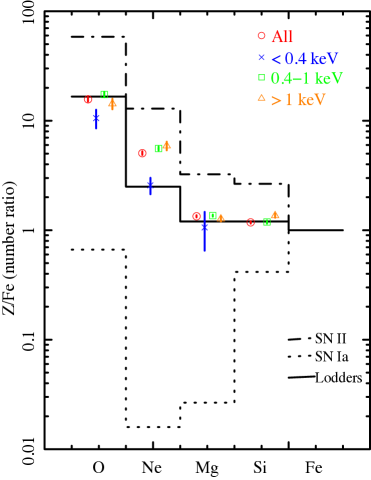
The Fe abundance in the ISM is a sum of stellar metallicity and the contribution from SN Ia. The standard SN Ia rates derived from optical observations predict the Fe abundance in the ISM to be as high as several times the solar value (see Konami et al., 2014, in detail). However, the derived Fe abundances in the ISM with Suzaku are about 0.8 solar (Figure 8). Subtracting the contribution from SNecc, the Fe abundance from the SN Ia becomes 0.5 solar. Therefore, if all the ejecta of SNe Ia have been completely mixed into the ISM, the present SN Ia rate needed to account for the observed Fe abundance in the ISM is significantly smaller than what is expected. The ICM in clusters of galaxies contains a large amount of Fe and the metal abundances in the ISM in early-type galaxies provide important information about the present metal supply into the ICM through SN Ia and stellar mass loss. However, accumulating the present supply of Fe derived from the Fe abundance in the ISM, the resultant Fe mass is lower by two orders of magnitude than that in the ICM. One possibility is that the lifetimes of most SNe Ia are much shorter than the Hubble time, and the SN Ia rate in cluster galaxies was much higher in the past. Another possibility is that if some part of SN Ia ejecta can escape the ISM before being fully mixed into the ISM, the Fe abundance can be lower. Furthermore, there may remain systematic uncertainties in the abundance measurements caused by uncertainties in the Fe-L atomic data.
5.2 Prospects & Strategy
The X-ray spectra from the hot ISM in early-type galaxies are dominated by very complicated Fe-L emission. Severe discrepancies still remain between plasma codes which calculate the X-ray emission spectra of an optically thin plasma. The energy resolution of the ASTRO-H SXS in the Fe-L energy band is significantly better than the RGS onboard XMM-Newton for extended sources whose spatial scale is larger than . For example, at 1 keV, the spectral resolving power for a extended source with source extent is about 100 using the RGS detectors. Calibration of the plasma codes using the ASTRO-H SXS data will therefore be critically important to study the effects of the resonant scattering and abundance measurements in the ISM. The ISM in these galaxies is expected to be close to ionization equilibrium, and the temperature structure is relatively simple, the density is low and the ISM is mostly optically thin. As a result, the ISM in early-type galaxies is much simpler than the X-ray emitting regions of stars, supernova remnants, hot gaseous halos in spiral galaxies, and cool cores in clusters of galaxies. They are thus the best target to calibrate the Fe-L emission, which is very important to the study of other SXS spectra dominated by Fe-L lines.
With the ASTRO-H SXS, we can study the spatial variation of the line ratios of optically thick and optically thin lines and study the effects of resonant scattering, though direct measurements of turbulent velocities are challenging. For example, for NGC 4636, the expected optical depth is about 9 for the 0.83 keV Fe XVII line and about unity for Fe XVIII line at 0.87 keV and Ly O line (Werner et al., 2009; Churazov et al., 2010). Thus, the flux ratios of the 0.83 keV line and optically thin lines with the same ionization (for example, Fe XVII lines at 0.73 keV) are usually used to study the effect of the scattering. Without turbulent motions, the 0.83 keV line flux from NGC 4636 is expected to be modified out to a few arcminutes, which will be resolved with ASTRO-H. To calibrate the atomic data, offset observations, where both the temperature structure is simpler than in the core regions and the 0.83 keV line becomes optically thin, are important.
Observations of the hot ISM in early-type galaxies enable us to study the present metal supply from early-type galaxies. Thus, observations of these galaxies with the ASTRO-H SXS are complementary to those of clusters of galaxies, since the metals in the ICM in the cool core of clusters are a mixture of those present in the ICM and those supplied later from their cD galaxies. Outside the cool-cores, the metals accumulate over much longer time scales. With the SXS, the Ni and Ne lines will become free from the complex Fe-L lines and we will be able to derive abundances of these elements with much smaller systematic uncertainties. Furthermore, with superior energy resolution and a modest effective area, we will able to detect very faint line emission such as Al-K lines. Nucleosynthesis models indicate that the abundances of odd-Z elements like Al show a strong dependence of stellar metallicity (Nomoto et al., 2006; Kobayashi et al., 2006). These elements are enhanced by the surplus of neutrons in 22Ne, which is synthesized by CNO cycle during He-burning. In this way, the abundance of Al in the ICM can be used as an indicator of the stellar metallicity.
Although most of the metal is provided by SNe or massive stars and white dwarfs, C and N are also ejected from low-mass and intermediate-mass stars during the asymptotic giant branch phase. The formation history of intermediate mass stars is poorly known, compared to massive stars which emit strong optical emission lines and low mass stars whose life time is very long. The abundance measurements of C and N in the ISM will give us some information of history of the intermediate mass stars.
If present SNe Ia ejecta are not fully mixed into the ISM, they may remain very hot and, due to their buoyancy, may be escaping from galaxies (Matsushita, 2000; Tang & Wang, 2010). Fe-K line emission from these ejecta may then be observed with the SXS. Even if the Fe-K line is not detected, we can place tight constraints on the metal supply from present SNe Ia in these galaxies, and hence constrain the Fe enrichment history in clusters of galaxies.
5.3 Targets & Feasibility
Located in the Virgo Southern Extension, NGC 4636 is one of the brightest giant elliptical galaxies in X-ray wavelengths. ASCA observations have shown very extended X-ray emission with a radius at least 300 kpc surrounding this galaxy (Matsushita et al., 1998). Using Chandra data Jones et al. (2002) found arm-like structures as shown in Figure 10. They suggest that these structures are produced by shocks driven by symmetric off-center outbursts of the central AGN. In spite of these structures, the temperature structure seems relatively simple; the projected temperature profile in the ISM with Chandra and XMM-Newton shows a relatively small variation (e.g. Werner et al., 2009), and the RGS and Suzaku spectra are fitted with a single-temperature model. As a result, this galaxy is one of the most suitable targets to calibrate the Fe-L emission and to study the effects of the resonant scattering and abundance measurements.
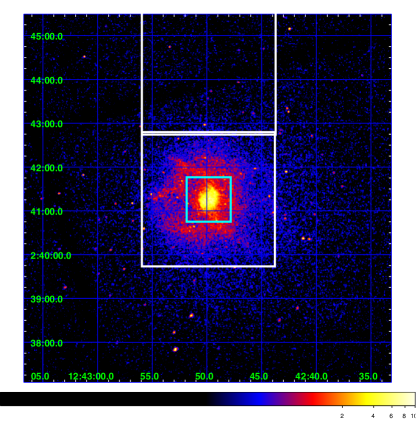
We extracted MOS spectra of annular regions (, , , ) centered on NGC 4636 and fitted each spectrum with a single-temperature vAPEC model. We then used simx-1.3.1 to simulate SXS spectra with the 5 eV response file, assuming 50 ks, 100 ks, and 200 ks exposures, pointing at the center of the galaxy and at a position offset toward north, as shown in Figure 10.
The FOV of the offset pointing is almost free from the effects of resonant line scattering and the arm-like shock structure, and probably has a simple temperature structure. The fraction of scattered photons due to the point spread function (PSF) is about 15% of detected photons within the FOV and is not significant. The SXS spectrum for this region may therefore be used to evaluate the validity of the atomic data.
5.3.1 Resonant line scattering
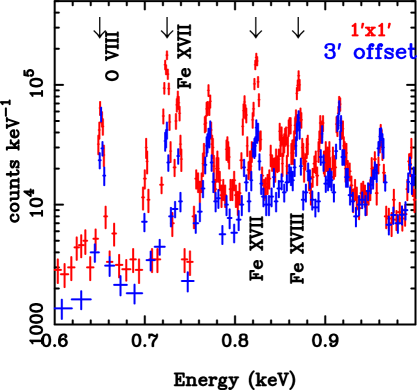
The right panel of Figure 10 shows the simulated SXS spectra at the Fe-L energy range. The expected optical depth of the 0.83 keV and 0.87 keV lines at the center of NGC 4636 is about 9 and unity, respectively (Churazov et al., 2010). Table 3 summarizes the expected number of photons for a 100 ks exposure for the two Fe-L lines at 0.83 keV (Fe XVII) and 0.87 keV (Fe XVIII). As shown in Figure 10, we expect a similar number of photons from the optically thin Fe XVII lines at 0.73 keV. The effect of line scattering for the 0.83 keV line is strongest within the central few kpc, which corresponds to about 0.5′. Considering the effect of the PSF, about 60% of the detected photons within the central region come from the circular region on the sky. Outside the central region, about 20% and 70% of photons will come from and 0.5 regions, respectively. This demonstrates that we will able to constrain the amount of turbulence by using information derived from the radial profile of the flux ratio of these lines to the other Fe-L lines. We will also be able to evaluate the systematic uncertainty in the plasma codes.
| region | 0.83 keV | 0.87 keV | |
|---|---|---|---|
| expected optical deptha | 8.8 | 1.3 | |
| offset | central | 1000 | 700 |
| offset | outside central | 2600 | 2100 |
| offset | FOV | 300 | 300 |
a: Churazov et al. (2010)
5.3.2 Metal abundances in the ISM
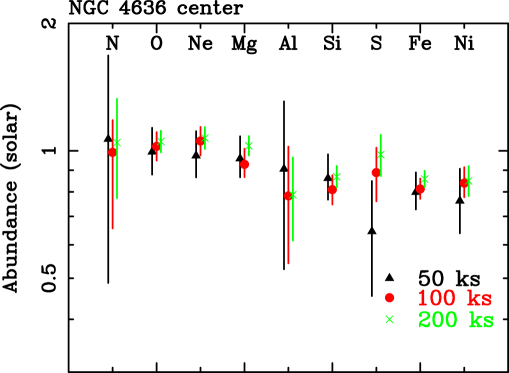
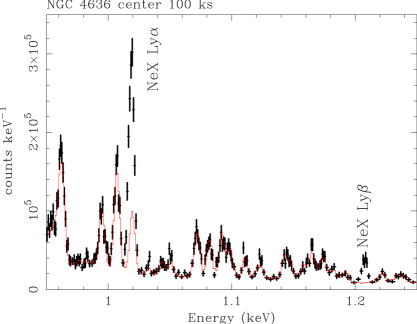
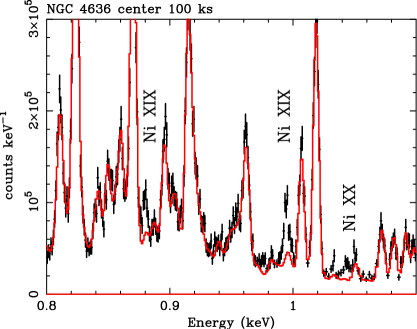
Figure 11 shows the expected metal abundances from the simulated SXS spectra of the central region of NGC 4636 assuming 50 ks, 100 ks, and 200 ks exposures. From the central pointing, abundances of O, Ne, Mg, Si, S, Fe and Ni in the ISM will be measured with a 10–20% statistical accuracy with a 100 ks exposure. In addition, the N abundance will be measured to an accuracy of 20–30%. Figure 12 shows the Ne and Ni lines in the Fe-L lines. With the SXS, we can directly measure the strengths of the Ne-K and Ni-L lines. In particular, some lines such as the Ly line of Ne at 1.2 keV and the Ni XIX line at 1 keV are mostly free from the Fe-L lines.
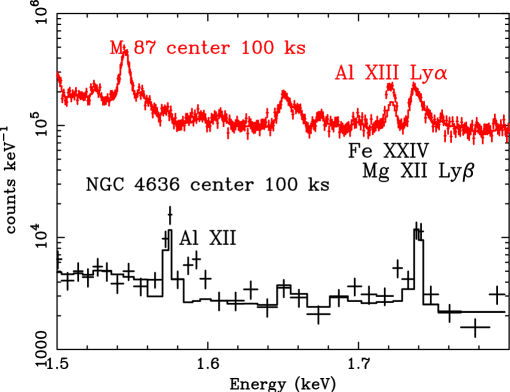
The Al abundance in the ISM of the central region will be measured with statistical errors of 0.4 solar, 0.24 solar, and 0.17 solar, respectively, assuming 50 ks, 100 ks, and 200 ks, exposures. Unfortunately, there are Fe lines at almost the same energies as the Ly line of Al (Figure 13). Here, we also show a simulated SXS spectrum of the center of M 87 with a 100 ks exposure. Although the statistics for NGC 4636 are much poorer than that for M 87, the Al lines from NGC 4636 have less contamination from the Fe-L line. Therefore, the systematic uncertainty caused by uncertainty in the atomic data should be much smaller in NGC 4636.
If one half of the Fe remains as hot (several keV) SNe Ia ejecta escaping from the ISM, we expect several tens of counts in the Fe-K line with the SXS from the central observation of NGC 4636 with a 100 ks exposure.
References
- Allen et al. (2006) Allen, S. W., Dunn, R. J. H., Fabian, A. C., Taylor, G. B., & Reynolds, C. S. 2006, MNRAS, 372, 21
- Awaki et al. (1994) Awaki, H., Mushotzky, R., Tsuru, T., et al. 1994, PASJ, 46, L65
- Balatto et al. (2013) Balatto, A. D., et al. 2013, Nature, 499, 450
- Churazov et al. (2010) Churazov, E., Zhuravleva, I., Sazonov, S., & Sunyaev, R. 2010, Space Sci. Rev., 157, 193
- de Plaa et al. (2012) de Plaa, J., Zhuravleva, I., Werner, N., et al. 2012, A&Ap, 539, A34
- de Vries & Costantini (2009) de Vries, C., & Costantini, E. 2009, A&A, 497, 393
- Draine (2009) Draine, B. T. 2009, in Cosmic Dust - Near and Far, ASP Conference Series, Vol. 414, 414, 453
- Efstathiou et al. (2000) Efstathiou, G. et al. 2000, MNRAS, 317, 697
- Foster et al. (2012) Foster, A. R., Ji, L., Smith, R. K., & Brickhouse, N. S. 2012, ApJ, 756, 128
- Gupta et al. (2009) Gupta, A. et al. 2009, ApJ, 707, 645
- Hayashi et al. (2009) Hayashi, K., et al. 2009, PASJ, 61, 1185
- in’t Zand et al. (2004) in’t Zand, J., Verbunt, F., Heise, J., et al. 2004, Nuclear Physics B Proceedings Supplements, 132, 486
- Iwamoto et al. (1999) Iwamoto, K., Brachwitz, F., Nomoto, K., Kishimoto, N., Umeda, H., Hix, W. R., & Thielemann, F.-K. 1999, ApJS, 125, 439
- Jones et al. (2002) Jones, C., et al. 2002, ApJ, 567, L115
- Kaneda et al. (2009) Kaneda, H. et al. 2009, ApJL, 698, 125
- Kobayashi et al. (2006) Kobayashi, C., et al. 2006, ApJ, 653, 1145
- Konami et al. (2011) Konami, S. et al. 2011, PASJ, 63, 913
- Konami et al. (2014) Konami, S., Matsushita, K., Nagino, R., &Tamagawa, T., 2014, ApJ, 783, 8
- Kuntschner et al. (2010) Kuntschner, H., Emsellem, E., Bacon, R., et al. 2010, MNRAS, 408, 97
- Lee et al. (2009) Lee, J. C., Xiang, J., Ravel, B., Kortright, J., & Flanagan, K. 2009, ApJ, 702, 970
- Lodders (2003) Lodders, K. 2003, ApJ, 591, 1220
- Lodders & Palme (2009) Lodders, K., & Palme, H. 2009, Meteoritics and Planetary Science Supplement, 72, 5154
- Martin et al. (2005) Martin, C. 2005, ApJ, 621, 227
- Matsushita et al. (1998) Matsushita, K., et al. 1998, ApJL, 499, L13
- Matsushita (2001) Matsushita, K. 2001, ApJ, 547, 693
- Matsushita (2000) Matsushita, K., Ohashi, T., Makishima, K. 2000, PASJ, 52, 685
- Matsushita et al. (2007) Matsushita, K. et al. 2007, PASJ, 59, 327
- McQuinn et al. (2010) McQuinn, K. B. W. et al. 2010, ApJ, 724, 49
- Mitsuda et al. (2010) Mitsuda, K., et al. 2010, Proc. SPIE, 7732, 29
- Mitsuishi et al. (2011) Mitsuishi, I. et al. 2011 ApJL, 742, L31
- Mitsuishi et al. (2013) Mitsuishi, I. et al. 2013, PASJ, 65,44
- Nagino & Matsushita (2009) Nagino, R., & Matsushita, K. 2009, A&Ap, 501, 157
- Nicastro et al. (2005) Nicastro, F., et al. 2005, ApJ, 629, 700
- Nomoto et al. (2006) Nomoto, K., et al. 2006, Nuclear Physics A, 777, 424
- Nomoto et al. (1997) Nomoto, K., Iwamoto, K., Nakasato, N., et al. 1997, Nuclear Physics A, 621, 467
- Pettini et al. (2001) Pettini, M. et al. 2001, ApJ, 554, 981
- Raiteri et al. (2005) Raiteri, C.M., et al 2005, A&A, 438, 39
- Rupke et al. (2005) Rupke, D., et al. 2005, ApJ, 632, 751
- Shapley et al. (2003) Shapley, A., et al. 2003, ApJ, 588, 65
- Smith et al. (2001) Smith, R.K., Brickhouse, N.S., Liedahl,D.A., & Raymond, J.S., 2001, ApJ, 556, 91
- Strickland et al. (2007) Strickland, D.K. & Heckman, T.M. 2007, ApJ, 658, 258
- Tang & Wang (2010) Tang, S., & Wang, Q. D. 2010, MNRAS, 408, 1011
- Tsunemi et al. (2010) Tsunemi, H., et al. 2010, Proc. SPIE, 7732, 28
- Tsuru et al. (2007) Tsuru, T., et al. 2007, PASJ, 59, 269
- Werner et al. (2009) Werner, N., Zhuravleva, I., Churazov, E., et al. 2009, MNRAS, 398, 23
- Westmoquette et al. (2011) Westmoquette et al. 2011, MNRAS, 414, 3719
- Whittet (2003) Whittet, D. C. B. 2003, Dust in the galactic environment, 2nd ed. Bristol: Institute of Physics (IOP) Publishing, 2003
- Xu et al. (2002) Xu, H., Kahn, S. M., Peterson, J. R., et al. 2002, ApJ, 579, 600
- Yao & Wang (2007) Yao, Y., & Wang, Q. D. 2009, ApJ, 666, 242
- Yao & Wang (2012) Yao, Y., & Wang, Q. D. 2012, ApJ, arXiv1211.4834
- Yoshino et al. (2009) Yoshino, T, Mitsuda, K., Yamasaki, N., et al. 2009, PASJ, 61, 805
- Yoshitake et al. (2013) Yoshitake, H. et al 2013, PASJ, 65, 32