A Minor Merger Caught In The Act Of Fueling The AGN In Mrk 509
Abstract
In recent observations by the Hubble Space Telescope (HST) as part of a campaign to discover locations and kinematics of AGN outflows, we found that Mrk 509 contains a 3′′ (2100 pc) linear filament in its central region. Visible in both optical continuum and [OIII] imaging, this feature resembles a ‘check mark’ of several knots of emission that travel northwest to southeast before jutting towards the nucleus from the southwest. Space Telescope Imaging Spectrograph (STIS/HST) observations along the inner portion of the filament reveal redshifted velocities, indicating that the filament is inflowing. We present further observations of the nucleus in Mrk 509 using the Gemini Near-Infrared Integral Field Spectrograph (NIFS), from which we conclude that this structure cannot be related to previously studied, typical NLR outflows and instead embodies the remains of an ongoing minor merger with a gas-rich dwarf galaxy, therefore providing a great opportunity to study the fueling of an AGN by a minor merger in progress.
1 Introduction
The fueling of active galactic nuclei (AGN) and their subsequent ‘feedback’ via outflows of ionized gas is thought to play a critical role in the formation of large-scale structure in the early Universe (Scannapieco & Oh, 2004), chemical enrichment of the intergalactic medium (Khalatyan et al., 2008), and self-regulation of super-massive black hole (SMBH) and galactic bulge growth (Hopkins et al., 2005). However, we have very little direct information on the details of AGN feeding and feedback. Large-scale fueling of AGN is thought to be instigated by galaxy interactions, and, in the case of luminous quasars, there is observational evidence that major mergers between large galaxies play a significant role (Canalizo & Stockton, 2001). However, in the case of nearby, lower luminosity (L erg s-1) Seyfert galaxies, the evidence is not so clear, as some studies claim that Seyferts show an excess of companions (e.g., Koss et al. 2011), indicating large-scale interactions, while others claim a lack thereof (e.g., Schmitt 2001). An obvious alternative to requiring major mergers is that lower-luminosity AGN are fueled by minor mergers of their host galaxies with small satellite galaxies. However, the observational evidence thus far has been lacking.
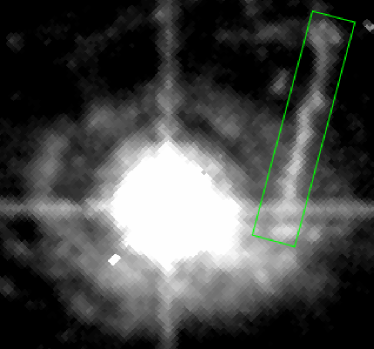
As part of a recent project to map the kinematics of the Narrow Line Region (NLR) of Seyfert galaxies (Fischer et al., 2013), we obtained WFC3 [OIII] and continuum (F550M) images of Mrk 509, a nearby (), highly luminous (L ergs s-1, Awaki et al. 2001; Kraemer et al. 2004) Type 1 AGN, where we discovered an asymmetric filament adjacent to the nucleus, shown in Figure 1. The majority of the filament is a linear feature several kiloparsecs long to the west of the nucleus, stretching from northwest to southeast, and is most prominent at radii pc, inside the massive starburst ring which surrounds the AGN (although it does extend beyond the ring; Figure 1). The linear feature connects to a second emission-line region extending from the southwest to the nucleus, giving the entire filament the appearance of a check mark.
In our HST kinematics analysis of a STIS long-slit spectrum of the inner portion of the filament (Fischer et al., 2013), we suggested that we may be viewing a minor merger with a dwarf galaxy and that this system would provide a great opportunity to study the fueling of an AGN by a minor merger in progress. However, from our initial results, we could not be certain, as the data could be interpreted in several ways, such that the observed redshifted velocities in the inner portion could be infalling from the near side of the galaxy or outflowing from the far side. Here we present further analysis of the filament using the Gemini NIFS Integral Field Unit (IFU), particularly of the extended linear feature, which clarify the kinematics of the filament and indicate that it is inflowing.
2 Observations
We observed Mrk 509 using Gemini/NIFS employing the Gemini North Altitude Conjugate Adaptive Optics for the Infrared (ALTAIR) adaptive optics system in 2013 June through program GN-2013A-Q-40. We obtained observations in the Z-band, which has a spectral resolution of and covers a spectral region of 0.94 - 1.15 m. Observation sequencing followed standard object-sky-object dithering (Riffel & Storchi-Bergmann, 2011; Riffel et al., 2013) with off-source sky positions common for extended targets. Eight individual exposures of 450 s were obtained, for 3600 s in total. Data reduction was performed using tasks contained in the NIFS subpackage within the GEMINI IRAF package, in addition to standard IRAF tasks. The reduction process included image trimming, flat fielding, sky subtraction, and wavelength and s-distortion calibrations. Frames were corrected for telluric bands and flux calibrated by interpolating a blackbody function to the spectrum of a telluric standard star. The resultant data cube was median combined into a single data cube via the gemcombine task of the GEMINI IRAF package. The final data cube contains approximately 4000 spatial pixels (spaxels). At a redshift of , each spaxel corresponds to an angular sampling of (34.4 pc 34.4 pc), with observations covering the inner (2.06 kpc 2.06 kpc) of the AGN. We note that the observations oversample the point-spread function, which has a full-width at half-maximum of 2 pixels.
3 Analysis
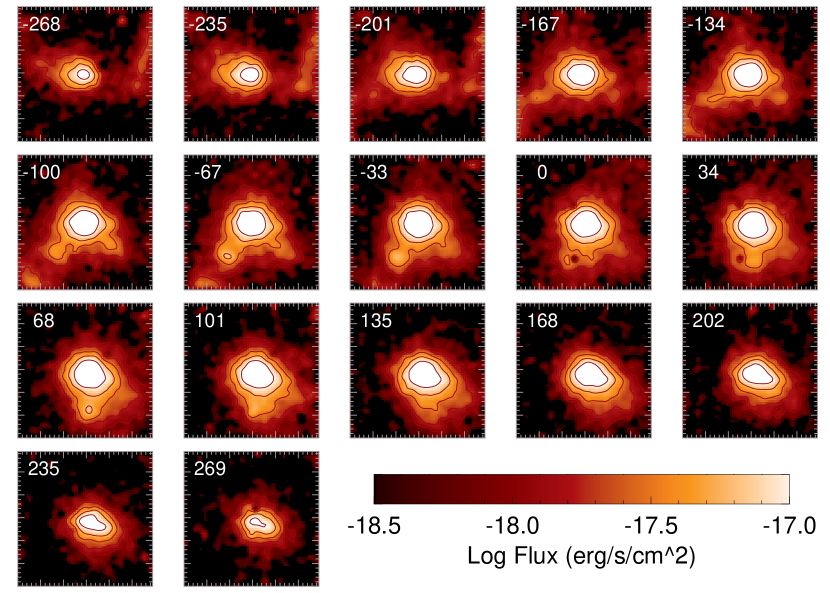
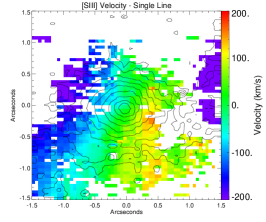
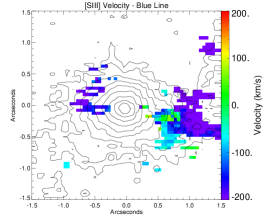
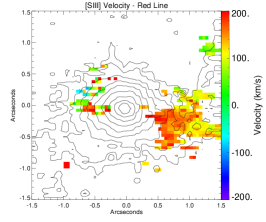
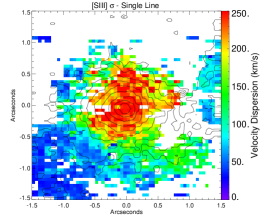
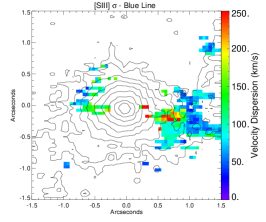
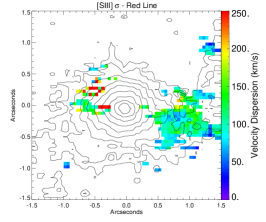
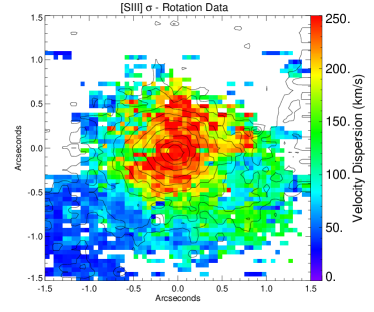
Figure 2 shows continuum subtracted [S III] 0.95m flux maps obtained by integrating the flux within velocity bins of 33 km s-1 along the [S III] emission-line profile. We fit individual components of the [S III] 0.95m emission lines with Gaussians over an average continuum taken from line-free regions throughout the spectrum to measure velocities in each spaxel. A majority of the spaxels contained single-component [S III] lines, which were fit with a single Gaussian (Figure 3, left), whereas the remaining spaxels contained two-component [S III] emission lines, either as two individual peaked lines or a single peaked line with an asymmetric wing, which were fit with two Gaussians. The center and right panels of Figure 3 display the kinematics of shorter wavelength (‘blue’) and longer wavelength (‘red’) components, respectively, for each [S III] line fit with two Gaussians. If an emission line contained a peak and an asymmetric wing, the wing was fit with a Gaussian only in situations where the flux component responsible for creating a significant asymmetry in an emission line was traceable through adjacent spaxels in the cube.
The central wavelength of each Gaussian was used to measure a Doppler shifted velocity for each emission line component, given in the rest frame of the galaxy and using a [S III] rest wavelength of 9533.2 Å. We employ a Gaussian fit rather than a direct integration across the line profile because in most cases the former is more suited to extract individual velocities from blended lines. Noisy spectra (S/N 3 per resolution element and not adjacent to successfully fit lines) were not fitted.
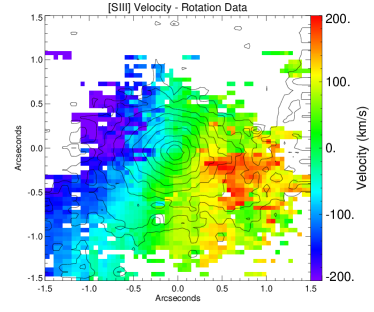
The inner portion of the check-mark filament is visible in the velocity channel map to the right of the nucleus (Figure 2), approximately 0.5′′ - 1.5′′ west, with a outer, linear portion traveling from northwest to southeast before taking a sharp turn northeast approximately 0.25′′ south of the nucleus. Velocities associated with the linear portion of the filament are clearly defined, with blueshifted velocities that increase with distance from the turn in the filament. The kinematics of the inner portion of the filament are more difficult to distinguish, as several spectra taken over the inner portion contain two component [S III] lines. If we ignore all kinematics pertaining to the filament (i.e. the western blueshifted velocities of Figure 3), the remaining kinematics resemble disk rotation. This observation concurs with those made in Phillips et al. (1983), who measured the kinematics of low-ionization lines surrounding the nucleus and found the velocities fit a disk model with a rotation axis of . Adding the red component velocities measured in the double-peaked [S III] lines to the map of the single line velocities creates a kinematic field that further resembles a rotating disk.
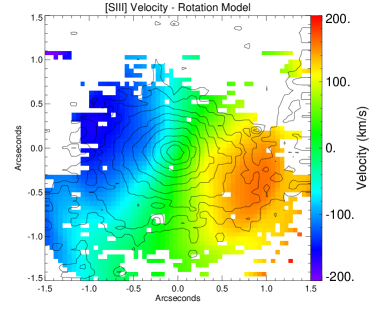
In order to confirm that these kinematics could be due rotation of the host disk, We used DiskFit (Spekkens & Sellwood, 2007; Sellwood & Sánchez, 2010; Kuzio de Naray et al., 2012), a publicly available code which fits non-parametric models to a given velocity field, in order to confirm that these kinematics could be due rotation of the host disk. We applied the rotation model to the kinematics, using the single line plus red component velocity field, an initial rotational major axis position angle of -135∘ and ellipticity of 0.18 (taken from Phillips et al. 1983 kinematics and isophotes respectively), and a nuclear location centered in the NIFS field of view (FOV), near the [S III] emission peak. For DiskFit to create a kinematic model which has a center overlapping the photometric center, we required that the velocities at the photometric center be effectively zero. This required us to calculate a new redshift to replace the value of we had been using previously. [S III] emission lines over the photometric nucleus were measured to have a central wavelength of 9863.5Å and setting the velocities of these lines to zero, while also accounting for a heliocentric velocity of 31.5 km s-1, we calculated a new redshift for Mrk 509 of . All figures contain systemic velocities calculated using this new redshift. The model using these revised velocities generates a disk with a major axis , an ellipticity of , and an inclination of , with a nucleus offset from the center of the FOV by and spaxels in the X and Y directions respectively. With a disk inclination of , the maximum observed rotational velocities of 160 km s-1 can be deprojected to obtain a true rotational velocity of 500 km s-1. While rather high, this velocity is not outside the realm of velocities measured in other disk galaxies (Sparke & Gallagher, 2000). Alternatively, rotation models are prone to showing a degeneracy between the amplitude of the rotation curve and the inclination of the galaxy, and the true velocity may be lower as the true inclination could be larger than what is given from the model output.
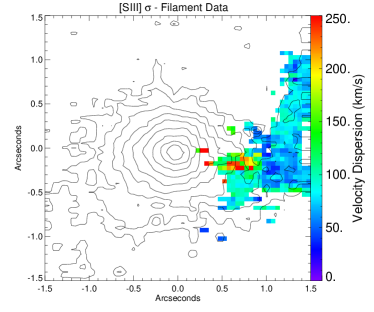
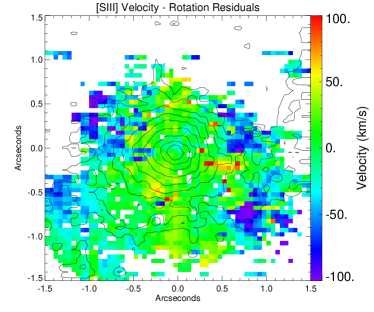
Figures 4 and 5 show the rotation and filament velocity field data and the derived rotation model and residuals, respectively. The resultant major axis is practically identical to the isophotal major axis (Phillips et al., 1983), suggesting that these kinematics are indeed due to rotation. Large kinematics discrepancies exist approximately 0.75′′ southwest of the nucleus, where residuals between the rotation data and model reach velocities of 100 km s-1. These larger errors in this region may be a result of the model attempting to accurately fit both the high velocity red-component data points, which we credit to pure rotation, and the surrounding, lower velocity single-Gaussian data points, which are likely some combination of rotation and filament kinematic components.
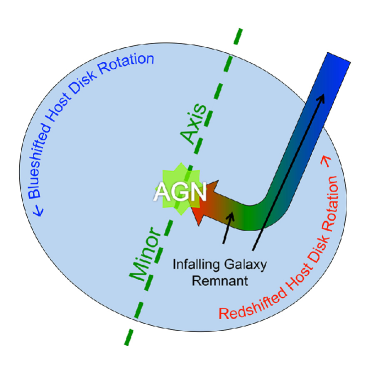
With the red component of the double-peaked [SIII] lines being attributed to rotation, the remaining blue component velocities correspond to the inner portion of the filament. Thus, the full kinematic map of the filament in Mrk 509, as shown in Figure 4, can be seen by combining the blueshifted velocities of the single-peaked [SIII] lines west of the nucleus and the blue component of the double-peaked lines. In the inner portion of the filament, the ‘blue’ component is actually close to systemic or slightly redshifted. These velocities can therefore be interpreted as the filament decelerating to systemic velocity as it reaches the corner of its check mark geometry and beginning to fall back toward the nucleus as redshifted velocities appear closer toward the nucleus. It is much more difficult to interpret the check mark as an outflow feature in the opposite direction because the filament would have to originate close to the nucleus, take a sharp right angle turn at 700 pc, and then accelerate outwards.
4 Discussion and Conclusions
Measured velocities show kinematic components for 1) a rotating host disk and 2) the inner few kiloparsecs of the filament. We find that the linear portion of the filament, adjacent to the nucleus, contains blueshifted velocities that decelerate to systemic velocity as it nears the ‘elbow’ of the check mark, and accelerate to redshifted velocities as the filament continues to travel toward the nucleus. Given the detailed kinematics now available for the filament in Mrk 509, in addition to its continuum emission, morphology, and orientation, we conclude that the filament structure cannot be related to typical NLR outflows (Fischer et al., 2013, 2014). These kinematics instead suggest inflow where the filament is traveling toward us before decelerating as it interacts with the host disk, likely through dynamical friction (Kendall et al., 2003), and begins to fall back toward the nucleus, as shown in Figure 6.
In this two-component model, we do not account for redshifted velocities to the northeast of the nucleus (Figure 3, right). The source of these kinematics are unclear and not included in our analysis, as it cannot be determined whether they are inflowing or outflowing. Inflows may be present if the dwarf galaxy fell from high latitudes onto the host disk, crossed over the nucleus instead of falling into the nucleus, and then fell back toward the center where the red velocities are observed. Alternatively, these red velocities could be due to outflows, where the observed emission is one half of a biconical outflow and the symmetric blueshifted portion is hidden amongst the blueshifted velocities of the inflowing filament.
Our current interpretation agrees with that given in Phillips et al. (1983), where spectral analysis of low-ionization gas surrounding the nucleus conforms to a rotation pattern, and high-ionization gas in the same locations exhibit only blueshifted velocities. As we detect velocities of similar scale in both the rotation and highly ionized, inflowing components, we can attribute the difference in velocities between the low- and high-ionization gases seen in their results to the filament being bright in highly ionized line species (i.e. [O III] and [S III]) versus emission from the host disk. In measurements where emission lines are a combination of both the redshifted portion of the rotation curve and the bright, blueshifted filament, the peak of the emission lines would be shifted to shorter wavelengths.
Although it is common to see the effects of interactions between galaxies as disturbances and tidal tails in their outer regions, minor mergers and the tidal striping of a dwarf galaxy as it falls towards the nucleus of a Seyfert galaxy are a rare occurrence (Kendall et al., 2003), as a only a small number of satellites will have an initial orbit path resulting in a direct merger onto the nucleus of the host galaxy versus simply being assimilated into the host galaxy disk. Mrk 509 embodies the first detected case of remains of an ongoing minor merger with a gas-rich dwarf galaxy. An explanation for the observed filament kinematics may then be that the linear, blueshifted portion is the orbital velocity of the merging dwarf galaxy before colliding with the inner host disk, and the inner redshifted portion shows pure gravitational infall into the nucleus after losing its orbital angular momentum.
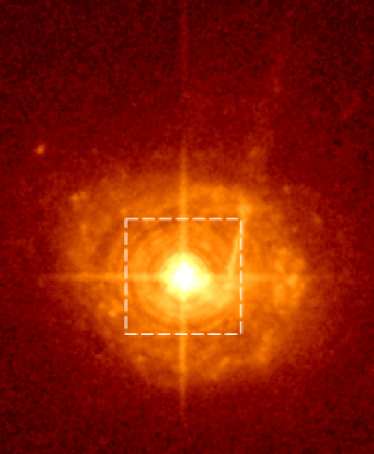
From available HST continuum imaging (Figure 7), the measured flux of this filament corresponds to ∼1.5% of the flux of the host galaxy of Mrk 509, a flux ratio similar to that between the Milky Way and the Small Magellanic Cloud. How efficient can we expect a minor merger such as this to be in fueling the host SMBH? Using M (Peterson et al., 2004) we calculate an Eddington luminosity of erg s-1. With an X-ray luminosity of erg s-1 (Kraemer et al. 2004, and references therein) and a bolometric correction of 30 (Awaki et al., 2001), we calculate a bolometric luminosity of erg s-1, and an Eddington ratio of for Mrk 509. If we use the Kraemer et al. (2004) [O III] luminosity erg s-1 instead of , we calculate the bolometric luminosity (using a correction of 3500; Heckman et al. 2004) to be erg s-1, with a resultant Eddington ratio of . These values are high for typical Seyferts, which generally have (Ho, 2009). Thus, Mrk 509’s high luminosity and high Eddington ratio are consistent with an ongoing fueling event. Measurements of additional infrared emission lines will allow us to determine gas densities and masses of the inflowing gas via photoionization models, allowing for a mass inflow measurement of the filamentary gas. Mass inflow and outflow rates will be revisited in a follow-up paper that includes a more thorough analysis of the emission lines in Mrk 509.
With limited observations available for Mrk 509, further study of this nearby AGN will improve our understanding of the feeding process in Seyfert galaxies and other AGN. One question that can be addressed in the near future is whether the starburst ring surrounding the AGN is connected to the merger event. Based on mid-IR lines, Mrk 509 has a 42% starburst contribution to [NeII] 12.8m line emission, and a star formation rate of 8 Msun yr-1 (Meléndez et al., 2008). This signifies an ongoing young starburst, the age of which may correspond to the infall time of the companion. Previous numerical simulations of galaxy mergers by Cox et al. (2008) concluded that primary hosts in high mass-ratio mergers, similar to the case observed in Mrk 509, are unlikely to experience increased star formation around their nuclei. As such, it is important to compare the stellar populations in the filament and starburst ring to determine whether or not they are related.
Additional studies could also be performed on the extended filament outside of the NIFS field of view. Do the filament kinematics show signs of deceleration as it passes by the starburst ring? As the filament is decidedly brighter within the ring, as seen in the available HST imaging, this could signify an interaction between the filament and disk sooner than the elbow in the check mark morphology. Determining whether an early interaction takes place would be critical in interpreting the stellar populations, and the connection between the filament and starburst ring.
References
- Awaki et al. (2001) Awaki, H., Terashima, Y., Hayashida, K., & Sakano, M. 2001, PASJ, 53, 647
- Canalizo & Stockton (2001) Canalizo, G., & Stockton, A. 2001, ApJ, 555, 719
- Cox et al. (2008) Cox, T. J., Jonsson, P., Somerville, R. S., Primack, J. R., & Dekel, A. 2008, MNRAS, 384, 386
- Fischer et al. (2013) Fischer, T. C., Crenshaw, D. M., Kraemer, S. B., & Schmitt, H. R. 2013, ApJS, 209, 1
- Fischer et al. (2014) Fischer, T. C., Crenshaw, D. M., Kraemer, S. B., Schmitt, H. R., & Turner, T. J. 2014, ApJ, 785, 25
- Heckman et al. (2004) Heckman, T. M., Kauffmann, G., Brinchmann, J., Charlot, S., Tremonti, C., & White, S. D. M. 2004, ApJ, 613, 109
- Ho (2009) Ho, L. C. 2009, ApJ, 699, 626
- Hopkins et al. (2005) Hopkins, P. F., Hernquist, L., Cox, T. J., Di Matteo, T., Martini, P., Robertson, B., & Springel, V. 2005, ApJ, 630, 705
- Kendall et al. (2003) Kendall, P., Magorrian, J., & Pringle, J. E. 2003, MNRAS, 346, 1078
- Khalatyan et al. (2008) Khalatyan, A., Cattaneo, A., Schramm, M., Gottlöber, S., Steinmetz, M., & Wisotzki, L. 2008, MNRAS, 387, 13
- Koss et al. (2011) Koss, M., Mushotzky, R., Veilleux, S., Winter, L. M., Baumgartner, W., Tueller, J., Gehrels, N., & Valencic, L. 2011, ApJ, 739, 57
- Kraemer et al. (2004) Kraemer, S. B., George, I. M., Crenshaw, D. M., & Gabel, J. R. 2004, ApJ, 607, 794
- Kuzio de Naray et al. (2012) Kuzio de Naray, R., Arsenault, C. A., Spekkens, K., Sellwood, J. A., McDonald, M., Simon, J. D., & Teuben, P. 2012, MNRAS, 427, 2523
- Meléndez et al. (2008) Meléndez, M., Kraemer, S. B., Schmitt, H. R., Crenshaw, D. M., Deo, R. P., Mushotzky, R. F., & Bruhweiler, F. C. 2008, ApJ, 689, 95
- Peterson et al. (2004) Peterson, B. M. et al. 2004, ApJ, 613, 682
- Phillips et al. (1983) Phillips, M. M., Baldwin, J. A., Atwood, B., & Carswell, R. F. 1983, ApJ, 274, 558
- Riffel & Storchi-Bergmann (2011) Riffel, R. A., & Storchi-Bergmann, T. 2011, MNRAS, 417, 2752
- Riffel et al. (2013) Riffel, R. A., Storchi-Bergmann, T., & Winge, C. 2013, MNRAS, 430, 2249
- Scannapieco & Oh (2004) Scannapieco, E., & Oh, S. P. 2004, ApJ, 608, 62
- Schmitt (2001) Schmitt, H. R. 2001, AJ, 122, 2243
- Sellwood & Sánchez (2010) Sellwood, J. A., & Sánchez, R. Z. 2010, MNRAS, 404, 1733
- Sparke & Gallagher (2000) Sparke, L. S., & Gallagher, III, J. S. 2000, Galaxies in the universe : an introduction (Cambridge University Press)
- Spekkens & Sellwood (2007) Spekkens, K., & Sellwood, J. A. 2007, ApJ, 664, 204
 |
 |
 |
 |
 |
 |
 |
 |
 |
 |
 |
 |