Low-Resolution Spectroscopy for the Globular Clusters with Signs of Supernova Enrichment: M22, NGC 1851 and NGC 288
Abstract
There is increasing evidence for the presence of multiple red giant branches (RGBs) in the color-magnitude diagrams of massive globular clusters (GCs). In order to investigate the origin of this split on the RGB, we have performed new narrow-band Ca photometry and low-resolution spectroscopy for M22, NGC 1851, and NGC 288. We find significant differences (more than 4) in calcium abundance from the spectroscopic HK′ index for M22 and NGC 1851. We also find more than 8 differences in CN band strength between the Ca-strong and Ca-weak subpopulations for these GCs. For NGC 288, however, a large difference is detected only in the CN strength. The calcium abundances of RGB stars in this GC are identical to within the errors. This is consistent with the conclusion from our new Ca photometry, where the RGB splits are confirmed in M22 and NGC 1851, but not in NGC 288. We also find interesting differences in CN-CH correlations among these GCs. While CN and CH are anti-correlated in NGC 288, they show positive correlation in M22. NGC 1851, however, shows no difference in CH between the two groups of stars with different CN strengths. We suggest that all of these systematic differences would be best explained by how strongly type II supernovae enrichment has contributed to the chemical evolution of these GCs.
Subject headings:
Galaxy: formation — globular clusters: general — globular clusters: individual (M22, NGC 1851, NGC 288, NGC 6397) — stars: abundances — stars: evolution — techniques: spectroscopic1. INTRODUCTION
Recent studies of stellar populations in globular clusters (GCs) are facing a new paradigm as more and more GCs are observed to have multiple populations. Photometric observations discovered, for many GCs, splits from main sequence (MS) to red giant branch (RGB) on the color-magnitude diagram (CMD) (e.g., Lee et al., 1999; Pancino et al., 2000; Bedin et al., 2004; Anderson et al., 2009; Han et al., 2009; J.-W. Lee et al., 2009a, b; Bellini et al., 2013; Milone et al., 2013; Piotto et al., 2013). These observations are generally interpreted to be due to the differences in light/heavy elements and/or helium abundances between the subpopulations in these GCs (Norris, 2004; Lee et al., 2005; Piotto et al., 2007; Cassisi et al., 2008; Joo & Lee, 2013). High and medium resolution spectroscopic observations have also established that abundance variations in light elements (C, N, O, Na, Mg and Al) are common in most GCs (Gratton et al., 2012a, and references therein). Furthermore, star-to-star variations in heavy elements abundance are discovered in some massive GCs, such as Centauri, M2, M22, M54, NGC 1851, and NGC 2419 (Norris et al., 1996; Da Costa et al., 2009; Carretta et al., 2010a, b, 2011b; Cohen et al., 2010; Johnson & Pilachowski, 2010; Marino et al., 2009, 2011a, 2011b; Mucciarelli et al., 2012; Yong et al., 2014b).
Abundance variations in light elements are suggested to be due to the chemical pollutions and/or enrichments by intermediate-mass asymptotic giant branch (IMAGB) stars (Ventura & D’Antona, 2008), rotating AGB stars (Decressin et al., 2009), and fast-rotating massive stars (FRMSs; Decressin et al. 2007). However, heavy element abundance variations would imply that a later generation of stars was enriched by type II supernovae (SNe; Timmes et al. 1995). This in turn indicates that the GCs were once massive enough to retain SNe ejecta, and may even be the remnant cores of dwarf galaxies. Therefore, searches for these GCs are important as they can provide additional evidence for the Galaxy building blocks predicted in the CDM hierarchical merging paradigm.
In this respect, the narrow-band Ca photometry, which measures the strength of calcium II H & K lines (Anthony-Twarog et al., 1991), can be a powerful probe as it can detect even a small spread in calcium abundance. Indeed, recent Ca photometry performed at Cerro Tololo Inter-American Observatory (CTIO) has successfully detected splits on the RGB in several GCs, including M22, NGC 1851, and NGC 288 (J.-W. Lee et al., 2009a, b; Roh et al., 2011). The caveat in such a narrow-band study, however, is that the adjacent CN lines at 3883 Å can contaminate the measurement if the filter transmission function intrudes into the CN band. In fact, Lee et al. (2013) and Hsyu et al. (2014) reported that this is the case in the Ca filter used by previous investigators at CTIO. Therefore, new photometry employing a new Ca filter, which is carefully designed to avoid this CN contamination, together with follow-up multi-object spectroscopy, are needed to confirm the origin of the split discovered from previous photometric studies. The purpose of this paper is to confirm the presence and origin of multiple RGBs in M22, NGC 1851, and NGC 288 from the new Ca photometry and low-resolution spectroscopy. As a comparison, we have also observed NGC 6397, which shows only a single narrow RGB (J.-W. Lee et al., 2009a).
2. Narrow-Band Ca Photometry
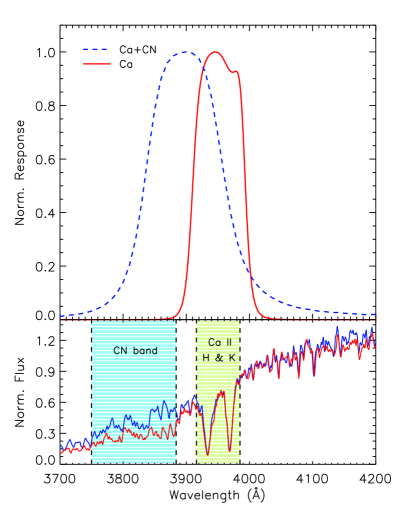
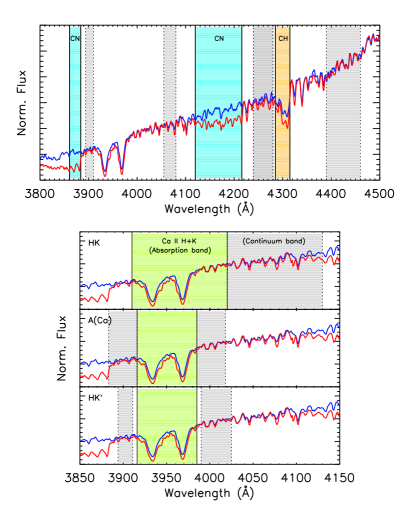
The original Ca filter, as defined by Anthony-Twarog et al. (1991), was centered at 3995 Å to include calcium II H & K lines with a full width half maximum (FWHM) of approximately 90 Å. Its lower limit was designed to avoid contamination by the CN band at 3883 Å. In practice, however, the response function of Ca filter might be deteriorated as a result of ageing. Recently, upon our request, new measurement for the response function of the “old” Ca filter available at CTIO was made by C. Johnson, D. Hölck, & A. Kunder (2012, private communication). As briefly reported in Lee et al. (2013) and Hsyu et al. (2014), it shows that the response function is shifted to short wavelength by 75 Å compared to that known to the community. The origin of this deterioration is not clear, but this underscores the importance of routine inspection of the response function when narrow-band filters are used. Therefore, we have carefully designed and manufactured a “new” Ca filter to avoid the CN contamination. The blue end of the new filter is shifted to the longer wavelength and has a narrower FWHM (84 Å) with steeper blue and red wings than those of the old Ca filter (see Figure 1). Therefore, while the old Ca filter (hereafter Ca+CN filter) available at CTIO was measuring not only calcium II H & K lines but also CN band, the new Ca filter (hereafter Ca filter) is practically measuring only calcium lines.
Our photometry with the new Ca filter on the du Pont 2.5m telescope at Las Campanas Observatory (LCO) was made during the nights from 2011 to 2013. The direct CCD equipped on this telescope provides a field of view (FOV) of 8.85′ 8.85′ and a pixel scale of 0.259″. In order to compare with the data obtained from new Ca filter, we have also reduced the Ca+CN filter data from the CTIO 4m telescope. This photometry employed the same Ca+CN filter originally used by J.-W. Lee et al. (2009a, b) in their pioneering study. The observation log for the program GCs is presented in Table 1. Following the usual manner (see Han et al., 2009; Roh et al., 2011; Lee et al., 2013), the raw data were pre-processed by CCDRED package in IRAF111IRAF is distributed by the National Optical Astronomy Observatory, which is operated by the Association of Universities for Research in Astronomy (AURA) under cooperative agreement with the National Science Foundation.. All data were then reduced using DAOPHOT II/ALLSTAR and ALLFRAME (Stetson, 1987, 1990, 1994). Standard stars in M22, NGC 3680, and NGC 5822 (Anthony-Twarog & Twarog, 2004; J.-W. Lee et al., 2009a; Carraro et al., 2011) were observed to calibrate instrumental magnitudes to the standard system. The astrometric solutions were derived from the reference stars in the USNO-B1 and 2MASS All-Sky Point Source catalogs by running tasks in the IRAF FINDER package.
| Observatory | Object | Date | Exposures (Ns) | ||
|---|---|---|---|---|---|
| LCO | M22 | 2011 Jun 24 – 26 | 315 | 330 | 3150 |
| 390 | 3180 | 3900 | |||
| 2013 Jun 11 – 15 | 360 | 3120 | 3600 | ||
| NGC 1851 | 2011 Feb 13 – 14 | 230 | 260 | 2300 | |
| 3180 | 3360 | 31800 | |||
| 2012 Feb 13 – 17 | 530 | 560 | 5300 | ||
| 5180 | 5360 | 51800 | |||
| 2013 Mar 21 – 23 | 830 | 860 | 8300 | ||
| NGC 288 | 2011 Jun 25 – 27 | 215 | 230 | 2150 | |
| 290 | 2180 | 2900 | |||
| 2013 Jun 15 | 115 | 130 | 1150 | ||
| 190 | 1180 | 1900 | |||
| CTIO | M22 | 2009 Jul 29 – 30 | 220 | 240 | 2240 |
| 1200 | 1400 | 11800 | |||
| NGC 1851 | 2009 Jul 29 | 125 | 150 | 2600 | |
| 1200 | 1400 | 1900 | |||
| NGC 288 | 2009 Jul 28 | 112 | 124 | 1150 | |
| 1120 | 1240 | 11500 | |||
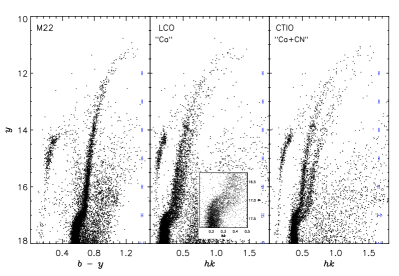
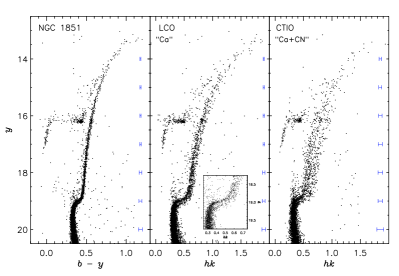
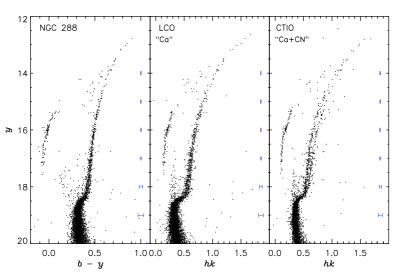
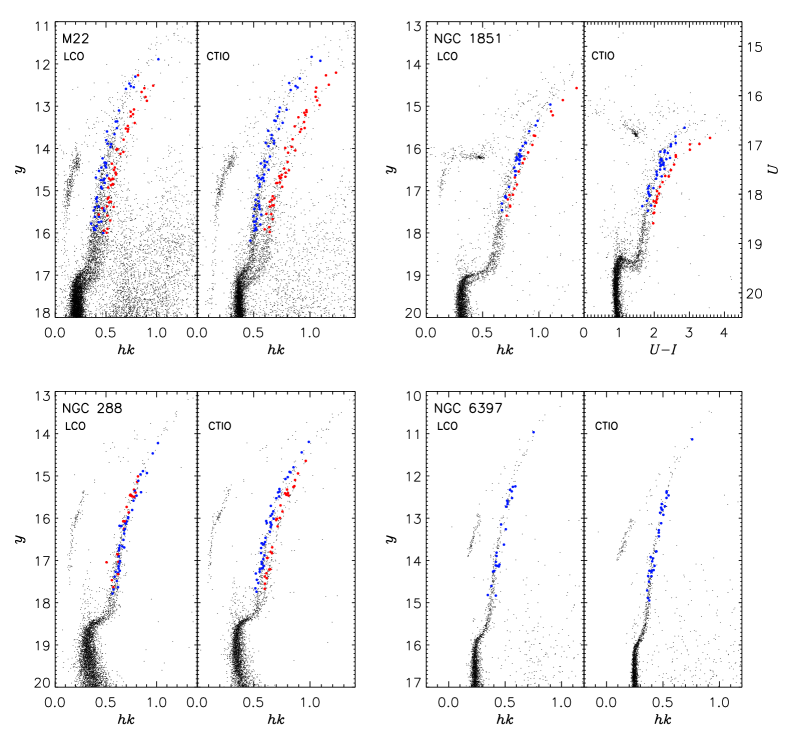
Figures 2–4 shows CMDs for M22, NGC 1851, and NGC 288 in (, ) and (, ) planes obtained with the Ca and Ca+CN filter sets, respectively, where the index, following Anthony-Twarog et al. (1991), is defined as Ca. We used the separation index (Stetson et al., 2003), SHARP, and CHI parameters (i.e., 1.0, 1.5, and SHARP ) to remove stars severely affected by adjacent starlight and non-stellar objects. For M22 and NGC 1851, CMDs obtained from both Ca and Ca+CN filters show two distinct RGBs (see Figures 2 and 3). Note, however, that the separation between the two RGBs from the Ca filter is narrower than that from the Ca+CN filter (0.15 mag versus 0.20 mag for M22; 0.07 mag versus 0.16 mag for NGC 1851). Since cross-matching of common stars between the two data sets indicates no change in the membership of the stars belonging to each subgroup (i.e., bluer and redder RGBs), this difference should be due to the difference in filter response function between the two filters. We also detected the sub giant branch (SGB) split222It is important to note that the calcium abundance difference might have little to do with this split on the SGB. The origin of this split is suggested to be due to the C+N+O variation (Yong et al., 2009, 2014a; Marino et al., 2011b, 2012, 2014; Piotto et al., 2012), age difference (Milone et al., 2008; Carretta et al., 2010b; Gratton et al., 2012b), and/or combined effects of metallicity, helium abundance, and [CNO/Fe] (Joo & Lee, 2013)., reported earlier (Milone et al., 2008; Piotto, 2009; Marino et al., 2009), in our (, ) CMDs for M22 and NGC 1851 (Figures 2 and 3 insets). The number ratios between the brighter and fainter SGB stars (0.59:0.41 for M22; 0.64:0.36 for NGC 1851)333This was done by simple eye count for the stars between 0.25 0.325 for M22 and 0.43 0.525 for NGC 1851. More rigorous analysis can be found in Milone et al. (2009). and that between the bluer and redder RGB stars are roughly identical to the values reported in the literature (Milone et al., 2008; Marino et al., 2009, 2011b; Carretta et al., 2011a; Gratton et al., 2014). Contrary to the cases of M22 and NGC 1851, the RGB split in NGC 288 is not evident in the new Ca photometry. It appears, therefore, that the difference in calcium abundance, once suspected in our previous investigation (Roh et al., 2011), would be negligible in NGC 288. This suggests that the difference in CN abundance was mainly responsible for the RGB split reported in NGC 288 from the old Ca filter (Ca+CN filter) (see also Hsyu et al., 2014). The decrease or disappearance of the separation between the two RGBs from the new Ca filter is consistent with the suspicion that the old photometry was severely affected by CN band. In order to clarify this situation and also to investigate the origin of the RGB splits, we have carried out low-resolution spectroscopy described in the following section.
3. Low-Resolution Spectroscopy
3.1. Observations and Data Reduction
The spectral data were taken from multi-object spectroscopic mode with Wide Field Reimaging CCD Camera (WFCCD) mounted on the du Pont telescope. Figure 5 shows our spectroscopic target stars on the CMDs for M22, NGC 1851, NGC 288, and NGC 6397. Target stars were selected from two distinct subpopulations in the (, ) CMDs using Ca+CN filter, for M22 and NGC 288, and in the (, ) CMD, for NGC 1851, all obtained from CTIO 4m telescope. These filter combinations provide the most clear separation between the two RGBs, and as shown in Figure 5, these sub groupings are almost identical to those obtained from new Ca filter. In our selection of target stars, a similar number of stars were selected from the two subpopulations. Four or five slit masks, each of which was made for stars with similar brightness, were designed using the code. In addition, as a comparison, we made two slit masks for NGC 6397, which shows only a single narrow RGB in all photometry. Typically, each mask includes 25 slits of 1.2″ width with slit length longer than 10″ for obtaining sky spectrum. More than 5 slit boxes of 12″ 12″ were also made for alignment stars. The name of mask and number of containing stars are listed in Table 2.
| Object | Mask | #stars | Exposures (Ns) |
|---|---|---|---|
| M22 | Bright | 24 | 61200 |
| Bright-II | 18 | 51200 | |
| Faint | 27 | 51200 | |
| Faint-II | 21 | 61200 | |
| Faint-III | 25 | 61200 | |
| NGC 288 | Bright | 23 | 41200 |
| Bright-II | 19 | 51200 | |
| Faint | 23 | 41500 | |
| Faint-II | 27 | 31800 | |
| NGC 1851 | Bright | 24 | 51200 |
| Bright-II | 18 | 31500 | |
| Intermediate | 24 | 71500 | |
| Faint | 30 | 31800 |
The observations were carried out during four observing runs of 2011 July 7–13, 2011 September 16–19, 2012 February 19–22, and 2013 June 15–21. The detector was a 4064 4064 WF4K CCD providing a plate scale of 0.484″/pixel and a FOV of 25′ 25′. We used the H&K grism with a dispersion of 0.8 Å/pixel and a central wavelength of 3700 Å. The spectral coverage depends on the location of a slit on the mask, but the calcium II H & K lines, CN and CH bands (3700 Å 4500 Å) are covered for all sample stars. The exposure times varied from 1200 to 1800 seconds, depending on the brightness grouping of stars, and at least three exposures were taken for each mask (see Table 2). In addition, calibration frames, three flats and an arc lamp, were obtained for each mask before/after exposures.
The data reduction was performed with IRAF and the modified WFCCD reduction package, for which the detailed description, including flat fielding, distortion correction, wavelength calibration, and sky subtraction, can be found in Prochaska et al. (2006). Wavelength solution was calculated from the emission lines of He+Ne arc lamp, and cosmic rays were removed by using the task (van Dokkum, 2001). Spectral energy distributions were obtained after subtracting sky spectrum, which was taken from two sky areas far from the target star in the same slit. Note that flux calibration and continuum normalization were not necessary for our analysis, because spectral indices in our low-resolution spectroscopy are defined as the ratio of absorption strength to nearby continuum (Harbeck et al., 2003; Kayser et al., 2008; Pancino et al., 2010). Radial velocities were measured from several strong absorption lines in our wavelength coverage, such as calcium II H & K, and H lines, by using the task in IRAF RV package. These radial velocities were also used to remove non-member stars from the 2.5 sigma-clipping rejection. Signal-to-noise (S/N) ratio was measured at 3900 Å, and low S/N stars (S/N ratio 8) were excluded in our analysis.
| ID | Ra | Dec | HK′ | errHK′ | HK′ | CN | errCN | CN | CH | errCH | CH | ||
|---|---|---|---|---|---|---|---|---|---|---|---|---|---|
| M22-1001 | 279.04150 | -23.88145 | 11.93 | 1.091 | 0.5600 | 0.0066 | 0.0584 | -0.1762 | 0.0108 | -0.3839 | 1.1380 | 0.0046 | -0.0366 |
| M22-1009 | 279.05707 | -23.97182 | 13.08 | 0.792 | 0.4371 | 0.0096 | 0.0042 | -0.0735 | 0.0135 | -0.1540 | 1.0390 | 0.0066 | -0.0807 |
| M22-1025 | 279.07031 | -23.87054 | 12.62 | 0.828 | 0.4150 | 0.0067 | -0.0455 | -0.1409 | 0.0098 | -0.2726 | 1.0427 | 0.0046 | -0.0991 |
| M22-2001 | 279.04425 | -23.94319 | 13.09 | 0.967 | 0.4415 | 0.0117 | 0.0093 | 0.2320 | 0.0134 | 0.1527 | 1.2347 | 0.0072 | 0.1155 |
| M22-2002 | 279.04752 | -23.92560 | 13.54 | 0.922 | 0.4481 | 0.0105 | 0.0426 | 0.3652 | 0.0111 | 0.3354 | 1.1556 | 0.0068 | 0.0577 |
| M22-2003 | 279.05527 | -23.92344 | 13.48 | 0.864 | 0.4021 | 0.0111 | -0.0074 | 0.1730 | 0.0129 | 0.1358 | 1.1686 | 0.0069 | 0.0676 |
| … | … | … | … | … | … | … | … | … | … | … | … | … | … |
| N288-1001 | 13.20749 | -26.61549 | 14.19 | 0.989 | 0.5713 | 0.0125 | 0.0413 | -0.0326 | 0.0187 | -0.0529 | 1.2075 | 0.0085 | 0.0467 |
| N288-1003 | 13.22497 | -26.57806 | 14.44 | 0.926 | 0.5245 | 0.0139 | 0.0089 | -0.1092 | 0.0213 | -0.1062 | 1.1466 | 0.0096 | -0.0045 |
| N288-1006 | 13.14758 | -26.62872 | 14.80 | 0.853 | 0.4983 | 0.0155 | 0.0032 | -0.1993 | 0.0248 | -0.1632 | 1.1506 | 0.0104 | 0.0132 |
| N288-2001 | 13.30425 | -26.61799 | 14.64 | 0.962 | 0.5212 | 0.0144 | 0.0173 | 0.2212 | 0.0175 | 0.2430 | 1.0789 | 0.0102 | -0.0645 |
| N288-2002 | 13.16385 | -26.63292 | 14.94 | 0.893 | 0.4927 | 0.0156 | 0.0061 | 0.1788 | 0.0192 | 0.2285 | 1.0886 | 0.0108 | -0.0432 |
| N288-2003 | 13.27368 | -26.57371 | 15.10 | 0.867 | 0.4858 | 0.0163 | 0.0083 | 0.2131 | 0.0195 | 0.2773 | 1.0930 | 0.0112 | -0.0327 |
| … | … | … | … | … | … | … | … | … | … | … | … | … | … |
| ID | Ra | Dec | - | HK′ | errHK′ | HK′ | CN | errCN | CN | CH | errCH | CH | |
|---|---|---|---|---|---|---|---|---|---|---|---|---|---|
| N1851-1002 | 78.43302 | -40.02103 | 15.96 | 2.346 | 0.5148 | 0.0205 | 0.0166 | 0.1137 | 0.0267 | 0.0189 | 1.0230 | 0.0150 | -0.0718 |
| N1851-1003 | 78.45161 | -40.05419 | 15.42 | 2.613 | 0.5143 | 0.0194 | -0.0270 | 0.0708 | 0.0260 | -0.1026 | 1.1362 | 0.0133 | 0.0174 |
| N1851-1005 | 78.46117 | -40.11313 | 16.16 | 2.264 | 0.4570 | 0.0214 | -0.0252 | 0.0240 | 0.0286 | -0.0417 | 1.0800 | 0.0146 | -0.0059 |
| N1851-2001 | 78.44778 | -40.06932 | 16.04 | 2.474 | 0.5204 | 0.0215 | 0.0291 | 0.3157 | 0.0245 | 0.2334 | 1.1026 | 0.0151 | 0.0116 |
| N1851-2002 | 78.45982 | -40.03528 | 14.82 | 3.289 | 0.6185 | 0.0193 | 0.0284 | 0.6024 | 0.0196 | 0.3399 | 1.2042 | 0.0136 | 0.0583 |
| N1851-2005 | 78.47660 | -40.03832 | 15.66 | 2.617 | 0.5615 | 0.0205 | 0.0396 | 0.3878 | 0.0229 | 0.2497 | 1.0795 | 0.0149 | -0.0285 |
| … | … | … | … | … | … | … | … | … | … | … | … | … | … |
3.2. Definition of Spectral Indices
Since the calcium II H & K lines are one of the strongest absorption lines in stellar spectrum, several index definitions are available in the literature for these lines. The most widely used indices are HK index defined by Suntzeff (1980), and A(Ca) index defined by Norris & Freeman (1982). However, we found that the wavelength range of absorption band adapted in HK index is too broad to detect a subtle difference in calcium abundance, whereas A(Ca) index can be more influenced by CN band as the blue side of the continuum is too close to that band. Therefore, we defined a new calcium index (HK′), which is analogous to A(Ca) index except the width of blue side continuum band. The definition of this index is
where , for example, is the integrated flux from 3916 to 3985 Å. In lower panel of Figure 6, our new index is compared with other indices. The final HK′ index for target star was obtained by taking error-weighted mean of indices measured from each exposure, where the measurement error was estimated assuming Poisson statistics in the flux measurements (Vollmann & Eversberg, 2006).
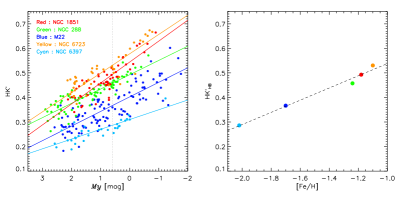
As well known, spectral indices are affected not only by chemical abundance but also by effective temperature () and surface gravity (). Therefore, in order to measure the index difference only from the abundance effect, we used HK′ index, at fixed temperature and gravity, as employed by previous studies (Norris et al., 1981; Norris & Freeman, 1983; Harbeck et al., 2003). The HK′ index was calculated as the difference between HK′ index for each star and the least-square fitting line, obtained from the full sample in a GC on the HK′ versus magnitude diagram. Furthermore, we derived the relation, HK′0.790.25[Fe/H], to convert our result from HK′ index to [Fe/H] from our sample GCs (see Figure 7).
Similarly to the calcium index, several different definitions of CN and CH indices are given in the literature (Norris & Freeman, 1979; Norris et al., 1981; Cohen, 1999a; Harbeck et al., 2003). In this study, we used the most widely used indices, S3839 and S4142 for CN band strength, and CH(4300) for CH band, as defined by Harbeck et al. (2003). The definitions for these indices are
In general, two CN indices show tight correlation, however, previous studies (Harbeck et al., 2003; Pancino et al., 2010; Lardo et al., 2012) have shown that the S3839 index shows higher sensitivity and smaller error than S4142 index. Therefore, we have used S3839 as a main CN index. Absorption bands adapted in our CN and CH indices are illustrated in Figure 6 (upper panel), and the measured indices and errors are listed in Tables 3 and 4.
4. Differences in HK′ and CN indices between the two subpopulations
4.1. M22
Early spectroscopic observations indicated that M22 shows abundance variations in light elements from CN and CH bands (Cohen, 1981; Pilachowski et al., 1982; Norris & Freeman, 1983; Lehnert et al., 1991; Anthony-Twarog et al., 1995). Some spreads in the abundance of heavy elements, such as calcium and iron, have also been suspected from these studies, and this is confirmed from recent high and intermediate resolution spectroscopy (Marino et al., 2009, 2011b; Da Costa et al., 2009). The narrow-band Ca photometry has reported a clear split between the two subpopulations (J.-W. Lee et al., 2009a), but it was not clear whether this was solely due to the difference in calcium abundance because of the contamination from CN band (see Section 2). Our new Ca photometry, reported in Section 2, has shown that this split is maintained, although the difference in the index is reduced between the two RGBs. In order to investigate the origin of this split, we have compared spectral indices between the two subpopulations.
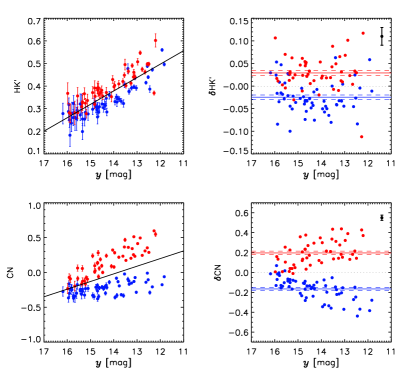
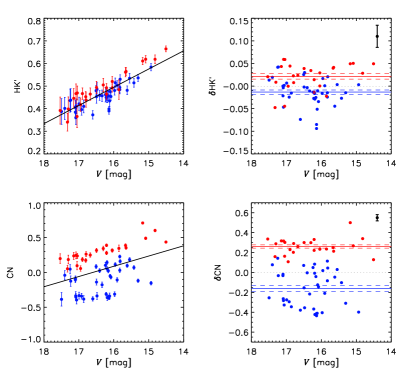
Figure 8 shows measured HK′, HK′, CN, and CN indices for the RGB stars in M22 as functions of magnitude. Note again that even for the RGB stars having same chemical composition, HK′ and CN indices would increase with decreasing magnitude because of the temperature effect (see Section 3.2). Therefore, the differences in chemical abundance between the two subpopulations are measured on the HK′ and CN indices versus magnitude diagrams by taking the mean values for each subpopulation. The upper right panel of Figure 8 clearly shows that the two subpopulations are separated by 0.054 in HK′ index, which is significant at 7.5 level. The fact that stars on the redder RGB show higher HK′ values than those on the bluer RGB suggests that the separation found in our Ca photometry is indeed originated from the difference in calcium abundance. In terms of [Fe/H], this difference in HK′ index is equivalent to 0.18 dex (see Section 3.2). This is similar to the results obtained from high and intermediate resolution spectroscopy (0.15 0.26 dex; Marino et al. 2009, 2011b; Da Costa et al. 2009). Ca-strong stars in our sample also show stronger CN band strength (see the lower right panel of Figure 8). We can also see a clear separation between the two subpopulations in CN index (0.36), which is significant at 15.9 level. This result, based on a lager sample, therefore confirms the presence of CN bimodality reported earlier in this cluster (Norris & Freeman, 1983; Kayser et al., 2008).
4.2. NGC 1851
Since the early detection of CN-strong stars in NGC 1851 (Hesser et al., 1982), recent spectroscopic observations found abundance variations in many light elements from MS to RGB stars in this GC (Yong & Grundahl, 2008; Yong et al., 2009; Pancino et al., 2010; Villanova et al., 2010; Campbell et al., 2012; Lardo et al., 2012). In addition, Carretta et al. (2010b, 2011b) detected the spread in [Fe/H] among RGB stars. Several photometric observations, including our Ca photometry reported in Section 2, also show a clear split in RGB (Calamida et al., 2007; Han et al., 2009; J.-W. Lee et al., 2009b; Carretta et al., 2011a). In order to understand the origin of this split, we have again compared spectral indices between the two subpopulations.
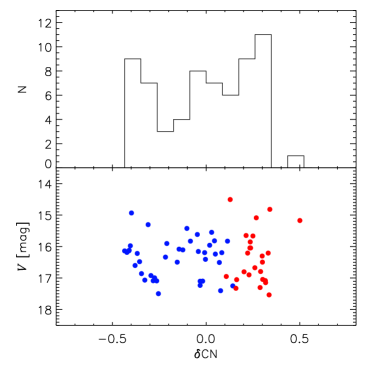
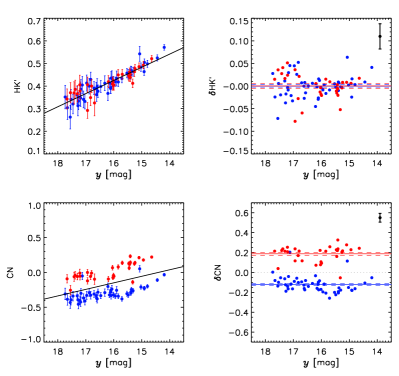
Figure 9 shows distributions of measured spectral indices for stars on the two RGBs in NGC 1851. Similar to the case of M22, these stars are separated in both HK′ and CN indices. The difference between the two subpopulations in HK′ index is 0.035 and that in CN index is 0.42, which are significant at 4.6 and 12.8 levels, respectively. We also estimated the difference in [Fe/H], 0.14 dex, from the difference in HK′ index, which is somewhat larger than the difference obtained from high-resolution spectroscopy (0.06 0.08 dex; Carretta et al. 2010b). Our results for this GC suggest that stars on the two distinct RGBs, divided in both the color and the index, indeed have different calcium abundances. The RGB split in the color is most likely affected by the difference in CN band strength as the wide passband of the filter includes this molecular band, while the split in the index is originated from the difference in calcium abundance. In addition, Figure 10 shows the histogram for CN index, which suggests that RGB stars in NGC 1851 would be divided into three subpopulations. This is mainly because the bluer RGB stars in our Ca photometry are further divided into two subpopulations. This trimodal distribution is comparable with the result by Campbell et al. (2012). The presence of three subpopulations, instead of two, in massive GCs is also suggested from the recent population models (Jang et al., 2014), and the observed Na-O anti-correlation (Carretta et al., 2009b).
4.3. NGC 288 & NGC 6397
As described in Section 2, the RGB split in NGC 288, discovered from the old Ca photometry (Roh et al., 2011), is not confirmed from the new Ca photometry reported in this study. Figure 11 shows a very clear separation in CN index among RGB stars in this GC, while this is not shown in the HK′ index. The difference in CN index between the two subpopulations is 0.31, which is significant at 16.6 level. This result is comparable to the spread in CN reported by Kayser et al. (2008) and Smith & Langland-Shula (2009). The mean HK′ indices of the two subpopulations, however, are almost identical well within the standard error, suggesting that the difference in HK′ index is negligible. This is consistent with the recent result from high-resolution spectroscopy report by Hsyu et al. (2014). Therefore, unlike M22 and NGC 1851, it appears that there is no evidence for the difference in calcium abundance in this GC. This result, together with our new Ca photometry, indicates that the origin of the RGB split reported in old photometry was solely due to the effect of CN band. At the same time, in other respects, this also verifies that our new photometry is not contaminated by CN band.
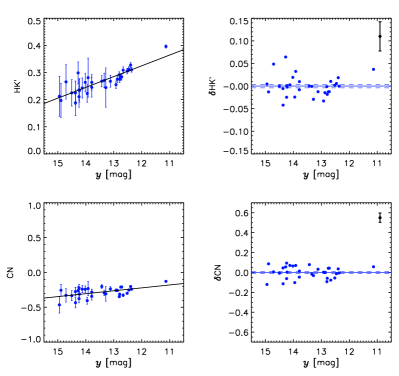
For NGC 6397, which has only single RGB, and therefore stellar population is expected to be more homogeneous, our sample stars indeed show single and narrow distributions in all spectral indices (see Figure 12). The standard deviation of the distribution in HK′ is 0.023, which is similar to that for NGC 288 but smaller than those for M22 and NGC 1851 (0.04). In the case of CN index, standard deviation for this GC (0.062) is also much smaller than those for other GCs (0.18).
5. CN-CH Correlations and Anti-correlations
The CN-CH anti-correlation is one of the most well-known features in GC spectroscopic studies. This feature was reported for many GCs, including M2, M3, M5, M13, M71, NGC 5927, NGC 6352, NGC 6752, Pal 12, and 47 Tuc (Suntzeff & Smith, 1991; Smith et al., 1996; Cannon et al., 1998; Cohen, 1999a, b; Harbeck et al., 2003; Pancino et al., 2010; Smolinski et al., 2011, and references therein). Since CN band strength is mostly affected by nitrogen abundance while CH band is a measure of carbon abundance, the CN-CH anti-correlation would indicate that nitrogen abundance is inversely correlated with carbon abundance (Smith et al., 1996). This chemical disproportion is generally interpreted as a result of evolution mixing (Sweigart & Mengel, 1979; Charbonnel, 1995; Denissenkov & VandenBerg, 2003; J.-W. Lee, 2010) or self-enrichment (Cottrell & Da Costa, 1981; Cannon et al., 1998). While the evolution mixing contributes to the presence of CN-CH anti-correltaion in RGB stars, recent studies favored the self-enrichment scenario over evolution mixing, because this feature is observed even from the un-evolved stage, MS and SGB (Kayser et al., 2008; Pancino et al., 2010), which suggests a primordial difference in chemical composition. Also, the presence of distinct separation between the two groups would be hardly reproduced by the evolution scenario, as this mechanism is more likely to produce just the spread rather than the discrete distribution.
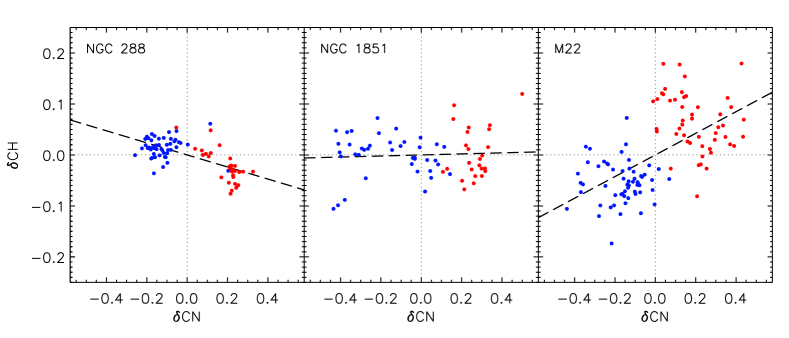
In order to investigate the correlation between CN and CH band strengths in our sample GCs, in Figure 13, we plot CN versus CH of RGB stars in NGC 288, NGC 1851, and M22, respectively. In the case of NGC 288, we can see the anti-correlation between CN and CH (see also Kayser et al., 2008; Smith & Langland-Shula, 2009), which is consistent with the general trend reported in previous studies. NGC 1851, however, shows no apparent relation between CN and CH indices, mostly because the difference in CH index is negligible between the two subpopulations. This result is consistent with earlier findings from MS and SGB stars in this GC (Pancino et al., 2010; Lardo et al., 2012). On the other hand, M22 apparently shows a positive correlation between CN and CH. The correlation similar to this was reported by Norris & Freeman (1983) and Anthony-Twarog et al. (1995) from their sample of RGB stars. This was not detected, however, by Kayser et al. (2008) and Pancino et al. (2010) from their sample of MS and SGB stars, although the insufficient S/N ratio and the effect of differential reddening have prevented them to reach a firm conclusion. Careful examination of the redder RGB subpopulation (red circle) in Figure 13 indicates, however, a sign of anti-correlation between CN and CH. This suggests that the apparent correlation has probably arisen because of the mixture of the two distinct subpopulations having different metal abundance (see below), each of which has CN-CH anti-correlation. Note also that GCs without CN-CH anti-correlation (NGC 1851 and M22) are those with calcium abundance variations. This also suggests that the absence of CN-CH anti-correlation is probably due to the effect of SNe enrichment, because only this mechanism can increase overall metallicity, including C, N, and heavy elements.
6. Discussion
We have shown that RGB stars in M22 and NGC 1851 are clearly split into two subpopulations in the narrow-band photometry employing the new Ca filter, while this is not observed in NGC 288. From the low-resolution spectroscopy, we have confirmed that these splits in M22 and NGC 1851 are indeed originated from the difference in calcium abundance. This confirms that a part of the RGB split reported by J.-W. Lee et al. (2009a, b) was due to the difference in calcium abundance. In the case of CN band strength, the strong differences between the two subpopulations are found in all three GCs from our spectroscopy. In addition, we found a systematic difference in the CN-CH correlation among these GCs. While the well-known CN-CH anti-correlation is confirmed in NGC 288, RGB stars in NGC 1851 show no correlation between CN and CH. For M22, the trend becomes reversed and we found a positive correlation between the two bands. This systematic difference among three GCs is mainly due to the difference in the strength of CH band.
The origin of the presence of the two distinct subpopulations with different heavy element abundance in some GCs is not yet fully understood. Two scenarios are suggested in the literature, all of which are apparently possible only in dwarf galaxy environment. One is that the later generation stars in these GCs were formed in the metal enriched gas from the earlier generations (hereafter self-enrichment scenario; Timmes et al. 1995, see also Joo & Lee 2013, and references therein). The other is that these GCs formed through the merging of two proto-galactic GCs with slightly different metallicity (hereafter merger scenario; Carretta et al. 2010b, 2011b; Bekki & Yong 2012). The redder RGB stars in M22 and NGC 1851 are enhanced both in heavy and light elements. In the self-enrichment scenario, this would suggest that the redder RGB stars were affected by SNe enrichment, together with the contamination from IMAGB stars, FRMSs, or rotating AGB stars (Decressin et al., 2007, 2009; Ventura & D’Antona, 2008). The positive CN-CH correlation observed in M22 is also naturally explained in this scenario as the SNe enrichment would have increased both nitrogen and carbon abundances. In the case of NGC 1851, the absence of CN-CH correlation is most likely because the enhancement in carbon abundance by SNe was not enough to overcome the depletion of the same element by IMAGB stars or FRMSs. In this scenario, NGC 288 was not affected by SNe, but carbon was only depleted by IMAGB or FRMS. This suggests that the systematic difference in CN and CH correlation among three GCs is caused by how strongly SNe enrichment has contributed to the chemical enrichment in GCs. The origin of this difference probably has something to do with the difference in the initial mass of the system as more enriched gas from SNe would be retained in more massive GCs (see, e.g., Baumgardt et al., 2008).
In the case of the merger scenario, the presence of two subpopulations differing in both heavy and light elements abundances can be intuitively explained by simple merging of two GCs in the proto-dwarf galaxy environment (Carretta et al., 2010b, 2011b; Bekki & Yong, 2012). More metal-rich GCs are, in general, also observed to be enriched in light elements (see, e.g., Carretta et al., 2009a). This would also explain the CN-CH correlation in M22. The multimodal CN distribution in NGC 1851 was interpreted as an evidence of merger scenario as well (Campbell et al., 2012).
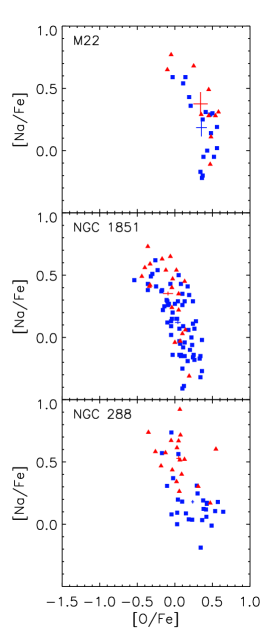
The Na-O anti-correlation among RGB stars, which is well established in most GCs (Carretta et al., 2009a, b; Gratton et al., 2012a, and references therein), can provide a further constraint on these scenarios. According to these observations, the regime occupied by stars on the Na-O plane varies with the metallicity of GC. Therefore, stars in the GCs having similar metallicity are distributed in the similar regime on the Na-O plane. In the merger scenario, since the difference in metallicity between the two subpopulations is small in M22 and NGC 1851, we would expect almost the same distribution on the Na-O plane. In the self-enrichment scenario, on the other hand, the metal rich subpopulation would be placed in the Na rich regime on the Na-O plane, because the metal enriched gas used in the formation of the metal rich later generation stars would have also contaminated by AGB and/or FRMS. Figure 14 shows the Na-O anti-correlations for the RGB stars in two subpopulations in M22 and NGC 1851, where the spectroscopic data were adopted from Marino et al. (2011b) and Carretta et al. (2011b), respectively. For comparison, the case of “normal” GCs enriched by AGB/FRMS, but not by SNe, is illustrated by NGC 288 (bottom panel of Figure 14; data from Carretta et al. 2009b), where the second generation stars are clearly different from the first generation stars in that they are enhanced in [Na/Fe] but depleted in [O/Fe] (see also Carretta et al., 2009b; Piotto et al., 2013). As shown in the middle panel of Figure 14, the metal rich RGB stars in NGC 1851 are preferentially placed in the Na rich regime (see Lardo et al., 2012, for a similar result). The Na abundance of the metal rich group (red triangles) is enhanced by 0.27 dex in [Na/Fe] compared to the metal poor group, which is significant at 13.0 level. For M22 (top panel), however, the metal poor (blue squares) and the metal rich (red triangles) RGB stars show similar distributions on the Na-O plane (see also Marino et al., 2011b). The difference in [Na/Fe] between the two groups is 0.19 dex, which is significant only at 1.6 level. The significant difference in [Na/Fe] between the two subpopulations in NGC 1851 would prefer the self-enrichment scenario over the merger origin. However, for M22, the sample size is too small to reach a firm conclusion from this data set, and therefore, further observations for a larger sample of RGB stars are required.
We will continue our search for GCs originated from dwarf galaxies like Cen, M22 and NGC 1851. Most of these Galaxy building block candidates are expected to be present near the galactic bulge like NGC 6388 and Terzan 5 (Ferraro et al. 2009; Bellini et al. 2013, see also Lee et al. 2007), where the reddening and field star contaminations are severe. In order to overcome these obstacles, we are currently performing both narrow-band Ca photometry and low-resolution multi-object spectroscopy for these GCs. As will be demonstrated in our forthcoming paper, combining these two modes of observation makes it possible to effectively disentangle the effects from differential reddening and metallicity.
References
- Anderson et al. (2009) Anderson, J., Piotto, G., King, I. R., Bedin, L. R., & Guhathakurta, P. 2009, ApJ, 697, L58
- Anthony-Twarog & Twarog (2004) Anthony-Twarog, B. J., & Twarog, B. A. 2004, AJ, 127, 1000
- Anthony-Twarog et al. (1995) Anthony-Twarog, B. J., Twarog, B. A., & Craig, J. 1995, PASP, 107, 32
- Anthony-Twarog et al. (1991) Anthony-Twarog, B. J., Twarog, B. A., Laird, J. B., & Payne, D. 1991, AJ, 101, 1902
- Baumgardt et al. (2008) Baumgardt, H., Kroupa, P., & Parmentier, G. 2008, MNRAS, 384, 1231
- Bedin et al. (2004) Bedin, L. R., Piotto, G., Anderson, J., et al. 2004, ApJ, 605, L125
- Bekki & Yong (2012) Bekki, K., & Yong, D. 2012, MNRAS, 419, 2063
- Bellini et al. (2013) Bellini, A., Piotto, G., Milone, A. P., et al. 2013, ApJ, 765, 32
- Calamida et al. (2007) Calamida, A., Bono, G., Stetson, P. B., et al. 2007, ApJ, 670, 400
- Campbell et al. (2012) Campbell, S. W., Yong, D., Wylie-de Boer, E. C., et al. 2012, ApJ, 761, L2
- Cannon et al. (1998) Cannon, R. D., Croke, B. F. W., Bell, R. A., Hesser, J. E., & Stathakis, R. A. 1998, MNRAS, 298, 601
- Carraro et al. (2011) Carraro, G., Anthony-Twarog, B. J., Costa, E., Jones, B. J., & Twarog, B. A. 2011, AJ, 142, 127
- Carretta et al. (2011a) Carretta, E., Bragaglia, A., Gratton, R., D’Orazi, V., & Lucatello, S. 2011a, A&A, 535, A121
- Carretta et al. (2009a) Carretta, E., Bragaglia, A., Gratton, R., & Lucatello, S. 2009a, A&A, 505, 139
- Carretta et al. (2009b) Carretta, E., Bragaglia, A., Gratton, R. G., et al. 2009b, A&A, 505, 117
- Carretta et al. (2010a) Carretta, E., Bragaglia, A., Gratton, R. G., et al. 2010a, A&A, 520, A95
- Carretta et al. (2010b) Carretta, E., Gratton, R. G., Lucatello, S., et al. 2010b, ApJ, 722, L1
- Carretta et al. (2011b) Carretta, E., Lucatello, S., Gratton, R. G., Bragaglia, A., & D’Orazi, V. 2011b, A&A, 533, A69
- Cassisi et al. (2008) Cassisi, S., Salaris, M., Pietrinferni, A., et al. 2008, ApJ, 672, L115
- Charbonnel (1995) Charbonnel, C. 1995, ApJ, 453, L41
- Cohen (1981) Cohen, J. G. 1981, ApJ, 247, 869
- Cohen (1999a) Cohen, J. G. 1999a, AJ, 117, 2428
- Cohen (1999b) Cohen, J. G. 1999b, AJ, 117, 2434
- Cohen et al. (2010) Cohen, J. G., Kirby, E. N., Simon, J. D., & Geha, M. 2010, ApJ, 725, 288
- Cottrell & Da Costa (1981) Cottrell, P. L., & Da Costa, G. S. 1981, ApJ, 245, L79
- Da Costa et al. (2009) Da Costa, G. S., Held, E. V., Saviane, I., & Gullieuszik, M. 2009, ApJ, 705, 1481
- Decressin et al. (2009) Decressin, T., Charbonnel, C., Siess, L., et al. 2009, A&A, 505, 727
- Decressin et al. (2007) Decressin, T., Meynet, G., Charbonnel, C., Prantzos, N., & Ekström, S. 2007, A&A, 464, 1029
- Denissenkov & VandenBerg (2003) Denissenkov, P. A., & VandenBerg, D. A. 2003, ApJ, 593, 509
- Ferraro et al. (2009) Ferraro, F. R., Dalessandro, E., Mucciarelli, A., et al. 2009, Nature, 462, 483
- Gratton et al. (2012a) Gratton, R. G., Carretta, E., & Bragaglia, A. 2012a, A&A Rev., 20, 50
- Gratton et al. (2012b) Gratton, R. G., Lucatello, S., Carretta, E., et al. 2012b, A&A, 539, AA19
- Gratton et al. (2014) Gratton, R. G., Lucatello, S., Sollima, A., et al. 2014, A&A, 563, A13
- Han et al. (2009) Han, S.-I., Lee, Y.-W., Joo, S.-J., et al. 2009, ApJ, 707, L190
- Harbeck et al. (2003) Harbeck, D., Smith, G. H., & Grebel, E. K. 2003, AJ, 125, 197
- Harris (1996) Harris, W. E. 1996, AJ, 112, 1487
- Hesser et al. (1982) Hesser, J. E., Bell, R. A., Harris, G. L. H., & Cannon, R. D. 1982, AJ, 87, 1470
- Hsyu et al. (2014) Hsyu, T., Johnson, C. I., Lee, Y.-W., & Rich, R. M. 2014, PASP, 126, 597
- Jang et al. (2014) Jang, S., Lee, Y.-W., Joo, S.-J., & Na, C. 2014, MNRAS, 443, L15
- Johnson & Pilachowski (2010) Johnson, C. I., & Pilachowski, C. A. 2010, ApJ, 722, 1373
- Joo & Lee (2013) Joo, S.-J., & Lee, Y.-W. 2013, ApJ, 762, 36
- Kayser et al. (2008) Kayser, A., Hilker, M., Grebel, E. K., & Willemsen, P. G. 2008, A&A, 486, 437
- Lardo et al. (2012) Lardo, C., Milone, A. P., Marino, A. F., et al. 2012, A&A, 541, A141
- J.-W. Lee (2010) Lee, J.-W. 2010, MNRAS, 405, L36
- J.-W. Lee et al. (2009a) Lee, J.-W., Kang, Y.-W., Lee, J., & Lee, Y.-W. 2009a, Nature, 462, 480
- J.-W. Lee et al. (2009b) Lee, J.-W., Lee, J., Kang, Y.-W., et al. 2009b, ApJ, 695, L78
- Lee et al. (2007) Lee, Y.-W., Gim, H. B., & Casetti-Dinescu, D. I. 2007, ApJ, 661, L49
- Lee et al. (2013) Lee, Y.-W., Han, S.-I., Joo, S.-J., et al. 2013, ApJ, 778, L13
- Lee et al. (2005) Lee, Y.-W., Joo, S.-J., Han, S.-I., et al. 2005, ApJ, 621, L57
- Lee et al. (1999) Lee, Y.-W., Joo, J.-M., Sohn, Y.-J., et al. 1999, Nature, 402, 55
- Lehnert et al. (1991) Lehnert, M. D., Bell, R. A., & Cohen, J. G. 1991, ApJ, 367, 514
- Marino et al. (2009) Marino, A. F., Milone, A. P., Piotto, G., et al. 2009, A&A, 505, 1099
- Marino et al. (2011a) Marino, A. F., Milone, A. P., Piotto, G., et al. 2011a, ApJ, 731, 64
- Marino et al. (2012) Marino, A. F., Milone, A. P., Sneden, C., et al. 2012, A&A, 541, AA15
- Marino et al. (2014) Marino, A. F., Milone, A. P., Yong, D., et al. 2014, MNRAS, 442, 3044
- Marino et al. (2011b) Marino, A. F., Sneden, C., Kraft, R. P., et al. 2011b, A&A, 532, A8
- Milone et al. (2008) Milone, A. P., Bedin, L. R., Piotto, G., et al. 2008, ApJ, 673, 241
- Milone et al. (2013) Milone, A. P., Marino, A. F., Piotto, G., et al. 2013, ApJ, 767, 120
- Milone et al. (2009) Milone, A. P., Stetson, P. B., Piotto, G., et al. 2009, A&A, 503, 755
- Mucciarelli et al. (2012) Mucciarelli, A., Bellazzini, M., Ibata, R., et al. 2012, MNRAS, 426, 2889
- Norris (2004) Norris, J. E. 2004, ApJ, 612, L25
- Norris et al. (1981) Norris, J., Cottrell, P. L., Freeman, K. C., & Da Costa, G. S. 1981, ApJ, 244, 205
- Norris & Freeman (1979) Norris, J., & Freeman, K. C. 1979, ApJ, 230, L179
- Norris & Freeman (1982) Norris, J., & Freeman, K. C. 1982, ApJ, 254, 143
- Norris & Freeman (1983) Norris, J., & Freeman, K. C. 1983, ApJ, 266, 130
- Norris et al. (1996) Norris, J. E., Freeman, K. C., & Mighell, K. J. 1996, ApJ, 462, 241
- Pancino et al. (2000) Pancino, E., Ferraro, F. R., Bellazzini, M., Piotto, G., & Zoccali, M. 2000, ApJ, 534, L83
- Pancino et al. (2010) Pancino, E., Rejkuba, M., Zoccali, M., & Carrera, R. 2010, A&A, 524, A44
- Pilachowski et al. (1982) Pilachowski, C., Leep, E. M., Wallerstein, G., & Peterson, R. C. 1982, ApJ, 263, 187
- Piotto (2009) Piotto, G. 2009, IAU Symposium, 258, 233
- Piotto et al. (2007) Piotto, G., Bedin, L. R., Anderson, J., et al. 2007, ApJ, 661, L53
- Piotto et al. (2012) Piotto, G., Milone, A. P., Anderson, J., et al. 2012, ApJ, 760, 39
- Piotto et al. (2013) Piotto, G., Milone, A. P., Marino, A. F., et al. 2013, ApJ, 775, 15
- Prochaska et al. (2006) Prochaska, J. X., Weiner, B. J., Chen, H.-W., & Mulchaey, J. S. 2006, ApJ, 643, 680
- Roh et al. (2011) Roh, D.-G., Lee, Y.-W., Joo, S.-J., et al. 2011, ApJ, 733, L45
- Smith & Langland-Shula (2009) Smith, G. H., & Langland-Shula, L. E. 2009, PASP, 121, 1054
- Smith et al. (1996) Smith, G. H., Shetrone, M. D., Bell, R. A., Churchill, C. W., & Briley, M. M. 1996, AJ, 112, 1511
- Smolinski et al. (2011) Smolinski, J. P., Martell, S. L., Beers, T. C., & Lee, Y. S. 2011, AJ, 142, 126
- Stetson (1987) Stetson, P. B. 1987, PASP, 99, 191
- Stetson (1990) Stetson, P. B. 1990, PASP, 102, 932
- Stetson (1994) Stetson, P. B. 1994, PASP, 106, 250
- Stetson et al. (2003) Stetson, P. B., Bruntt, H., & Grundahl, F. 2003, PASP, 115, 413
- Suntzeff (1980) Suntzeff, N. B. 1980, AJ, 85, 408
- Suntzeff & Smith (1991) Suntzeff, N. B., & Smith, V. V. 1991, ApJ, 381, 160
- Sweigart & Mengel (1979) Sweigart, A. V., & Mengel, J. G. 1979, ApJ, 229, 624
- Timmes et al. (1995) Timmes, F. X., Woosley, S. E., & Weaver, T. A. 1995, ApJS, 98, 617
- van Dokkum (2001) van Dokkum, P. G. 2001, PASP, 113, 1420
- Ventura & D’Antona (2008) Ventura, P., & D’Antona, F. 2008, MNRAS, 385, 2034
- Villanova et al. (2010) Villanova, S., Geisler, D., & Piotto, G. 2010, ApJ, 722, L18
- Vollmann & Eversberg (2006) Vollmann, K., & Eversberg, T. 2006, Astronomische Nachrichten, 327, 862
- Yong & Grundahl (2008) Yong, D., & Grundahl, F. 2008, ApJ, 672, L29
- Yong et al. (2009) Yong, D., Grundahl, F., D’Antona, F., et al. 2009, ApJ, 695, L62
- Yong et al. (2014a) Yong, D., Grundahl, F., & Norris, J. E. 2014a, arXiv:1411.1474
- Yong et al. (2014b) Yong, D., Roederer, I. U., Grundahl, F., et al. 2014b, MNRAS, 441, 3396