Orbital and physical properties of the Ori Aa,Ab,B triple system
Abstract
We provide a complete characterization of the astrophysical properties of the Ori Aa,Ab,B hierarchical triple system, and an improved set of orbital parameters for the highly eccentric Ori Aa,Ab spectroscopic binary. We compiled a spectroscopic dataset comprising 90 high-resolution spectra covering a total time span of 1963 days. We applied the Lehman-Filhés method for a detailed orbital analysis of the radial velocity curves and performed a combined quantitative spectroscopic analysis of the Ori Aa,Ab,B system by means of the stellar atmosphere code fastwind. We used our own plus other available information on photometry and distance to the system for measuring the radii, luminosities, and spectroscopic masses of the three components. We also inferred evolutionary masses and stellar ages using the Bayesian code bonnsai. The orbital analysis of the new radial velocity curves led to a very accurate orbital solution of the Ori Aa,Ab pair. We provided indirect arguments indicating that Ori B is a fast rotating early-B dwarf. The fastwind+bonnsai analysis showed that the Aa,Ab pair contains the hottest and most massive components of the triple system while Ori B is a bit cooler and less massive. The derived stellar ages of the inner pair are intriguingly younger than the one widely accepted for the Orionis cluster, at 3 1 Ma. The outcome of this study will be of key importance for a precise determination of the distance to the Orionis cluster, the interpretation of the strong X-ray emission detected for Ori Aa,Ab,B, and the investigation of the formation and evolution of multiple massive stellar systems and substellar objects.
1 Introduction
The fourth brightest star in the Orion’s Belt is Ori (catalog ) (Quæ ultimam baltei præcedit ad austrum, 48 Ori, HD 37648). This Trapezium-like system is also the brightest source of the relatively nearby, almost extinction-free, 3 Ma-old Orionis (catalog ) open cluster in the Ori OB1b association, which is widely acknowledged as a cornerstone for the study of the stellar and substellar formation (Garrison, 1967; Wolk, 1996; Béjar et al., 1999; Walter et al., 2008; Caballero, 2008b, 2013). Remarkably, the components in the eponymous Ori stellar system illuminate and shape the celebrated, conspicuous Horsehead Nebula (catalog ) (Pety et al., 2005; Habart et al., 2005; Goicoechea et al., 2006, 2009; Compiègne et al., 2007; Rimmer et al., 2012), and a close photo-eroded pair of a very low-mass star and a brown-dwarf proplyd (van Loon & Oliveira, 2003; Sanz-Forcada et al., 2004; Caballero, 2005; Bouy et al., 2009; Hodapp et al., 2009). Therefore, the amount of high-energy photons injected by the high-mass Ori stars into the intra-cluster medium is not only a compulsory input for testing certain models of low-mass star and brown-dwarf formation (e.g., Whitworth et al., 2007), but also for understanding the astrochemistry in the Horsehead photo-dissociation region (Abergel et al., 2003; Pound et al., 2003; Ward-Thompson et al., 2006; Bowler et al., 2009, and references above).
Currently, we know that there are five stars with spectral types earlier than B3 (i.e., massive stars) in the central arcminute of the cluster, including Ori Aa, Ab, B, D, and E (Caballero, 2014). Contrarily to Ori D, which is a normal B2 V star with large projected rotational velocity ( = 200 km s-1; Simón-Díaz & Herrero, 2014), the other four stars have extensively pulled the attention of the stellar community. In particular, Ori E is a famous helium-rich, magnetically-strong, peculiar, variable star with spectral type B2 Vp (Walborn, 1974; Landstreet & Borra, 1978; Groote & Hunger, 1997; Townsend et al., 2013), while Ori Aa,Ab,B is a very high-mass, hierarchical triple system. It is made of a 0.25 arcsec-wide astrometric binary, ‘Aa,Ab–B’, which has not completed a full revolution yet since its discovery ( = 156.73.0 a – Burnham, 1892; Turner et al., 2008; Caballero, 2008a, 2014), and a spectroscopic binary, ‘Aa–Ab’, in a highly eccentric orbit with a period 400 times smaller than the astrometric period ( = 143.50.5 d – Frost & Adams, 1904; Miczaika, 1950; Bolton, 1974; Morrell & Levato, 1991; Stickland & Lloyd, 2001; Simón-Díaz et al., 2011a).
This paper aims to be a continuation of the study started by Simón-Díaz et al. (2011a, Paper I), who compiled 23 FIES spectra between Nov. 2008 and Apr. 2011, confirmed the presence of a third massive star component in the Ori AB system, and determined for the first time the orbital parameters of the Aa,Ab pair. Here we present the analysis of a much extended dataset comprising a total of 90 high resolution spectra spanning 5 years. Besides the refinement of the orbital parameters determined from a longer and much better sampled radial velocity curve, we perform a quantitative spectroscopic analysis of the combined spectra of Ori Aa,Ab,B. The derived spectroscopic parameters (effective temperatures, gravities, and projected rotational velocities) are complemented with photometric information on the system to provide the complete set of stellar astrophysical parameters, namely radii, luminosities, spectroscopic and evolutionary masses, plus estimates of the stellar ages and number of ionizing photons. The paper, which partially benefits from preliminary results from recent interferometric observations by Schaefer (2013) and Hummel et al. (2013), concludes with a discussion on the global orbital and physical properties of the Ori Aa,Ab,B system, highlighting the importance of the results of our study for the interpretation of the strong X-ray emission of the triple system, a precise determination of the distance to the Orionis cluster, and new observational clues in the investigation of the formation and evolution of stars and brown dwarfs at all mass domains.
2 Observations
After publication of Paper I, we continued gathering high-resolution optical spectra with five different instruments, mainly attached to medium-sized telescopes. Our final sample of 90 spectra covers a total time-span of 1963 days, equivalent to almost 14 orbital periods of the Aa,Ab system. In particular, we could obtain over one third of the spectra near the periastron passages of Sep. 2010, Nov. 2011, Apr. 2012, Oct./Nov. 2013, and Mar. 2014.
- •
-
•
Thirty epochs were obtained with the HERMES spectrograph () at the 1.2 m MERCATOR telescope at El Roque de los Muchachos Observatory, also as part of the IACOB project.
-
•
Eleven epochs were obtained with the CAFÉ spectrograph () at the 2.2 m telescope at Calar Alto Observatory as part of the CAFÉ-BEANS project (Negueruela et al. 2014).
-
•
Six epochs were obtained with the HRS spectrograph () at the 9.2 m Hobby-Eberly Telescope as part of the NoMaDS project (Maíz Apellániz et al., 2012).
-
•
In addition, we included in our dataset four spectra obtained with the FEROS spectrograph () at the 2.2 m telescope at La Silla Observatory as part of the OWN survey (Barbá et al., 2010).
Full descriptions of the various used instruments can be found in Telting et al. (2014, FIES), Raskin et al. (2011, HERMES), Aceituno et al. (2013, CAFÉ), Tull (1998, HRS), and Kaufer et al. (1999, FEROS). The log of the observations is presented in Table Orbital and physical properties of the Ori Aa,Ab,B triple system, while Fig. 1 shows portions of Ori Aa,Ab,B spectra at seven representative epochs. The typical signal-to-noise ratio (S/N) of all the spectra was above 200, which could be reached with exposure times of less than 10 min in all telescopes. In the case of the two HERMES spectra obtained on 2013 Oct. 31 (on the exact date of the closest quadrature to periastron passage), we increased the exposure time to reach a S/N 350.
The FIES, HERMES, and FEROS spectra were reduced using the corresponding available pipelines (FIEStool111http://www.not.iac.es/instruments/fies/fiestool/ FIEStool.html, HermesDRS222http://www.mercator.iac.es/instruments/hermes/ hermesdrs.php, and FEROS-DRS333http://www.eso.org/sci/facilities/lasilla/ instruments/feros/tools/DRS.html, respectively). We used our own pipelines for reducing the CAFÉ and HET spectra. In all cases we used the information provided in the corresponding headers of the fits files to correct the spectra for heliocentric velocity, and our own routines implemented in IDL for continuum normalization.
We also obtained lucky imaging of the Ori Aa, Ab, B system with the AstraLux instrument at the Calar Alto 2.2 m telescope (Hormuth et al., 2008). We used three different filters (Sloan and and a narrow-band filter centered at 9137 Å) at five different epochs (from Jan. 2008 to Sep. 2013; see Table 2). The seeing varied between 0.9 and 1.3 arcsec, but component B was clearly separated from A in the processed data in all cases (Aa and Ab components cannot be separated with lucky imaging). The first epoch was discussed by Maíz Apellániz (2010), where the reader is referred for further details on the data.

3 Analysis and results
3.1 Radial velocity
We followed a similar strategy to that described in Paper I to revisit the orbital parameters of the Aa,Ab system resulting from the analysis of the extended radial velocity curves. In brief, we first used the He i 5875 Å line to determine the radial velocity of the two components. To this aim, we performed a two-parameter cross correlation of the observed spectra with a grid of synthetic spectra built with two rotationally-broadened, radial velocity-shifted, fastwind He i-line profiles. We used =135 and 35 km s-1 for the Aa and Ab components, respectively (Stickland & Lloyd, 2001; Simón-Díaz et al., 2011a). The measured radial velocities, along with their corresponding uncertainties associated to the cross-correlations, are given in Table Orbital and physical properties of the Ori Aa,Ab,B triple system.
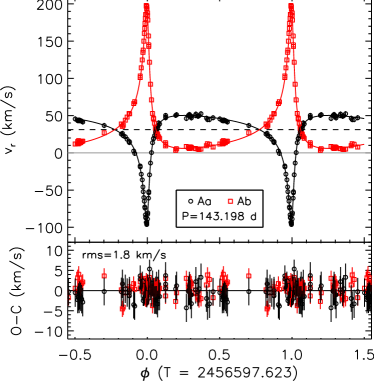
Next, we applied the Lehmann-Filhés method implemented in SBOP444http://mintaka.sdsu.edu/faculty/etzel/ (Etzel 2004) for a detailed orbital analysis of the radial velocity curves. We assumed as initial parameters those values indicated in Table 2 of Paper I. Contrarily to our previous analysis, now we considered the period as a free parameter to be determined by SBOP. The resulting radial velocity curves, phased to the derived period, are shown in Fig. 2, and the revised orbital parameters are provided in Table 1.
The agreement with the solution presented in Paper I is very good (but note the 180-degree indetermination of in Paper I). However, as a consequence of the larger time-span and the better phase coverage (especially around periastron passage) of the new radial velocity curves, we have improved in one order of magnitude the accuracy of all the resulting quantities. In particular, the period has been refined from 143.50.5 d to 143.1980.005 d. The new, more accurate, systemic velocity of the Ori Aa,Ab system (+31.10 0.16 km s-1) is also in very good agreement with the systemic velocity of the cluster as determined by Sacco et al. (2008) from single low-mass stars in Orionis (+30.93 0.92 km s-1). The mass ratio of the two components has increased from 1.23 0.07 to 1.325 0.006. The projected semimajor axes and masses have also been slightly modified.
|
||||||||||||||||||||||||||||||||||||||||||||||
3.2 Photometry
The magnitude of Ori, including the three components, is 3.80 mag (Johnson et al., 1966; Lee, 1968; Vogt, 1976; Ducati et al., 2001). However, the determination of radii, luminosities, and masses of each component in Section 3.4.2 requires the individual absolute magnitudes in the band. Also, this information is of interest for double-checking the dilution factors considered in the combined spectroscopic analysis in Section 3.4.1. For obtaining the extinction-corrected -band absolute magnitudes of the three components we also need information about the magnitude difference between the A,B and Aa,Ab pairs, along with the extinction and distance to the stars.
3.2.1 Magnitude difference between Ori A and B
The difference in magnitude between the A (actually Aa,Ab) and B components has been measured by several authors using different techniques. With Hipparcos data, Perryman et al. (1997) tabulated a magnitude difference = 1.210.05 mag. Using adaptive optics, ten Brummelaar et al. (2000) measured the magnitude difference in three different optical filters ( = 1.240.10, = 1.340.13, and = 1.250.15 mag). Later on, Horch et al. (2001) provided four speckle -band differential photometry measures for Ori A,B ranging from 1.05 to 1.44 mag (and a mean value of 1.180.08 mag). Finally, Horch et al. (2004) obtained again new speckle observations more consistent with previous adaptive optics measurements ( = 1.300.07, = 1.250.03, 1.26 mag).
We measured magnitude differences, angular separations (), and position angles () in our own lucky imaging data (Section 2). The AstraLux images were processed using the strategy described in Maíz Apellániz (2010) but with one important difference: instead of using a two-dimensional Gaussian for the point spread function (PSF) core, we used an obstructed Airy pattern with the parameters of the Calar Alto 2.2 m telescope convolved with a two-dimensional Gaussian. An example of the data and fits is shown in Fig. 3, while Table 2 provides our measurements.
The dispersion of all magnitude differences, from 5030 to 9137 Å, is probably a consequence of the difficulty to characterize the PSF of the images and the proximity of the A and B components (as indicated in Maíz Apellániz, 2010) rather than a colour effect, which is not expected at such early spectral types. We gave more weight to our and Hipparcos measurements and considered = 1.200.05 mag.
| Date | Filter | |||
|---|---|---|---|---|
| (yyyy-mm-dd) | [mas] | [deg] | [mag] | |
| 2008-01-17 | 253.92.0 | 92.90.6 | 1.3190.035 | |
| 2011-09-13 | 254.41.1 | 85.60.3 | 1.1830.019 | |
| 2012-10-02 | 9137 Å | 257.31.3 | 82.60.3 | 1.1950.025 |
| 2012-10-03 | 256.80.9 | 82.60.3 | 1.2010.016 | |
| 2013-09-16 | 252.61.0 | 80.10.4 | 1.1630.016 |
3.2.2 Magnitude difference between Ori Aa and Ab
The case of Ori Aa and Ab is more complex, mainly because the angular separation of these two stars is so small that only interferometric observations provide enough spatial resolution to resolve both components. As a consequence, the few estimations of the Aa,Ab magnitude difference found in the literature come from indirect arguments based on the derived spectral types of the two components, which in many cases were erroneously associated to the A and B components. In particular, from the inspection of one of his high resolution spectrograms showing separated lines, Bolton (1974) indicated that the redshifted component (Ab at +169.6 km s-1) appeared to be 0.5 mag fainter than the blueshifted component (Aa at –88 km s-1). Edwards (1976) derived an independent visual magnitude difference, = 0.78 mag, after following a more quantitative strategy aimed at determining the spectral class of the individual components of visual binaries.
Only recently, interferometric observations with MIRC and NPOI by Schaefer (2013) and Hummel et al. (2013) have been able to provide a direct measurement of the magnitude difference between Aa and Ab. Schaefer (2013) measured a flux ratio between the two components in the near-infrared band of 0.58, which translates into a difference in magnitude of 0.59 mag in , in good agreement with the value proposed by Bolton (1974), but incompatible with the value estimated by Edwards (1976). All in all, we assumed = 0.590.05 mag.
3.2.3 Extinction
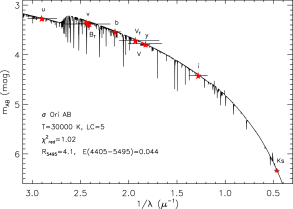
In most published photometry, Ori Aa,Ab,B appears as a single source. We collected from the literature Strömgren , Tycho-2 , Johnson-Cousins , and 2MASS photometry for the system (2MASS and WISE photometry saturated), and processed the data using the latest version of the photometric Bayesian code chorizos (Maíz Apellániz, 2004). It incorporates the Milky Way spectral energy distribution grid of Maíz Apellániz (2013a), the photometric calibration and zero points of Maíz Apellániz (2005a, 2006, 2007), and the family of extinction laws of Maíz Apellániz (2013b) and Maíz Apellániz et al. (2014). We fixed the photometric luminosity class to 5.0 and we left four free parameters: , (amount of extinction), (type of extinction), and . We fitted nine photometric bands, and hence had five degrees of freedom. The resulting values for these four parameters and the best spectral energy distribution are shown in Table 3 and Fig. 4, respectively. The estimated extinction in the band is = 0.180.02 mag.
The chorizos execution yielded a reduced value of 1.0, indicating that the photometry used is consistent and compatible with the used spectral energy distributions and extinction laws. The values of and are compatible with previous results (Lee, 1968; Brown et al., 1994; Mayne & Naylor, 2008). shows a large uncertainty, as expected for an object with such a low extinction. The derived is consistent with a composite source made out of three bright stars, one hotter than 30 kK, the another two cooler than that. Finally, the derived distance ( 263 pc) is considerably lower than other measurements, but this is just an artifact of the fitting and must not be used: since we are measuring the combined photometry of three stars and fixing the luminosity class, the resulting distance is artificially lower than the real one (see below). This problem with spectroscopic parallaxes is common for O-type systems due to the abundance of unresolved binaries.
| Parameter | Value | Unit |
|---|---|---|
| 29.90.6 | kK | |
| 0.0440.007 | mag | |
| 4.10.8 | ||
| 2.4200.017 | ||
| 0.180.02 | mag |
3.2.4 Distance
There have been different determinations of the distance to the Orionis cluster, which have been derived and used in a variety of manners across the literature. In spite of the efforts put by several authors in obtaining an accurate and reliable value, there does not seem to be an acceptable consensus yet, with determinations ranging from 350 to 470 pc. Maíz Apellániz et al. (2004) gave a Lutz-Kelker-corrected value of pc for Ori based on the original Hipparcos measurement (Perryman et al., 1997), but with a self-consistent (and non-constant) spatial distribution for the early-type stars in the solar neighborhood (Lutz & Kelker, 1973; Maíz Apellániz, 2001, 2005b). The new Hipparcos reduction of the raw data by van Leeuwen (2007) did not improve the original measurement.
From average Hipparcos parallax measurements of stars in Ori OB1b, other authors have reported distances of up to 440 pc (Brown et al., 1994; de Zeeuw et al., 1999; Hernández et al., 2005; Caballero & Dinis, 2008). Alternative, non-parallactic determinations of the cluster distance have been mostly based on isochronal fitting. However, perhaps because of the heterogeneity in used data and models, minimisation techniques, spectral types of stars, and subjective authors’ assumptions, derived distances also range on a wide interval from 360 to 47030 pc (Sherry et al., 2004, 2008; Hernández et al., 2005; Caballero, 2007; Mayne & Naylor, 2008; Naylor, 2009).
A classical distance-determination method, the dynamical parallax, was implemented in the cluster by Caballero (2008a), who estimated 385 pc under the assumption that Ori was triple. This estimation matches the recent determinations with the Navy Precision Optical Interferometer (NPOI; Hummel et al., 2013) and the Michigan Infra-Red Combiner for the CHARA Interferometer (MIRC; Schaefer, 2013). From these interferometric data, Hummel et al. (2013) and Schaefer (2013) independently proposed a distance 385 pc. Although optical interferometry will soon provide uncertainties of 1–2 % for the distance to Ori (Schaefer et al., in prep.), we assumed a more conservative error of 5 %, which translates into a heliocentric distance of = 38519 pc.
3.3 The elusive Ori B component
Bolton (1974) was one of the first authors to postulate the presence of a third component in the Ori A,B system (although Frost & Adams, 1904, had done it seven decades earlier). He commented that the velocities and “spectroscopic” magnitude difference shown in one of his spectrograms indicated that none of the spectroscopic components was the component B of the visual system and, furthermore, that there was no evidence of B in his spectrograms. As shown below, our present-day, better quality, observational dataset confirms Bolton’s statements.
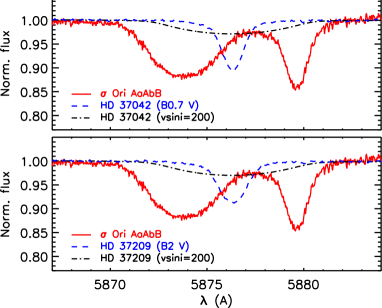
Following the estimations by Hartkopf et al. (1996), component B should not be separated by more than 3 km s-1 from the systemic velocity of the Aa,Ab pair. From the difference in magnitude relative to the Aa,Ab component, the B star should have an spectral type B0–B2 V. Thanks to the large radial velocities reached by Ori Aa and Ab during periastron passage (separated by up to 292 km s-1; see Table 1), it might be possible to find spectroscopic features of the B component around phase zero. However, we did not find any sign of lines from an early B star close to the systemic velocity in any of the spectra obtained during periastron passage. This fact is illustrated by Fig. 5, where we show the spectrum of Ori Aa,Ab,B with maximum separation between the lines of the Aa and Ab components together with high-S/N spectra of two well-investigated early B dwarfs. The only possibility to reconcile photometry (i.e., the celebrated astrometric “binary” announced by Burnham in 1892) and spectroscopy (i.e., the absence of lines at ) is to consider that Ori B has a large rotational velocity, of 200–300 km s-1.
3.4 Stellar parameters of Ori Aa, Ab, and B
3.4.1 Spectroscopic parameters
We used the HERMES spectrum taken on 2013 Oct. 11, the one with the largest separation between the lines of the Aa and Ab components, to perform a combined quantitative spectroscopic analysis of the Ori Aa,Ab,B system. By combined we mean that the stellar parameters of the three components were obtained directly and simultaneously from the analysis of one of the original spectra. This type of analysis can be considered as opposite to the spectral disentangling option, in which the spectrum of each component is obtained and analyzed separately. The combined synthetic spectra to be fitted to the observed one were constructed using spectra from the grid of fastwind models with Solar metallicity (González Hernández et al., 2008; Simón-Díaz, 2010; Nieva & Simón-Díaz, 2011) included in IACOB-GBAT (Simón-Díaz et al., 2011c). The spectra of each component was convolved to the corresponding , shifted in radial velocity, and scaled by a certain factor , where =1. Then, the three synthetic spectra were added together, and the combined spectrum overplotted to the observed one.
We fixed in our analysis the radial and projected rotational velocities of the three components. For components Aa and Ab we considered the values directly measured from the 2013-10-11 spectrum itself (see Table 4), while for component B we initially assumed a = 200 km s-1 and a radial velocity equal to the systemic velocity of the Aa,Ab system (note the difference between the inclination of the rotation axis of each component, as quoted in , and the inclination of the orbit of the Aa,Ab system, as quoted in in Table 1). In view of the results from the spectroscopic analysis by Najarro et al. (2011), we also fixed the associated helium abundances ( = 0.10), microturbulence velocities ( = 5 km s-1), and wind-strength parameters (log = –14.0) for the three stars. Last, we made use of the magnitude differences of previous sections to estimate the dilution factors. In particular, the Aa, Ab, and B components contributed to the global spectrum by 48 %, 28 %, and 24 %, respectively. As a result, only the effective temperatures () and gravities () remained as free parameters to be determined in the analysis.
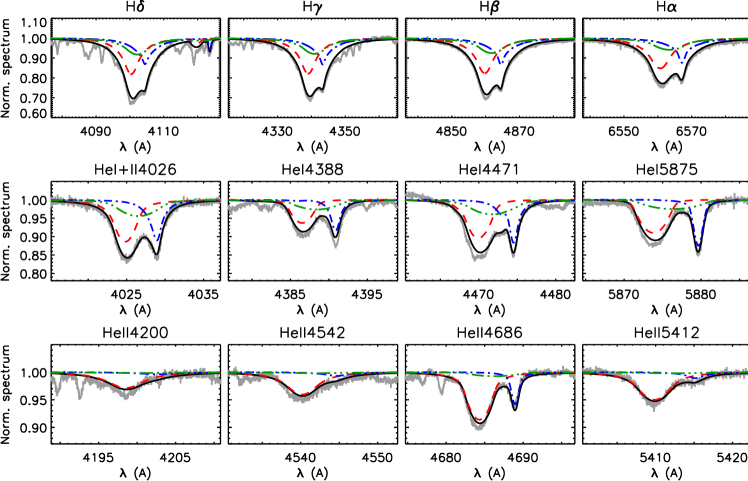
The best-fit solution was obtained by visual comparison of the original and combined synthetic spectra around the H and He i-ii lines, which are commonly assumed as a diagnosis for the determination of stellar parameters of O stars (e.g., Herrero et al., 1992, 2002; Repolust et al., 2004). The fit is illustrated by Fig. 6, which also shows the relative contribution of each component to the global spectrum. Although the contribution of the B component to the combined H and He i lines is very small, the presence of a third component is needed to fit the region between the lines of the Aa and Ab components. On the other hand, the contribution of B to the He ii lines is negligible, as expected from its lower effective temperature and large .
Fig. 6 also illustrates the difficulty to determine precisely the gravity of the three components (from the wings of the hydrogen Balmer lines) and the effective temperature of the elusive B component (mainly constrained by the weak He ii lines). To improve this situation, we followed an iterative strategy that accounted for the comparison of spectroscopic and evolutionary masses (Section 3.4.2). The resulting spectroscopic parameters are summarized in Table 4. The derived and are also complemented with the gravities corrected from centrifugal acceleration (c, computed following the procedure described in Repolust et al., 2004).
3.4.2 Physical parameters
| Parameter | Ori Aa | Ori Ab | Ori B | Unit |
|---|---|---|---|---|
| 4.61 0.02 | 5.20 0.03 | 5.31 0.04 | mag | |
| –3.49 0.11 | –2.90 0.11 | –2.79 0.12 | mag | |
| 135 15 | 35 5 | 250 50 | km s-1 | |
| 35.0 1.0 | 31.0 1.0 | 29.0 2.0 | kK | |
| 4.20 0.15 | 4.20 0.15 | 4.15 0.20 | cm s-2 | |
| c | 4.21 0.15 | 4.20 0.15 | 4.18 0.20 | cm s-2 |
| 5.6 0.3 | 4.8 0.3 | 5.0 0.3 | ||
| 4.62 0.07 | 4.27 0.07 | 4.20 0.13 | ||
| 18 7 | 13 5 | 14 7 | ||
| 20.0 | 14.6 | 13.6 | ||
| Age(b) | 0.3 | 0.9 | 1.9 | Ma |
| 150 | 40 | 270 | km s-1 | |
| 47.92 | 47.03 | 46.34 | s-1 | |
| 46.25 | 44.58 | 43.35 | s-1 |
Once effective temperatures and gravities were determined, we used them, along with the spectral energy distributions of the associated fastwind models and the absolute visual magnitudes computed in Section 3.2, to obtain the radii, luminosities and spectroscopic masses () of the three components. To this aim, we followed the same strategy as described in Herrero et al. (1992). The resulting stellar parameters and associated uncertainties from fastwind are given in Table 4. The errors in , log, and take into account the uncertainties in distance, extinction, effective temperatures, gravities, and individual extinction-corrected -band absolute magnitudes (obtained in turn from the uncertainties in the combined apparent magnitude and magnitude differences between A and B, and Aa and Ab; see Section 3.2).
We then used the Bayesian code bonnsai555http://www.astro.uni-bonn.de/stars/bonnsai (Schneider et al., 2014b) to infer the evolutionary masses () and ages of Ori Aa, Ab, and B. Once some priors are accounted for, bonnsai matches all available observables simultaneously to stellar models and delivers probability distributions of the derive stellar parameters. In our case, we matched the luminosities, surface gravities, effective temperatures, and projected rotational velocities of our three stars to the rotating Milky Way stellar models of Brott et al. (2011). We assumed a Salpeter initial mass function (Salpeter, 1955) as initial mass prior, uniform priors for age and initial rotational velocity, and that all rotation axes are randomly distributed in space. The stellar models reproduced correctly the observables. The determined initial masses, ages and initial rotational velocities are summarized in Table 4 including their uncertainties.
For completeness, we also provide in Table 4 the number of hydrogen (H0) and neutral helium (He0) ionizing photons emitted by Ori Aa, Ab, and B. These quantities can be of future interest for, e.g., the study of the ionization of the Horsehead Nebula (catalog ), the associated photo-dissociation region, and the impact of massive stars on the formation and evolution of low-mass stars, brown dwarfs, stellar discs, Herbig-Haro objects, and possible planetary systems in the Orionis star forming region. In total, the triple system emits 9.61047 H0 and 1.81046 s-1 He0 ionizing photons, enough for shaping virtually all remnant clouds in the Ori OB1b association (Ogura & Sugitani, 1998). However, the ionization budget of the surrounding interstellar medium is mainly dominated by the hottest component only, Ori Aa, which contributes with 87 % (H0) and 98 % (He0) of the total numbers of ionizing photons.
4 Discussion
4.1 Summary of orbital properties of the Ori Aa,Ab,B system
As shown before, the angular separation between Ori Aa,Ab and B lies today at 0.25 arcsec, which translates into a projected physical separation of about 100 au (Caballero, 2014, and references therein). This separation makes the “pair” to be resolvable only with the Hubble Space Telescope and, from the ground, with micrometers, speckle, adaptive optics, or lucky imagers at 1 m-class telescopes.
The last published orbital solution, by Turner et al. (2008), quoted a period = 156.73.0 a, an eccentricity = 0.05150.0080, and an inclination angle = 159.73.7 deg (i.e., the orbit is almost circular and located in the plane of the sky). Our AstraLux astrometric measurements (Table 2), together with many other independent ones obtained after 2008, will certainly help to refine the published orbital solution.
Regarding the Ori Aa,Ab pair, over a century had to elapse since the first suspicion of spectroscopic binarity by Frost & Adams (1904), through the first quantitative measures by Bolton (1974) and Stickland & Lloyd (2001), to the confirmation by Simón-Díaz et al. (2011a). With a projected physical separation between 0.8 and 6.4 mas, the Aa,Ab system can be resolved in imaging only with interferometric observations. After publication of Simón-Díaz et al. (2011a), and during the development of this paper, two different teams have been able to resolve the Aa,Ab pair with interferometric facilities (Hummel et al., 2013; Schaefer, 2013). While they plan to publish a joint analysis (D. Gies; priv. comm.), both groups have already indicated 57 and 56.3 deg, respectively, as first estimates for the inclination orbit of the Aa,Ab system. Our study allows to provide an independent rough estimation of the inclination of the Aa,Ab orbit based on the comparison of our own determinations of the projected dynamical masses and evolutionary masses (see Sections 3 and 4.3). Considering the values of sin and for the Aa and Ab components indicated in Table 4, we obtained = 52.01.2 and 52.91.2 deg, respectively. These values are in relatively good agreement with (but a bit smaller than) the preliminary estimations provided by the combination of spectroscopic and interferometric observations.
All the quoted values of imply that the Ori Aa,Ab system is not eclipsing. We have confirmed this result using Hipparcos photometry: we did not find any indication of possible eclipses, which should occur at phases 0.02 and 0.95 and, by folding the light curve to periods close to 143 days.
In the light of the orbital properties and derived projected rotational velocities of Ori Aa,Ab,B (Table 4), we conclude that the geometry of this young hierarchical triple system is rather complex. On one hand, the close pair revolves in a very eccentric orbit with an inclination 55 deg, while the wide pair does it in an almost circular orbit and with an inclination of 160 deg. Therefore, the triple system is far from being co-planar. On the other hand, the projected rotational velocities of the Aa and Ab components are very different (135 and 35 km s-1, respectively). In absence of direct information about the inclination angle of the rotational axes, we hypothesize that the spins of the two stars are not synchronized and/or the rotational axes are not aligned. A more thorough investigation of the global properties of Ori Aa,Ab,B in the context of the statistical properties, formation, and evolution of multiple stellar systems, as in Tokovinin (2008), is one possible direction of future work.
The good phase coverage of our spectroscopic observations and the great accuracy in the determination of the orbital period of the very eccentric binary Ori Aa,Ab (with an error of 7.2 minutes in 143.2 days) allowed us to identify precisely the future dates of periastron and apoastron passages until 2020. The passage dates shown in Table 5 will certainly ease the investigation of, e.g., absidal motion, circularization, orbital period variation, and, especially, X-ray emission (see below).
4.2 Ori Aa,Ab,B as an X-ray emitter
For years, Ori Aa,Ab,B has been identified as the most luminous and softest X-ray source in the Orionis cluster (Berghoefer & Schmitt, 1994; Sanz-Forcada et al., 2004; Skinner et al., 2008; Caballero et al., 2009, 2010). From a comprehensive analysis of high-resolution Chandra X-ray imaging and spectroscopy of the triple system (none of the Aa,Ab,B components can be resolved by existing X-ray telescopes), Skinner et al. (2008) concluded that the measured X-rays properties of Ori were in good agreement with model predictions for shocks distributed in a radiatively driven stellar wind. However, other possible emission mechanisms that could not be ruled out by that time were a magnetically-confined wind shock in the weak-field limit, and a sub-terminal speed-colliding wind system, under the hypothesis that Ori A had a putative spectroscopic companion, which had not been confirmed yet. With our latest results, the estimated minimum and maximum separations between the Aa and Ab components is 66 and 528 (about 10 and 100 stellar radii), respectively. Although previous investigations of X-ray emission variability have resulted in negative evidences (Sanz-Forcada et al., 2004; Skinner et al., 2008; Caballero et al., 2010), likely due to the relatively long period of 143.2 d and high eccentricity, the colliding wind shock hypothesis, now the most probable scenario, can be tested during future periastron passages with either Chandra or XMM-Newton.
4.3 Stellar masses
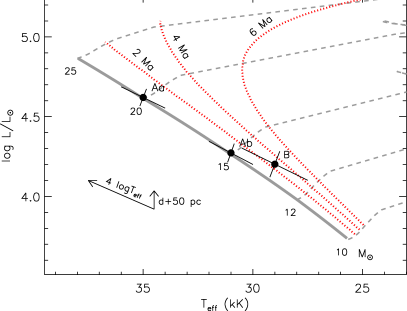
We provided a rigorous determination of the evolutionary masses and ages of the three components with the bonnsai tool in Section 3.4.1. Complementing these estimates, the Hertzsprung-Russell diagram in Fig. 7 allows a quick visual estimation of their evolutionary masses and ages, their associated uncertainties, and how these quantities are modified when the estimated effective temperatures and assumed distance are modified. We derived a total evolutionary mass = 48.2 1.5 , a value that is in good agreement with the total dynamical mass derived by means of the Kepler’s third law assuming the Turner et al. (2008) orbital parameters for the “astrometric” pair and a distance of 385 pc (= 44 7 ). We also found fair matches between the ratios of evolutionary masses (1.370.10) and of dynamical masses (1.3250.006; Table 1) of the Aa and Ab components. Finally, our derived evolutionary masses for the inner pair are systematically larger than the values resulting from the analysis of the interferometric observations ( = 16.7 and = 12.6 ; Hummel et al. 2013; G. Schaefer, priv. comm.). This is a puzzling result since the effective temperatures that would lead to these evolutionary masses (32 and 29 kK, respectively; see Fig. 7) are incompatible with the values indicated by the quantitative spectroscopic analysis (see also notes in Sect. 4.4). A possible solution to this relative mismatch between the evolutionary and dynamical masses could be related to the inclination angle resulting from the combined radial velocity and interferometric analysis. In particular, taking into account the preliminary dynamical masses of Ori Aa and Ori Ab computed by Hummel et al. (2013) and Schaefer (2013), and the total Aa+Ab+B mass indicated above (447 ), the B component would be more massive than the Ab component, while the later is more luminous. Using our evolutionary masses there is a better correspondence between mass and luminosity regarding the three more massive components of Ori. As indicated in Sect. 4.1, an orbit with a slightly smaller inclination would solve this mistmatch between dynamical masses and luminosity.
4.4 Stellar ages
The age of the Orionis cluster has been extensively investigated in the literature, mainly using low-mass stars (e.g., Zapatero Osorio et al., 2002; Sherry et al., 2004, 2008; Caballero, 2007; Mayne & Naylor, 2008). The widely accepted cluster age interval is 2–4 Ma, with extreme values reported at 1.5 and 8 Ma. Our study provides an independent determination of the age of the three most massive stars in the cluster, namely Ori Aa, Ab, and B. The individual stellar ages indicated by bonnsai are 0.3, 0.9, and 1.9 Ma, respectively. In view of these values, once could argue that the derived ages for the three components are in agreement (within the uncertainties) and propose a mean age 1 Ma for the Ori Aa,Ab,B system. This result confirms the youth of the Orionis cluster, but also points towards stellar ages of the most massive members (especially Ori Aa and Ori Ab) which are slightly younger than the commonly accepted cluster age. This later statement is reinforced when one takes into account that the quoted uncertaities in the ages resulting from the bonnsai analysis may be actually considered as upper limits. The bonnsai computations assume that the uncertainties in the three input parameters (, , and ) are independent; however, as illustrated in Fig. 7 there is a strong correlation (linked to basic priciples of stellar astrophysics) between variations in and . These variations follow an inclined line in the HR diagram almost parallel to the ZAMS and the 1–4 Ma isochrones in the 10–20 range. As a consequence the uncertainty in the derived age due to uncertainties related to the effective temperature determination are actually smaller than predicted by bonnsai.
Being aware of the subtlety of the result about the difference between the age derived for Ori Aa, Ab (1 Ma) and the commonly accepted cluster age (2–4 Ma) we also wanted to investigate further whether this non-coevality is a result of an underestimation of the uncertainties in the derived ages or could be used as an observational evidence of an actual physical process linked to the formation or evolution of these stars.
We first discarded it to be a consequence of an incorrrect determination of the stellar parameters (especially effective temperatures), cluster distance, or individual magnitudes. Any of these three possibilities can locate Ori Aa and Ori Ab in a reasonable way on the 2 Ma isochrone. However, an effective temperature lower than 32 kK for Ori Aa would deliver a bad fitting of the He i-ii ionization equilibrium (the same argument applies, to a less extent, to Ori Ab), a further distance, of 430 pc, would translate into an age of about 6 Ma for Ori B, and the magnitude difference between Ori Aa,Ab and B necessary to put the three components simultaneously on the ZAMS is incompatible with observations ( 1.5 mag).
The assumed metallicity and input physics considered in the stellar evolution models could also modify the derived ages. To check the effect of these parameters we compared the location of the tracks and isochrones computed by the Bonn (Brott et al., 2011) and Geneva (Ekström et al., 2012) groups, which assumed a slightly different solar metallicity and core-overshooting parameter. The position of the ZAMS (for the same initial rotational velocity) in Ekström et al. (2012) models is exactly the same as for Brott et al. (2011); on the other hand, the isochrones of a given age in Ekström et al. (2012) computations are closer to the ZAMS compared to Brott et al. (2011) models. As a consequence, Geneva models implied slightly older ages for Ori Aa and Ori Ab; however, these were still less than 1 Ma.
We also explored the possibility that Ori Aa and Ori Ab have suffered from a rejuvenation process by mass accretion (viz. Braun & Langer, 1995; van Bever & Vanbeveren, 1998; Dray & Tout, 2007; Schneider et al., 2014a). As indicated in Sect. 4.1, these two stars with masses 20 and 15 are orbiting in a high eccentric orbit with a period of 143.2 days. The closest separation between the stars in the orbit, at periastron, is 65 (more than a factor ten in stellar radii). This wide separation, together with the small tabulated mass-loss rate (Najarro et al., 2011), makes the occurence of mass transfer episodes (and hence any associated rejuvenation phenomenon) in this system very unlikely.
Are we then facing to an empirical evidence of a star formation process in which massive stars in a stellar cluster are formed slightly after their low-massive counterparts? The formation of massive stars is still an open, highly debated question. Zinnecker & Yorke (2007) reviewed the three main competing concepts of massive star formation, including (a) the monolitic collapse in isolated cores, (b) the competitive accretion in a protocluster environment, and (c) stellar collisions and mergers in very dense clusters. In absence of any other satisfactory solution at this point, we might assume the competitive accretion scenario as a likely explanation for the slightly younger age derived for Ori Aa,Ab compared to cluster age as determined from low-mass stars. Although it must be considered for the moment as a highly speculative statement, its confirmation/refutation (based on a much deeper study including all possible observational information regarding the high- and low-mass content of the Orionis cluster and its viability in terms of spatial and temporal scales) deserves further investigation. In this context, we remark the recent study by Rivilla et al. (2013) in which the authors claims that the scenario that better explain the distribution of pre-main sequence stars in three star formation regions in Orion (the Trapezium cluster, the Orion hot core, and the OMC1-S region) assumes high fragmentation in the parental core, accretion at subcore scales that forms a low-mass stellar cluster, and subsequent competitive accretion.
5 Summary
The almost extinction-free, young Orionis cluster in the Ori OB1b association is a cornerstone region for the study of stellar and substellar formation and the interplay between the strong (far-)UV radiation emitted by massive stars and the surrounding interstellar material. At the very centre of the cluster, the massive Ori A,B system, commonly identified as a close astrometric binary, has been recently confirmed to be a hierarchical triple system. The first two stars ( Ori Aa and Ab) are coupled in a very eccentric orbit with a period 143 d, and both together are orbiting with the third component ( Ori B) in a much wider and longer ( 156.7 a) orbit almost circular.
Aiming at providing a complete characterization of the physical properties of the three components and an improved set of orbital parameters for the highly eccentric Ori Aa,Ab pair we compiled and analyzed a spectroscopic dataset comprising 94 high-resolution spectra (33 of them were obtained near periastron passage of the Aa-Ab system). The complete sample covers a total time-span of almost 14 orbital periods of the Ori Aa,Ab system.
The revised orbital analysis of the radial velocity curves of the Ori Aa,Ab pair led to an improved orbital solution compared to our previous study performed in Simón-Díaz et al. (2011a). The great accuracy reached in the determination of the orbital period (7.2 minutes in 143.198 days) allowed us to provide precise future ephemerides for the system. This can be of particular interest for the investigation of variability of the strong X-ray emission detected for Ori A,B. In addition, the good phase coverage achieved by our observations settle a firm baseline for future investigations of apsidal motion effects, circularization and/or time variation of the orbital period in this young, very eccentric massive stellar system.
We performed a combined quantitative spectroscopic analysis of the Ori Aa,Ab,B system by means of the stellar atmosphere code fastwind. We used own plus other available information about photometry and distance to the system to provide estimates for the radii, luminosities, and spectroscopic masses of the three components. We also infered evolutionary masses and stellar ages using the Bayesian code bonnsai.
Despite the absence of clear spectroscopic features associated to the Ori B component in the combined spectrum, we provided indirect arguments indicating that the faintest star in the traditionally considered astrometric binary is an early-B type dwarf with a projected rotational velocity of at least 200 km s-1.
The fastwind+bonnsai analysis indicated that the Ori Aa,Ab pair contains the hottest
( =35.0 1.0 kK, =31.0 1.0 kK) and most massive
( = 20.0 1.0 , = 14.6 0.7 ) components
of the triple system, while Ori B is a bit cooler and less massive ( =29.0 1.5 kK, = 13.6 0.8 ). The derived stellar age for Ori B
(1.9 Ma) is in relative good agreement with previous determinations of the age of
the Orionis cluster; however, the ages of the spectroscopic pair (0.3 and 0.9, respectively) are intriguingly younger than the commonly accepted cluster age (2–4 Ma).
The outcome of this study, once combined with on-going interferometric and past/future optical and X-ray observations, will be of key importance for a precise determination of the distance to the Orionis cluster, the interpretation of the strong X-ray emission of the Ori Aa,Ab,B system, and the investigation of the formation and evolution of multiple massive stellar stystems and substellar objects.
Based on observations made with the Nordic Optical Telescope, operated by the Nordic Optical Telescope Scientific Association at the Observatorio del Roque de los Muchachos, La Palma, Spain, of the Instituto de Astrofisica de Canarias. Based on observations made with the Mercator Telescope, operated on the island of La Palma by the Flemish Community, at the Spanish Observatorio del Roque de los Muchachos of the Instituto de Astrofísica de Canarias. Based on observations obtained with the HERMES spectrograph, which is supported by the Fund for Scientific Research of Flanders (FWO), Belgium, the Research Council of K.U.Leuven, Belgium, the Fonds National de la Recherche Scientifique (F.R.S.-FNRS), Belgium, the Royal Observatory of Belgium, the Observatoire de Genève, Switzerland and the Thüringer Landessternwarte Tautenburg, Germany. The Hobby-Eberly Telescope (HET) is a joint project of the University of Texas at Austin, the Pennsylvania State University, Stanford University, Ludwig-Maximilians-Universität München, and Georg-August-Universität Göttingen. The HET is named in honor of its principal benefactors, William P. Hobby and Robert E. Eberly. Facilities: NOT, Mercator1.2m, CAO:2.2m, HET, Max Planck:2.2m.
References
- Abergel et al. (2003) Abergel, A., Teyssier, D., Bernard, J. P., et al. 2003, A&A, 410, 577
- Aceituno et al. (2013) Aceituno, J., Sánchez, S. F., Grupp, F., et al. 2013, A&A, 552, A31
- Barbá et al. (2010) Barbá, R. H., Gamen, R., Arias, J. I., et al. 2010, Revista Mexicana de Astronomía y Astrofísica Conference Series, 38, 30
- Béjar et al. (1999) Béjar, V. J. S., Zapatero Osorio, M. R., Rebolo, R. et al. 1999, ApJ, 521, 671
- Berghoefer & Schmitt (1994) Berghoefer, T. W., & Schmitt, J. H. M. M. 1994, A&A, 290, 435
- Bolton (1974) Bolton, C. T. 1974, ApJ, 192, L7
- Bouy et al. (2009) Bouy, H., Huélamo, N., Martín, E. L., et al. 2009, A&A, 493, 931
- Bowler et al. (2009) Bowler, B. P., Waller, W. H., Megeath, S. T., Patten, B. M., & Tamura, M. 2009, AJ, 137, 3685
- Braun & Langer (1995) Braun, H., & Langer, N. 1995, A&A, 297, 483
- Brott et al. (2011) Brott, I., de Mink, S. E., Cantiello, M., et al. 2011, A&A, 530, A115
- Brown et al. (1994) Brown, A. G. A., de Geus, E. J., & de Zeeuw, P. T. 1994, A&A, 289, 101
- Burnham (1892) Burnham, S. W. 1892, AN, 130, 257
- Caballero (2005) Caballero, J. A. 2005, AN, 326, 1007
- Caballero (2007) Caballero, J. A. 2007, A&A, 466, 917
- Caballero (2008a) Caballero, J. A. 2008a, MNRAS, 383, 750
- Caballero (2008b) Caballero, J. A. 2008b, A&A, 487, 667
- Caballero (2013) Caballero, J. A. 2013, The Star Formation Newsletter, 243, 6
- Caballero (2014) Caballero, J. A. 2014, Obs, 134, 273
- Caballero & Dinis (2008) Caballero, J. A., & Dinis, L. 2008, AN, 329, 801
- Caballero et al. (2009) Caballero, J. A., López-Santiago, J., de Castro, E., & Cornide, M. 2009, AJ, 137, 5012
- Caballero et al. (2010) Caballero, J. A., Albacete-Colombo, J. F., & López-Santiago, J. 2010, A&A, 521, A45
- Compiègne et al. (2007) Compiègne, M., Abergel, A., Verstraete, L., et al. 2007, A&A, 471, 205
- de Zeeuw et al. (1999) de Zeeuw, P. T., Hoogerwerf, R., de Bruijne, J. H. J., Brown, A. G. A., & Blaauw, A. 1999, AJ, 117, 354
- Dray & Tout (2007) Dray, L. M., & Tout, C. A. 2007, MNRAS, 376, 61
- Ducati et al. (2001) Ducati, J. R., Bevilacqua, C. M., Rembold, S. B., & Ribeiro, D. 2001, ApJ, 558, 309
- Edwards (1976) Edwards, T. W. 1976, AJ, 81, 245
- Ekström et al. (2012) Ekström, S., Georgy, C., Eggenberger, P., et al. 2012, A&A, 537, A146
- Frost & Adams (1904) Frost, E. B., & Adams, W. S. 1904, ApJ, 19, 151
- Garrison (1967) Garrison, R. F. 1967, PASP, 79, 433
- Goicoechea et al. (2006) Goicoechea, J. R., Pety, J., Gerin, M., et al. 2006, A&A, 456, 565
- Goicoechea et al. (2009) Goicoechea, J. R., Pety, J., Gerin, M., Hily-Blant, P., & Le Bourlot, J. 2009, A&A, 498, 771
- González Hernández et al. (2008) González Hernández, J. I., Caballero, J. A., Rebolo, R., et al. 2008, A&A, 490, 1135
- Groote & Hunger (1997) Groote, D., & Hunger, K. 1997, A&A, 319, 250
- Habart et al. (2005) Habart, E., Abergel, A., Walmsley, C. M., Teyssier, D., & Pety, J. 2005, A&A, 437, 177
- Hartkopf et al. (1996) Hartkopf, W. I., Mason, B. D., & McAlister, H. A. 1996, AJ, 111, 370
- Hernández et al. (2005) Hernández, J., Calvet, N., Hartmann, L., et al. 2005, AJ, 129, 856
- Herrero et al. (1992) Herrero, A., Kudritzki, R. P., Vilchez, J. M., et al. 1992, A&A, 261, 209
- Herrero et al. (2002) Herrero, A., Puls, J., & Najarro, F. 2002, A&A, 396, 949
- Hodapp et al. (2009) Hodapp, K. W., Iserlohe, C., Stecklum, B., & Krabbe, A. 2009, ApJ, 701, L100
- Horch et al. (2001) Horch, E., Ninkov, Z., & Franz, O. G. 2001, AJ, 121, 1583
- Horch et al. (2004) Horch, E. P., Meyer, R. D., & van Altena, W. F. 2004, AJ, 127, 1727
- Hormuth et al. (2008) Hormuth, F., Hippler, S., Brandner, W., Wagner, K., & Henning, T. 2008, Proc. SPIE, 7014,
- Hummel et al. (2013) Hummel, C. A., Zavala, R. T., & Sanborn, J. 2013, Central European Astrophysical Bulletin, 37, 127
- Johnson et al. (1966) Johnson, H. L., Mitchell, R. I., Iriarte, B., & Wisniewski, W. Z. 1966, Communications of the Lunar and Planetary Laboratory, 4, 99
- Kaufer et al. (1999) Kaufer, A., Stahl, O., Tubbesing, S., et al. 1999, The Messenger, 95, 8
- Landstreet & Borra (1978) Landstreet, J. D., & Borra, E. F. 1978, ApJ, 224, L5
- Lee (1968) Lee, T. A. 1968, ApJ, 152, 913
- Lutz & Kelker (1973) Lutz, T. E., & Kelker, D. H. 1973, PASP, 85, 573
- Maíz Apellániz (2001) Maíz-Apellániz, J. 2001, AJ, 121, 2737
- Maíz Apellániz (2004) Maíz-Apellániz, J. 2004, PASP, 116, 859
- Maíz Apellániz (2005a) Maíz-Apellániz, J. 2005a, PASP, 117, 615
- Maíz Apellániz (2005b) Maíz Apellániz, J. 2005b, The Three-Dimensional Universe with Gaia, 576, 179
- Maíz Apellániz (2006) Maíz Apellániz, J. 2006, AJ, 131, 1184
- Maíz Apellániz (2007) Maíz Apellániz, J. 2007, The Future of Photometric, Spectrophotometric and Polarimetric Standardization, 364, 227
- Maíz Apellániz (2010) Maíz Apellániz, J. 2010, A&A, 518, A1
- Maíz Apellániz (2013a) Maíz Apellániz, J. 2013a, Highlights of Spanish Astrophysics VII, 657
- Maíz Apellániz (2013b) Maíz Apellániz, J. 2013b, Highlights of Spanish Astrophysics VII, 583
- Maíz Apellániz et al. (2004) Maíz-Apellániz, J., Walborn, N. R., Galué, H. Á., & Wei, L. H. 2004, ApJS, 151, 103
- Maíz Apellániz et al. (2012) Maíz Apellániz, J., Pellerin, A., Barbá, R. H., et al. 2012, Proceedings of a Scientific Meeting in Honor of Anthony F. J. Moffat, 465, 484
- Maíz Apellániz et al. (2014) Maíz Apellániz, J., Evans, C. J., Barbá, R. H., et al. 2014, A&A, 564, A63
- Mayne & Naylor (2008) Mayne, N. J., & Naylor, T. 2008, MNRAS, 386, 261
- Miczaika (1950) Miczaika, G. R. 1950, ApJ, 111, 443
- Morrell & Levato (1991) Morrell, N., & Levato, H. 1991, ApJS, 75, 965
- Najarro et al. (2011) Najarro, F., Hanson, M. M., & Puls, J. 2011, A&A, 535, A32
- Naylor (2009) Naylor, T. 2009, MNRAS, 399, 432
- Nieva & Simón-Díaz (2011) Nieva, M.-F., & Simón-Díaz, S. 2011, A&A, 532, AA2
- Ogura & Sugitani (1998) Ogura, K., & Sugitani, K. 1998, PASA, 15, 91
- Perryman et al. (1997) Perryman, M. A. C., Lindegren, L., Kovalevsky, J., et al. 1997, A&A, 323, L49
- Pety et al. (2005) Pety, J., Teyssier, D., Fossé, D., et al. 2005, A&A, 435, 885
- Pound et al. (2003) Pound, M. W., Reipurth, B., & Bally, J. 2003, AJ, 125, 2108
- Raskin et al. (2011) Raskin, G., van Winckel, H., Hensberge, H., et al. 2011, A&A, 526, A69
- Repolust et al. (2004) Repolust, T., Puls, J., & Herrero, A. 2004, A&A, 415, 349
- Rimmer et al. (2012) Rimmer, P. B., Herbst, E., Morata, O., & Roueff, E. 2012, A&A, 537, A7
- Rivilla et al. (2013) Rivilla, V. M., Martín-Pintado, J., Jiménez-Serra, I., & Rodríguez-Franco, A. 2013, A&A, 554, A48
- Sacco et al. (2008) Sacco, G. G., Franciosini, E., Randich, S., & Pallavicini, R. 2008, A&A, 488, 167
- Salpeter (1955) Salpeter, E. E. 1955, ApJ, 121, 161
- Sanz-Forcada et al. (2004) Sanz-Forcada, J., Franciosini, E., & Pallavicini, R. 2004, A&A, 421, 715
- Schaefer (2013) Schaefer, G. H. 2013, EAS Publications Series, 64, 181
- Schneider et al. (2014a) Schneider, F. R. N., Izzard, R. G., de Mink, S. E., et al. 2014a, ApJ, 780, 117
- Schneider et al. (2014b) Schneider, F. R. N., Langer, N., de Koter, A., et al. 2014b, A&A, 570, AA66
- Sherry et al. (2004) Sherry, W. H., Walter, F. M., & Wolk, S. J. 2004, AJ, 128, 2316
- Sherry et al. (2008) Sherry, W. H., Walter, F. M., Wolk, S. J., & Adams, N. R. 2008, AJ, 135, 1616
- Simón-Díaz (2010) Simón-Díaz, S. 2010, A&A, 510, AA22
- Simón-Díaz & Herrero (2014) Simón-Díaz, S., & Herrero, A. 2014, A&A, 562, A135
- Simón-Díaz et al. (2011a) Simón-Díaz, S., Caballero, J. A., & Lorenzo, J. 2011a, ApJ, 742, 55
- Simón-Díaz et al. (2011b) Simón-Díaz, S., Castro, N., Garcia, M., Herrero, A., & Markova, N. 2011b, Bulletin de la Societe Royale des Sciences de Liege, 80, 514
- Simón-Díaz et al. (2011c) Simón-Díaz, S., Castro, N., Herrero, A., et al. 2011c, Journal of Physics Conference Series, 328, 012021
- Simón-Díaz et al. (2011d) Simón-Díaz, S., Garcia, M., Herrero, A., Maíz Apellániz, J., & Negueruela, I. 2011d, Stellar Clusters & Associations: A RIA Workshop on Gaia, 255
- Skinner et al. (2008) Skinner, S. L., Sokal, K. R., Cohen, D. H., et al. 2008, ApJ, 683, 796
- Stickland & Lloyd (2001) Stickland, D. J., & Lloyd, C. 2001, The Observatory, 121, 1
- Telting et al. (2014) Telting, J. H., Ávila, G., Buchhave, L., et al. 2014, AN, 335, 41
- ten Brummelaar et al. (2000) ten Brummelaar, T., Mason, B. D., McAlister, H. A., et al. 2000, AJ, 119, 2403
- Tokovinin (2008) Tokovinin, A. 2008, MNRAS, 389, 925
- Townsend et al. (2013) Townsend, R. H. D., Rivinius, T., Rowe, J. F., et al. 2013, ApJ, 769, 33
- Tull (1998) Tull, R. G. 1998, Proc. SPIE, 3355, 387
- Turner et al. (2008) Turner, N. H., ten Brummelaar, T. A., Roberts, L. C., et al. 2008, AJ, 136, 554
- van Leeuwen (2007) van Leeuwen, F. 2007, A&A, 474, 653
- van Loon & Oliveira (2003) van Loon, J. T., & Oliveira, J. M. 2003, A&A, 405, L33
- van Bever & Vanbeveren (1998) van Bever, J., & Vanbeveren, D. 1998, A&A, 334, 21
- Vogt (1976) Vogt, N. 1976, A&A, 53, 9
- Walborn (1974) Walborn, N. R. 1974, ApJ, 191, L95
- Walter et al. (2008) Walter, F. M., Sherry, W. H., Wolk, S. J., Adams, N. R. 2008, Handbook of Star Forming Regions, Volume I: The Northern Sky ASP Monograph Publications, vol. 4. Ed. by Bo Reipurth, p. 732
- Ward-Thompson et al. (2006) Ward-Thompson, D., Nutter, D., Bontemps, S., Whitworth, A., & Attwood, R. 2006, MNRAS, 369, 1201
- Whitworth et al. (2007) Whitworth, A., Bate, M. R., Nordlund, Å., Reipurth, B., & Zinnecker, H. 2007, Protostars and Planets V, 459
- Wolk (1996) Wolk, S. J. 1996, Ph.D. thesis, State University of New York, NY, USA
- Zapatero Osorio et al. (2002) Zapatero Osorio, M. R., Béjar, V. J. S., Pavlenko, Y., et al. 2002, A&A, 384, 937
- Zinnecker & Yorke (2007) Zinnecker, H., & Yorke, H. W. 2007, ARA&A, 45, 481
[x]ccc cc cc l
Radial velocity measurements of Ori Aa and Ab.
Date HJD (Aa) (Aa) (Ab) (Ab) Instrument
(yyyy-mm-dd) (–2450000) [km s-1] [km s-1] [km s-1] [km s-1]
\endfirstheadRadial velocity measurements of Ori Aa and Ab (cont.).
Date HJD (Aa) (Aa) (Ab) (Ab) Instrument
(yyyy-mm-dd) (–2450000) [km s-1] [km s-1] [km s-1] [km s-1]
\endhead
\endfoot2008-11-05 4776.735 0.284 50.1 3.5 –0.2 6.0 1.9 0.3 FIES
2008-11-05 4776.740 0.284 50.2 3.6 –0.1 7.0 1.9 1.4 FIES
2008-11-06 4777.697 0.291 50.4 3.6 0.1 6.2 2.0 0.5 FIES
2008-11-06 4777.699 0.291 50.3 3.6 0.0 6.3 2.0 0.6 FIES
2008-11-06 4777.700 0.291 50.4 3.5 0.1 5.9 1.9 0.2 FIES
2008-11-07 4778.718 0.298 49.1 3.5 –1.1 8.0 1.9 2.2 FIES
2008-11-07 4778.719 0.298 49.3 3.5 –0.9 7.6 2.0 1.8 FIES
2008-11-08 4779.704 0.305 49.1 3.5 –1.0 6.3 2.0 0.4 FIES
2008-11-08 4779.705 0.305 46.9 3.6 –3.2 7.6 1.9 1.7 FIES
2009-05-02 4953.965 0.522 43.9 3.4 –1.5 12.0 1.9 –0.2 FEROS
2009-05-03 4954.963 0.529 43.0 3.4 –2.2 12.8 2.0 0.3 FEROS
2009-11-09 5145.659 0.860 18.2 3.5 –0.5 48.0 1.9 0.5 FIES
2009-11-11 5147.650 0.874 14.4 3.4 –1.2 52.6 1.9 0.9 FIES
2010-09-07 5447.730 0.970 –45.8 1.3 0.5 135.0 1.0 1.3 FIES
2010-09-09 5449.747 0.984 –74.2 1.5 1.2 173.7 1.2 1.5 FIES
2010-10-21 5490.729 0.270 46.1 3.5 –4.3 8.6 1.9 3.0 HERMES
2010-10-23 5493.734 0.291 50.7 3.5 0.4 6.2 2.0 0.5 FIES
2010-10-23 5493.736 0.291 51.5 3.4 1.2 5.8 1.9 0.1 FIES
2011-01-11 5573.509 0.848 21.5 3.5 0.4 43.8 2.0 –0.6 FIES
2011-01-15 5577.505 0.876 13.8 3.4 –1.3 52.6 2.0 0.3 FIES
2011-01-15 5577.509 0.876 15.1 3.4 –0.0 52.6 1.9 0.3 FIES
2011-01-15 5577.512 0.876 14.5 3.5 –0.6 52.7 2.0 0.4 FIES
2011-02-11 5604.367 0.064 34.4 3.5 1.2 28.3 2.0 0.0 FIES
2011-02-13 5606.027 0.075 36.1 3.4 –1.5 21.9 2.0 –0.6 FEROS
2011-02-20 5613.359 0.127 50.3 3.3 3.7 9.3 2.0 –1.3 FIES
2011-03-22 5643.024 0.334 50.0 3.4 0.2 5.8 1.9 –0.5 FEROS
2011-03-27 5648.379 0.371 52.5 3.4 3.3 5.1 1.9 –2.0 FIES
2011-04-08 5660.353 0.455 47.1 3.4 –0.3 7.8 2.0 –1.8 FIES
2011-09-07 5812.724 0.519 43.2 3.3 –2.3 15.2 2.0 3.2 FIES
2011-09-08 5813.743 0.526 43.7 3.3 –1.5 16.4 2.0 4.1 FIES
2011-09-09 5814.717 0.533 43.8 3.5 –1.2 14.4 2.0 1.8 FIES
2011-09-10 5815.726 0.540 43.2 3.5 –1.6 13.6 2.0 0.6 FIES
2011-09-11 5816.748 0.547 42.4 3.5 –2.1 15.1 2.0 1.8 FIES
2011-09-12 5817.758 0.554 41.4 3.5 –2.9 15.8 1.9 2.2 FIES
2011-10-04 5838.961 0.702 36.7 3.4 –0.2 27.0 1.9 3.6 HRS
2011-11-09 5874.575 0.951 –17.6 2.6 3.7 101.1 1.4 0.7 HERMES
2011-11-16 5881.847 0.001 –82.8 1.2 2.9 184.7 1.1 –1.1 HRS
2011-11-18 5883.824 0.015 –29.5 2.3 5.3 121.7 1.2 3.2 HRS
2011-11-22 5887.815 0.043 19.4 3.4 –0.3 46.7 2.0 0.5 HRS
2011-11-24 5889.821 0.057 29.8 3.6 –0.2 33.4 1.9 0.8 HRS
2012-01-03 5929.710 0.336 52.0 3.6 2.2 5.6 1.9 –0.8 HRS
2012-04-05 6023.388 0.990 –86.4 1.8 1.4 185.6 1.0 –3.0 HERMES
2012-04-05 6023.393 0.990 –87.4 2.0 0.5 185.9 1.1 –2.8 HERMES
2012-04-06 6024.329 0.996 –94.3 1.8 –1.1 193.4 1.4 –2.3 HERMES
2012-04-06 6024.333 0.997 –93.1 1.2 0.1 192.9 1.1 –2.8 HERMES
2012-04-06 6024.344 0.997 –95.6 1.4 –2.5 196.4 1.3 0.7 CAFÉ
2012-04-07 6025.314 0.003 –80.7 1.3 –0.5 178.3 1.2 –0.2 CAFÉ
2012-04-08 6026.321 0.010 –52.2 1.6 1.1 142.9 0.9 –0.1 CAFÉ
2012-04-08 6026.326 0.010 –53.6 1.8 –0.4 145.0 0.9 2.2 HERMES
2012-10-26 6226.679 0.410 46.5 3.3 –2.0 9.5 1.9 1.4 HERMES
2012-10-27 6227.659 0.416 44.6 3.5 –3.7 12.2 1.9 3.9 HERMES
2012-10-29 6229.584 0.430 44.7 3.5 –3.3 11.5 1.9 2.8 HERMES
2012-12-23 6285.551 0.821 25.2 3.5 –0.3 38.7 2.0 0.2 FIES
2012-12-24 6286.599 0.828 26.1 3.5 1.7 35.4 2.0 –4.5 FIES
2012-12-25 6287.467 0.834 23.0 3.5 –0.5 37.1 2.0 –4.1 FIES
2013-01-28 6321.409 0.071 36.1 3.5 –0.1 24.4 2.0 0.0 FIES
2013-01-29 6322.470 0.079 40.2 3.5 1.6 21.7 2.0 0.5 FIES
2013-01-30 6323.396 0.085 38.8 3.4 –1.5 19.6 2.0 0.6 FIES
2013-02-05 6329.389 0.127 47.1 3.5 0.5 13.6 1.9 3.0 FIES
2013-02-05 6329.391 0.127 48.2 3.5 1.6 11.4 1.9 0.8 FIES
2013-02-15 6339.330 0.196 50.3 3.4 0.4 3.5 1.9 –2.7 FIES
2013-03-09 6361.470 0.351 49.2 3.5 –0.3 5.1 1.9 –1.5 HERMES
2013-03-09 6361.473 0.351 49.2 3.5 –0.3 5.0 1.9 –1.6 HERMES
2013-03-10 6362.459 0.358 49.9 3.4 0.5 4.5 1.9 –2.3 HERMES
2013-10-25 6590.638 0.951 –18.9 2.6 2.9 103.3 1.3 2.2 HERMES
2013-10-26 6591.627 0.958 –28.7 2.3 0.6 114.2 1.3 3.1 HERMES
2013-10-27 6592.627 0.965 –36.2 2.2 2.5 124.8 1.2 1.3 HERMES
2013-10-28 6593.585 0.972 –52.2 1.3 –2.5 138.0 0.9 –0.2 HERMES
2013-10-29 6594.697 0.980 –65.0 1.4 0.5 160.4 1.0 1.4 HERMES
2013-10-30 6595.768 0.987 –83.3 1.4 –1.1 180.6 1.4 –0.6 HERMES
2013-10-31 6596.596 0.993 –93.4 1.3 –1.5 197.1 1.3 3.0 HERMES
2013-10-31 6596.777 0.994 –93.5 1.4 –0.6 197.9 1.2 2.5 HERMES
2013-11-01 6597.783 0.001 –88.9 1.3 –2.3 188.2 1.1 1.2 HERMES
2013-11-02 6598.787 0.008 –60.9 1.6 1.5 157.0 0.9 2.0 HERMES
2013-11-04 6600.789 0.022 –13.7 2.8 0.5 92.2 1.6 1.1 HERMES
2013-11-05 6601.787 0.029 0.3 3.3 –0.7 71.1 1.9 0.1 HERMES
2013-11-06 6602.797 0.036 13.6 3.2 1.8 52.9 1.9 –3.7 HERMES
2013-11-07 6603.788 0.043 18.9 3.4 –0.7 45.5 1.9 –0.9 HERMES
2013-11-08 6604.798 0.050 23.1 3.4 –2.3 39.8 1.9 1.2 HERMES
2013-11-09 6605.800 0.057 27.6 3.4 –2.3 33.0 1.9 0.3 HERMES
2013-11-10 6606.798 0.064 31.0 3.5 –2.4 28.5 1.9 0.4 HERMES
2013-11-11 6607.777 0.071 32.8 3.3 –3.3 25.5 1.9 1.0 HERMES
2013-11-29 6626.607 0.202 51.2 3.5 1.2 5.5 1.9 –0.5 CAFÉ
2014-01-11 6669.455 0.502 45.5 3.5 –0.5 11.9 1.9 0.6 CAFÉ
2014-03-10 6727.368 0.906 2.4 3.4 –3.5 66.2 1.8 1.7 CAFÉ
2014-03-11 6728.376 0.913 –0.8 3.4 –3.8 68.6 1.9 0.3 CAFÉ
2014-03-20 6737.401 0.976 –60.1 1.8 –2.0 150.0 0.9 0.7 CAFÉ
2014-03-21 6738.308 0.982 –72.7 1.5 –0.8 167.1 1.1 –0.5 CAFÉ
2014-03-22 6739.285 0.989 –87.0 1.5 –0.3 185.7 1.3 –1.4 CAFÉ
2014-03-23 6740.290 0.996 –96.3 1.1 –3.0 194.3 1.4 –1.5 CAFÉ
| Periastron | Apastron | |||
| Date | HJD | Date | HJD | |
| (yyyy-mm-dd) | (–2 450 000) | (yyyy-mm-dd) | (–2 450 000) | |
| 2015-01-04 | 7027.22 0.04 | 2015-03-17 | 7098.82 0.04 | |
| 2015-05-27∗ | 7170.42 0.04 | 2015-08-07∗ | 7242.01 0.04 | |
| 2015-10-18 | 7313.61 0.05 | 2015-12-28 | 7385.21 0.05 | |
| 2016-03-09 | 7456.81 0.05 | 2016-05-19∗ | 7528.41 0.05 | |
| 2016-07-30∗ | 7600.01 0.06 | 2016-10-10 | 7671.61 0.06 | |
| 2016-12-20 | 7743.21 0.06 | 2017-03-02 | 7814.81 0.06 | |
| 2017-05-12∗ | 7886.40 0.07 | 2017-07-23∗ | 7958.00 0.07 | |
| 2017-10-03 | 8029.60 0.07 | 2017-12-13 | 8101.20 0.07 | |
| 2018-02-23 | 8172.80 0.08 | 2018-05-05∗ | 8244.40 0.08 | |
| 2018-07-16∗ | 8316.00 0.08 | 2018-09-26 | 8387.600 0.08 | |
| 2018-12-06 | 8459.20 0.09 | 2019-02-16 | 8530.80 0.09 | |
| 2019-04-28∗ | 8602.40 0.09 | 2019-07-09∗ | 8673.99 0.09 | |
| 2019-09-19 | 8745.59 0.10 | 2019-11-29 | 8817.19 0.10 | |
| 2020-02-09 | 8888.79 0.10 | 2020-04-20∗ | 8960.39 0.10 | |
| 2020-07-01∗ | 9031.99 0.11 | 2020-09-11 | 9103.59 0.11 | |
| 2020-11-21 | 9175.19 0.11 | 2012-02-01 | 9246.79 0.11 | |