Constraining Very High Mass Population III Stars through He II Emission in Galaxy BDF-521 at z = 7.01
Abstract
Numerous theoretical models have long proposed that a strong He II emission line is the most prominent and unique feature of massive Population III (Pop III) stars in high redshift galaxies. The He II line strength can constrain the mass and IMF of Pop III stars. We use F132N narrowband filter on the Hubble Space Telescope’s (HST) Wide Field Camera 3 (WFC3) to look for strong He II emission in the galaxy BDF-521 at , one of the most distant spectroscopically-confirmed galaxies to date. Using deep F132N narrowband imaging, together with our broadband imaging with F125W and F160W filters, we do not detect He II emission from this galaxy, but place a 2 upper limit on the flux of . This measurement corresponds to a 2 upper limit on the Pop III star formation rate (SFRPopIII) of , assuming a Salpeter IMF with . From the high signal-to-noise broadband measurements in F125W and F160W, we fit the UV continuum for BDF-521. The spectral flux density is Å-1, which corresponds to an overall unobscured SFR of 5 M. Our upper limit on SFRPopIII suggests that massive Pop III stars represent % of the total star formation. Further, the HST high resolution imaging suggests that BDF-521 is an extremely compact galaxy, with a half-light radius of kpc.
1 Introduction
The first generation stars, i.e., Population III (Pop III) stars with zero metallicity, form out of primordial material left over from the Big Bang. They are believed to produce a significant amount of energy in the ultraviolet (UV) and to serve as the main sources to re-ionize the inter-galactic medium (IGM). The confirmation and analysis of Pop III stars or Pop III hosting high-redshift galaxies are among the most crucial goals to studies of the origin and evolution of galaxies in the early Universe.
In recent years, a number of galaxy candidates at have been found, mainly due to ambitious near-infrared (NIR) imaging surveys with greater depths and larger fields of view (e.g. Yan et al., 2012; Robertson et al., 2013). With the biggest ground-based telescopes, significant progress has also been made in spectroscopically confirming Ly emission from galaxies at (Iye et al., 2006; Vanzella et al., 2011; Ono et al., 2012; Schenker et al., 2012; Finkelstein et al., 2013). However, the fraction of galaxy candidates at that have Ly emission is still very small, mainly because a rising IGM neutral fraction to suppress the Ly emission (e.g. Caruana et al., 2014; Bolton & Haehnelt, 2013; Fontana et al., 2010). On the other hand, sensitive mm/sub-mm facilities like the Atacama Large Millimeter Array (ALMA) have allowed CO and [CII] to serve as possible tracers of metallicity and to address the optical bias in star formation rate (SFR) measurements for galaxies at (e.g. Ouchi et al., 2013).
Direct detections of Pop III signatures in high redshift galaxies, however, remain a major challenge (e.g. Cai et al., 2011). Theoretical investigations suggest that Pop III stars have a high characteristic mass, and short life spans on the order of a few million years (e.g. Bromm & Yoshida, 2011). Feedback from the first stars will metal-enrich the local primordial interstellar medium (ISM) and quench further Pop III star formation (Yoshida et al., 2004; Muratov et al., 2013). Therefore, Pop III stars should only be dominant in very young galaxies at high redshift. On average, younger galaxies tend to be less massive than more mature systems at given redshift, and thus they are intrinsically fainter in the continuum bands, making the direct detection very challenging with today’s telescopes. Salvaterra et al. (2011) suggest that, at , Pop-III dominated ( of total luminosity) galaxies are extremely faint (), which is below current detection limits.
The He II 1640 line from high redshift galaxies has been long suggested to depend strongly on both the IMF and the stellar metallicity (e.g. Schaerer, 2002). Hard ionizing radiation, particularly photons that ionize Helium, is greatly enhanced by the high surface temperature of Pop III stars. Therefore, the resulting strong recombined He II line is a direct footprint of Pop III stars. Moreover, the He II 1640 line is much less complicated to model and interpret, compared to the Ly recombination line (Schaerer, 2003). Also, He II photons pass more easily through the partially neutral IGM at high redshift than Ly photons (Tumlinson & Shull, 2000). Using the model of Schaerer (2002), one expects to detect strong He II 1640 emission in spectroscopically-comfirmed galaxies if of the SFR is contributed by Pop III stars with a top-heavy IMF.
In the past few years, a few observations have probed Pop III signatures in high-redshift galaxies by looking for strong He II emission (Dawson et al., 2004; Nagao et al., 2005, 2008; Cai et al., 2011). These studies have reported nondetections, constraining the Pop III star formation rate (hereafter SFRPopIII) to less than a few M⊙ yr-1. Note the narrow He II line (FWHM a few hundred km s-1) is one of the Pop III star signatures, which is distinguished from broad He II emission from AGN (Eldridge & Stanway, 2012). The line width measurement through spectroscopy is required to unambiguously confirm the He II from Pop III stars. Cassata et al. (2013) find that 10% of galaxies at with i show He II emission, with rest-frame equivalent widths (EW) Å, and argue that some of the galaxies with narrow He II lines are compatible with the predictions of a Pop III scenario. However, the EWs of these He II emission lines are not exceptionally high compared with those from some other astrophysical objects, so the He II emission also might be interpreted as metal-poor nebular He II emission.
More metal-poor galactic environments could be expected at higher redshifts. It is thus important to search for secure Pop III signatures in the highest redshift galaxies. At z 7, the He II line is redshifted into the J-band. Strong near-infrared sky lines make it challenging to conduct ground-based deep observations. The Wide Field Camera 3 (WFC3) on HST has a high throughput, and does not suffer a strong IR background from the atmosphere. Therefore, it is the ideal tool for studying rest-frame ultraviolet spectral features for galaxies at .
BDF-521 is one of the faintest spectroscopically-confirmed galaxies at (Vanzella et al., 2011). Moderate S/N ground-based observations suggest that it could have the bluest UV slope (Vanzella et al. 2011). These results suggest that BDF-521 is among the youngest galaxies with low metallicity at . He II for this galaxy lies within the WFC3/F132N narrowband filter. In this paper, we report a non-detection of the He II emission in this galaxy, which enables us to put the most stringent upper limit to date on massive Pop-III star formation in galaxies at the end of reionization epoch. In addition, with the HST broadband imaging, we measure the UV continuum level, UV slope, and galaxy morphology. This paper is organized as follows: In §2, we discuss our observing strategies and data reduction. In §3, we provide the upper limit of He II line flux, the measurements of UV continuum level, slope, and galaxy morphology. In §4, we discuss the implications of our results on the formation of Pop III stars. Throughout this paper, we adopt a conventional cosmology: = 0.7, = 0.3, and H0 = 70 km s-1 Mpc-1.
2 HST Observations of Galaxy BDF-521 and Data Reduction
The galaxy BDF-521 is spectroscopically-confirmed by Vanzella et al. (2011) to be at . This galaxy is selected from the imaging survey obtained with VLT/Hawk-I (Castellano et al., 2010). Spectroscopy shows a clear, asymmetric Ly emission line with a total luminosity of erg s-1, corresponding to an overall SFRLyα of M⊙ yr-1 (uncorrected for Gunn-Peterson absorption, which reduces Ly flux). At this redshift, He II falls at 13133Å, fully in the sensitive part of the WFC3/IR F132N narrowband filter ( Å and FWHM Å), allowing us to use HST narrowband imaging to search for HeII emission. 11 orbits ( a 30,800 sec of integration) are allocated in F132N to probe the He II emission. A 4-orbit integration were allocated to measure the continuum through the F125W and F160W filters, with 2 orbits for each broadband filter. The broadband imaging is used to perform an accurate continuum subtraction in the narrowband, as well as to measure the unobscured SFR and galaxy morphology. Our observations are designed to detect He II emission at the level if of the star formation in the galaxy is contributed by Pop III stars with a Salpeter IMF with 50 M/M⊙ 500.
The entire set of observations consists of four visits. The F132N narrowband imaging is separated into three individual visits. The first and second visits both contain four orbits. The third visit contains three orbits. Each orbit is slightly dithered relative to previous orbit. The dithering offset between each orbit is determined by standard WFC3/IR 4-point dither sequence. We conduct the broadband imaging in the fourth visit. In this visit, both the F125W and F160W observations contain two orbits, with each orbit divided into a 4-point dither sequence. This broadband observational design is the same with that in Cai et al. (2011).
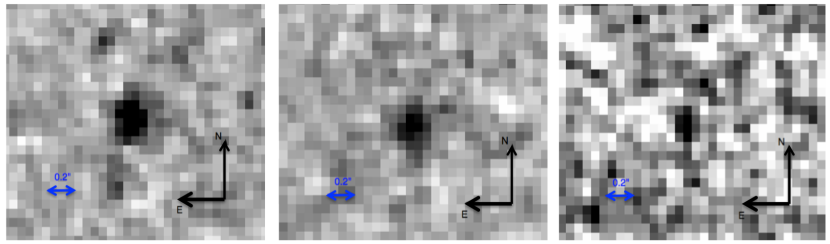
All the science images were reduced by the WFC3/IR Multidrizzle pipelines (Koekemoer et al., 2002). In each filter, the images were combined with an output scale = 0.06′′, 0.48 of the linear size of the original pixel size. We simultaneously shrink the area of the input pixels by adjusting the pixfrac parameter to 0.7 (also see Cai et al. 2011). High resolution images from the F132N, F125W, and F160W bands are shown in Figure 1.
3 Galaxy Properties and Upper Limit of He II Flux
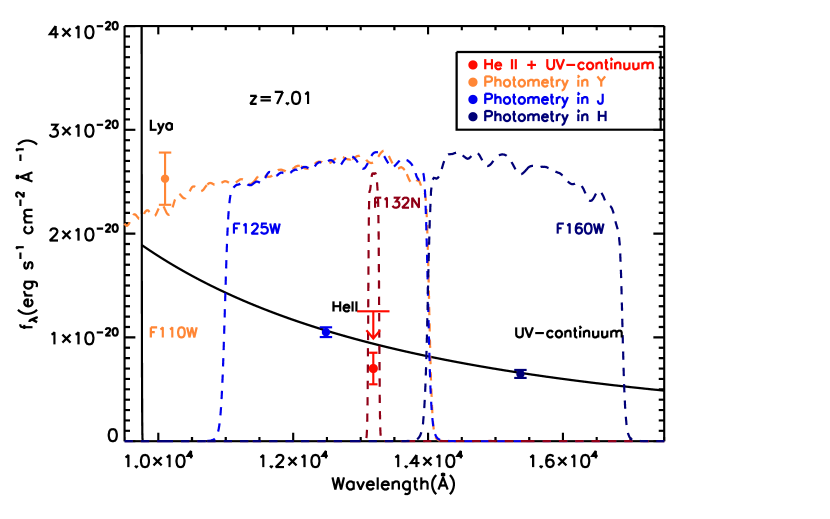
Following the method described in Cai et al. (2011), we perform the photometry using SExtractor (Bertin & Arnouts, 1996) using the root mean square map generated by Multidrizzle (Cai et al., 2011). The photometry is measured for BDF-521 in all three filters (F125W, F160W, and F132N) using a circular aperture with a diameter of 0.45”. The aperture is determined by the F132N image ( half-light radius). BDF-521 has an absolute magnitude , comparable to . The photometry results are listed in Table 1. A standard power-law continuum is assumed with , where A is a constant. The spectral energy distribution (SED) is then fitted by the power-law continuum based on broadband photometry in F125W and F160W (Figure 2). We find
| (1) |
After subtracting the continuum contribution in the narrowband image, we obtain the line flux of He II ():
| (2) |
i.e., a non-detection. 2- upper limit of He II flux is ergs s-1 cm-2, which is the most stringent constraint to date for galaxies.
At , this corresponds to a total HeII luminosity of , or a non-detection 2 upper limit of . Because of the low background and high sensitivity of our HST/WFC3 observations, this 2 upper limit is one order of magnitude deeper than the groundbased result in Nagao et al. (2005) for galaxies at .
Using the HST and band photometry, we show that BDF-521 has a blue rest-frame UV continuum, with a spectral slope (Eq. 1). Early results from the HUDF09 team suggested that the high-redshift galaxy candidates at have extremely blue UV slopes of for galaxies (Bouwens et al., 2010; Oesch et al., 2010). The UDF12 campaign provided significantly deeper F160W imaging data for the spectral slope determination at redshifts , added F140W imaging data to reduce potential observational biases (Robertson et al. 2013). This work measures the spectral slope of for galaxies with luminosities of -20 MUV -19 at . BDF-521 has an absolute magnitude , corresponding to , and comparable with bright galaxy candidates in UDF12 campaign. The slope of BDF-521 is , consistent to within 1- with UDF12 results as well as HDF09 results.
| Band | Aperture111The circle aperture for photometry is 0.48′′ for all the three different bands. | Flux(erg s -1 cm-2 Å-1) | mAB | MAB |
|---|---|---|---|---|
| F125W | 0.48” | |||
| F160W | 0.48” | |||
| F132N | 0.48” |
Fig.1 shows that BDF-521 is an extremely compact galaxy. Using the F125W broadband image, we measured its size and morphology based on Galfit measurements (Peng et al. 2002) and corrected for WFC3/F125W PSF broadening. The half-light radius of BDF-521 is 0.12” 0.01” in F125W. This corresponds to kpc (Fig. 1) and is consistent with those of -dropout galaxy candidates at z detected in the Hubble Deep Field (Ono et al., 2013).
4 Discussions
We do not detect the He II emission line from BDF-521 at . However, we put the strongest upper limit on the SFRPopIII to date. Combined with our He II upper limit on galaxies IOK-1 (Cai et al., 2011), we could constrain the formation of Pop III stars in two highest-redshift spectroscopically-confirmed galaxies at . Note that He II emission, although at lower levels than for Pop III stars, can be arisen from other sources, such as photoionization by AGN, or metal-poor nebular emission around massive stars. Due to the non-detection results in this paper, we assume Pop III stars are the only source of He II emission, and the upper limit of metal-free stars derived under this assumption is a secure limit.
Under the “standard” assumptions (Schaerer, 2002, 2003; Raiter et al., 2010) ionization bounded nebula, constant electron temperature and density, and Case B recombination the He recombination lines are fully specified and their luminosity is propotional to the ionizing photon production rate Q in the appropriate energy range. Following Raiter et al. (2010), the relation between line luminosity and He II ionizing photon production rate (He+) can be expressed as:
| (3) |
where erg for Z 1/50 Z⊙ and 6.04 erg for Z Z⊙ (Raiter et al., 2010). Eq. (3) can also be expressed by the following equation (Schaerer, 2002):
| (4) |
Under the Case B recombation model, the He ionizing photon production rate ) for a given SFRPopIII mainly depends on two parameters according to theoretical investigations (e.g. Schaerer, 2002; Raiter et al., 2010; Woods & Gilfanov, 2013): (a) IMF, (b) mass loss. Therefore, given Eqs. (4) and (5), also depends on these two parameters.
A top-heavy IMF will yield a higher photon production rate (higher value) for a given SFRPopIII. When the metallicity is smaller than the critical metallicity, with , stars are formed predominantly massive (Bromm et al. 2001), and the IMF should be much more top heavy than a normal IMF (Bromm et al. 2001). A few theoretical studies suggested that, at , a significant fraction of galaxies with gas masses M⊙ contain near pristine material of (e.g., Maio et al. 2013). The classical picture of Pop III star formation holds that the Pop III IMF is extremely top-heavy compared with a normal galactic IMF, and the typical mass for Pop III stars could be very massive of 100 M⊙ (e.g. Abel et al., 2002). However, recent simulations suggest that dynamical effects can cause the protodisk to fragment into multiple clumps; which may result in the formation of binary or multiple systems (Turk et al., 2009; Stacy et al., 2010; Clark et al., 2011; Greif et al., 2012; Dopcke et al., 2013). Using a grid code to study fragmentation with the highest resolution per Jeans length in minihalos, Latif et al. (2013) argue that a protostar of 10 M⊙ can form via turbulent accretion. Thus, Pop III stars could have a lower characteristic mass than the previously suggested M⊙. Our non-detections of strong He II for two galaxies at disfavors the models of very massive Pop III stars dominating bright galaxies with at . Table 2 demonstrates different upper limits of SFRPopIII due to different mass ranges. A less top-heavy IMF corresponds to a weaker He II line for a given of SFRPopIII.
Pop III stars with strong mass loss would yield a higher He II luminosity for a given SFRPopIII. A commonly used approach to estimate stellar mass loss at low metallicity is to extrapolate the metal dependent mass loss to very low metallicity, even to metallicity lower than . Recent observations support that mass loss in luminous blue variables (LBV) are important, and such strong LBV mass losses are seen in low metallicity dwarf galaxies, and are relatively insensitive to metallicity (Smith 2014, Neill et al. 2011). Thus, it is not safe to assume that massive stars at very low metallicity suffer much less mass loss on average. From Table 2, given upper limit of He II emission, stronger mass loss results in a more stringent upper limit on SFRPopIII.
For BDF-521, previous ground-based observations suggest a extreme blue slope of (Vanzella et al., 2011). Our HST measurement of the rest-frame UV luminosity has high S/N in both and bands. Based on that photometry, we get a normal slope of (Eq. 2). We derive the UV-based unobscured SFR from the rest-frame UV continuum. The UV-based overall SFR of BDF-521 is M⊙ yr-1, assuming the conversion for a Salpeter IMF between 0.1 to 100 M⊙ (Madau et al. 1998). Note that the conversion of the UV-based overall SFR assumes a normal stellar population, without the correction for Pop III stars with a top-heavy IMF. This conversion is reasonable given the non-detection of strong He II emission. Normally, one expects that a broad red wing of the Gunn-Peterson (GP) trough would suppress the Ly lines. As such, the Ly-based SFR may also be an underestimate. However, for BDF-521, the Ly-based SFR (§2) is close to UV-derived SFR. This measurement suggests little extinction of Ly relative to the continuum, and supports that BDF-521 has ionized a significant volume around itself, and the broad GP trough does not reach Ly emission.
If we assume the Pop III stars have an IMF with 50 M/M⊙ 500 and no mass loss, the ratio of SFRPopIII to the overall SFR () in BDF-521 is 20%. If we assume Pop III stars have a Salpeter IMF with 50M/M 1000 and strong mass loss, the ratio is 4% (Table 2). Kulkarni et al. (2013) use a semi-analytic model of galaxy formation to argue that measurements of relative abundances in high-z damped Ly systems (DLAs) can place constraints on the Pop III IMF. They show that the fractional contribution of very high-mass Population III stars to the ionization rate must be 10% at . Our observations are consistent that constraint. Combined with our previous upper limit from the galaxy IOK-1 (Cai et al. 2011), our observations targeting He II emission suggest that Pop III star formation with a top-heavy IMF could not significantly contribute to the overall star formation in a galaxy at .
If Population III stars are not from very top-heavy IMFs (see e.g., Stacy et al. 2010), the He II emission of galaxies at is too weak for current telescopes to detect with a reasonable exposure time. Also, the clear, solid signatures of a Pop-III dominated galaxy might require reaching the continuum level for fainter high-z galaxies. Zackrisson et al. (2012) suggest that the Pop III galaxies can experience siginificant Lyman continuum leakage (also, see Inoue et al., 2011), and that such objects would stand out in surveys by the James Webb Space Telescope (JWST) due to their extremely blue rest-frame FUV continuum slopes. Mitra et al. (2011) and Choudhury & Ferrara (2007) predict that if the observations reach a magnitude of , , Pop III-dominated sources residing halomass of will be detected at . Future facilities, especially JWST are expected to probe both the continuum and recombination lines for faint galaxies with low halo masses () at with reasonable exposure times, and, in doing so, to unveil the signatures of the earliest star formation in the universe.
| IMF(Salpeter) | Mass Loss | 2- upper limit of | 2- upper limit of 11footnotemark: 1 | |
| () | ||||
| No | 100% | |||
| No | 1.0 | 20% | ||
| Yes | 38% | |||
| Yes | 0.2 | 4% |
Note: represents the ratio of the Pop III star formation rate to the overall unobscured star formation rate.
5 Acknowledgement
We especially thank the anonymous referee for insightful comments which have significantly improved the Letter. Support for this work was provided by NASA through grant HST-GO-12487 from the Space Telescope Science Institute, which is operated by AURA, Inc., under NASA contract NAS5-26555.
References
- Abel et al. (2002) Abel, T., Bryan, G. L., & Norman, M. L. 2002, Science, 295, 93
- Bertin & Arnouts (1996) Bertin, E. & Arnouts, S. 1996, A&AS, 117, 393
- Bromm & Yoshida (2011) Bromm, V. & Yoshida, N. 2011, ARA&A, 49, 373
- Bromm et al. (2003) Bromm, V., Yoshida, N., & Hernquist, L. 2003, ApJ, 596, L135
- Bolton & Haehnelt (2013) Bolton, J. S., & Haehnelt, M. G. 2013, MNRAS, 429, 1695
- Bouwens et al. (2010) Bouwens, R. J., Illingworth, G. D., Oesch, P. A., et al. 2010, ApJ, 709, L133
- Cai et al. (2011) Cai, Z., Fan, X., Jiang, L., et al. 2011, ApJ, 736, L28
- Caruana et al. (2014) Caruana, J., Bunker, A. J., Wilkins, S. M., et al. 2014, MNRAS, 443, 2831
- Cassata et al. (2013) Cassata, P., Le Fèvre, O., Charlot, S., et al. 2013, A&A, 556, A68
- Castellano et al. (2010) Castellano, M., Fontana, A., Paris, D., et al. 2010, A&A, 524, A28
- Choudhury & Ferrara (2007) Choudhury, T. R. & Ferrara, A. 2007, MNRAS, 380, L6
- Clark et al. (2011) Clark, P. C., Glover, S. C. O., Klessen, R. S., & Bromm, V. 2011, ApJ, 727, 110
- Dawson et al. (2004) Dawson, S., Rhoads, J., & Malhotra, S. 2004, ApJ, 617, 707
- Dopcke et al. (2013) Dopcke, G., Glover, S. C. O., Clark, P. C., & Klessen, R. S. 2013, ApJ, 766, 103
- Eldridge & Stanway (2012) Eldridge, J. J., & Stanway, E. R. 2012, MNRAS, 419, 479
- Finkelstein et al. (2013) Finkelstein, S. L., Papovich, C., Dickinson, M., et al. 2013, Nature, 502, 524
- Greif et al. (2012) Greif, T. H., Bromm, V., Clark, P. C., et al. 2012, MNRAS, 424, 399
- Greif et al. (2011) Greif, T. H., Springel, V., White, S. D. M., et al. 2011, ApJ, 737, 75
- Fontana et al. (2010) Fontana, A., Vanzella, E., Pentericci, L., et al. 2010, ApJ, 725, L205
- Inoue et al. (2011) Inoue, A. K., Kousai, K., Iwata, I., et al. 2011, MNRAS, 411, 2336
- Iye et al. (2006) Iye, M., Ota, K., Kashikawa, N., & Furusawa, H. 2006, Nature, 443, 186-188
- Koekemoer et al. (2002) Koekemoer, A. M., Fruchter, A. S., Hook, R. N., & Hack, W. 2002, in The 2002 HST Calibration Workshop : Hubble after the Installation of the ACS and the NICMOS Cooling System, ed. S. Arribas, A. Koekemoer, & B. Whitmore, 337–+
- Latif et al. (2013) Latif, M. A., Schleicher, D. R. G., Schmidt, W., & Niemeyer, J. 2013, ApJ, 772, L3
- Mitra et al. (2011) Mitra, S., Choudhury, T. R., & Ferrara, A. 2011, MNRAS, 413, 1569
- Muratov et al. (2013) Muratov, A. L., Gnedin, O. Y., Gnedin, N. Y., & Zemp, M. 2013, ApJ, 773, 19
- Nagao et al. (2005) Nagao, T., Maiolino, R., & Marconi, A. 2005, ApJ, 631, L5
- Nagao et al. (2008) Nagao, T., Sasaki, S. S., & Maiolino, R. 2008, ApJ, 680, 100
- Neill et al. (2011) Neill, J. D., Sullivan, M., Gal-Yam, A., et al. 2011, ApJ, 727, 15
- Oesch et al. (2010) Oesch, P. A., Bouwens, R. J., Carollo, C. M., et al. 2010, ApJ, 709, L21
- Ono et al. (2013) Ono, Y., Ouchi, M., Curtis-Lake, E., Schenker, M. A., Ellis, R. S., McLure, R. J., Dunlop, J. S., Robertson, B. E., Koekemoer, A. M., Bowler, R. A. A., Rogers, A. B., Schneider, E., Charlot, S., Stark, D. P., Shimasaku, K., Furlanetto, S. R., & Cirasuolo, M. 2013, ApJ, 777, 155
- Ono et al. (2012) Ono, Y., Ouchi, M., Mobasher, B., Dickinson, M., Penner, K., Shimasaku, K., Weiner, B. J., Kartaltepe, J. S., Nakajima, K., Nayyeri, H., Stern, D., Kashikawa, N., & Spinrad, H. 2012, ApJ, 744, 83
- Ouchi et al. (2013) Ouchi, M., Ellis, R., Ono, Y., Nakanishi, K., Kohno, K., Momose, R., Kurono, Y., Ashby, M. L. N., Shimasaku, K., Willner, S. P., Fazio, G. G., Tamura, Y., & Iono, D. 2013, ApJ, 778, 102
- Raiter et al. (2010) Raiter, A., Schaerer, D., & Fosbury, R. 2010, ArXiv e-prints
- Robertson et al. (2013) Robertson, B. E., Furlanetto, S. R., Schneider, E., Charlot, S., Ellis, R. S., Stark, D. P., McLure, R. J., Dunlop, J. S., Koekemoer, A., Schenker, M. A., Ouchi, M., Ono, Y., Curtis-Lake, E., Rogers, A. B., Bowler, R. A. A., & Cirasuolo, M. 2013, ApJ, 768, 71
- Salvaterra et al. (2011) Salvaterra, R., Ferrara, A., & Dayal, P. 2011, MNRAS, 414, 847
- Scannapieco et al. (2003) Scannapieco, E., Schneider, R., & Ferrara, A. 2003, ApJ, 589, 35
- Schaerer (2002) Schaerer, D. 2002, A&A, 382, 28
- Schaerer (2003) —. 2003, A&A, 397, 527
- Schenker et al. (2012) Schenker, M. A., Stark, D. P., Ellis, R. S., Robertson, B. E., Dunlop, J. S., McLure, R. J., Kneib, J.-P., & Richard, J. 2012, ApJ, 744, 179
- Smith (2014) Smith, N. 2014, ARA&A, 52, 487
- Stacy et al. (2010) Stacy, A., Greif, T. H., & Bromm, V. 2010, MNRAS, 403, 45
- Trenti & Stiavelli (2009) Trenti, M. & Stiavelli, M. 2009, ApJ, 694, 879
- Tumlinson (2006) Tumlinson, J. 2006, ApJ, 641, 1
- Tumlinson & Shull (2000) Tumlinson, J. & Shull, J. M. 2000, ApJ, 528, L65
- Turk et al. (2009) Turk, M. J., Abel, T., & O’Shea, B. 2009, Science, 325, 601
- Vanzella et al. (2011) Vanzella, E., Pentericci, L., Fontana, A., Grazian, A., Castellano, M., Boutsia, K., Cristiani, S., Dickinson, M., Gallozzi, S., Giallongo, E., Giavalisco, M., Maiolino, R., Moorwood, A., Paris, D., & Santini, P. 2011, ApJ, 730, L35
- Woods & Gilfanov (2013) Woods, T. E. & Gilfanov, M. 2013, MNRAS, 432, 1640
- Yan et al. (2012) Yan, H., Finkelstein, S. L., Huang, K.-H., Ryan, R. E., Ferguson, H. C., Koekemoer, A. M., Grogin, N. A., Dickinson, M., Newman, J. A., Somerville, R. S., Davé, R., Faber, S. M., Papovich, C., Guo, Y., Giavalisco, M., Lee, K.-s., Reddy, N., Cooray, A. R., Siana, B. D., Hathi, N. P., Fazio, G. G., Ashby, M., Weiner, B. J., Lucas, R. A., Dekel, A., Pentericci, L., Conselice, C. J., Kocevski, D. D., & Lai, K. 2012, ApJ, 761, 177
- Yoshida et al. (2004) Yoshida, N., Bromm, V., & Hernquist, L. 2004, ApJ, 605, 579
- Zackrisson et al. (2012) Zackrisson, E., Zitrin, A., Trenti, M., Rydberg, C.-E., Guaita, L., Schaerer, D., Broadhurst, T., Östlin, G., & Ström, T. 2012, MNRAS, 427, 2212