Structure, magnetic order and excitations in the 245 family of Fe-based superconductors
Abstract
Elastic neutron scattering simultaneously probes both the crystal structure and magnetic order in a material. Inelastic neutron scattering measures phonons and magnetic excitations. Here we review the average composition, crystal structure and magnetic order in the 245 family of Fe-based superconductors and in related insulating compounds from neutron diffraction works. A three-dimensional phase-diagram summarizes various structural, magnetic and electronic properties as a function of the sample composition. High pressure phase diagram for the superconductor is also provided. Magnetic excitations and the theoretic Heisenberg Hamiltonian are provided for the superconductor. Issues for future works are discussed.
pacs:
75.25.-j,75.30.Kz,74.70.-b,74.25.HaMost Fe-based superconductors are pnictides Ishida et al. (2009). There had been only one family of iron chalcogenide superconductors Fe1+δ(Se,Te) of maximum K at ambient pressure Hsu et al. (2008); Fang et al. (2008) and 37 K at high pressure Medvedev et al. (2009), before a new iron chalcogenide superconductor of the nominal composition K0.8Fe2Se2 was reported in 2010 with K Guo et al. (2010). A transient transition around 40 K from a part of the sample was also reported in the work, which may be related to the superconducting transition realized later in Fe2Se2(NH2)y(NH3)z (=K, Li) Ying et al. (2013); Burrard-Lucas et al. (2013).
The Fe1+δSe (11) superconductor is made of charge neutral FeSe layers of the anti-PbO structure, with the excess Fe important to the stability of the structure Bao et al. (2009); McQueen et al. (2009). The weakly coupled layers is susceptible to intercalation. We will review magnetic order and excitations of the 30 K intercalated chalcogenide superconductors from neutron scattering studies. To do that, it is also necessary to review sample composition, crystal structure and phase diagram of the new family of Fe-based superconductors, which have caused much confusion and controversy at the moment due to inadequate sample characterization. Physical parameters of the five Fe4Se5 (245) superconductors are summarized in TABLE 1.
| K | Rb | Cs | Tl,K | Tl,Rb | |
| a () | 8.7306(1) | 8.788(5) | 8.865(5) | 8.645(6) | 8.683(5) |
| c () | 14.1128(4) | 14.597(2) | 15.289(3) | 14.061(3) | 14.388(5) |
| () | 3.31(2) | 3.3(1) | 3.3(1) | 3.2(1) | 3.2(1) |
| (K) | 32 | 32 | 29 | 28 | 32 |
| (K) | 559(2) | 502(2) | 471(4) | 506(1) | 511(1) |
| (K) | 578(2) | 515(2) | 500(1) | 533(2) | 512(4) |
I Sample composition and crystal structure of the superconductors
After the initial report Guo et al. (2010) and confirmation Mizuguchi et al. (2011) of superconductivity in the nominal KxFe2Se2, Cs and Rb compounds of the similar nominal composition Krzton-Maziopa et al. (2011); Wang et al. (2011a) as well as Tl containing compounds of a different nominal composition (Tl,)Fe2-xSe2 (=K,Rb) Fang et al. (2011); Wang et al. (2011b) were reported to superconduct also at K. The former composition formula indicates an intact FeSe plane as in the 11 compounds as well as “heavy electron doping” Zhang et al. (2011). The latter suggests Fe vacancy in the FeSe plane since two different kinds of Fe vacancy orders have been reported previously in chalcogenide TlFe2-xS2 and TlFe2-xP2 Sabrowsky et al. (1986); Haggström et al. (1986).
The nominal K0.8Fe2Se2 and Cs0.8Fe2Se2 superconducting samples used in the ARPES study to conclude a heavy electron doping Zhang et al. (2011), however, are refined to be K0.775(4)Fe1.613(1)Se2 and Cs0.748(2)Fe1.626(1)Se2 in the single-crystal x-ray diffraction study using the samples from the same source Zavalij et al. (2011). One superconducting sample from a systematic synthesis study of another group Wang et al. (2011c) is found to be K0.737(6)Fe1.631(3)Se2 in the single-crystal x-ray diffraction study Zavalij et al. (2011), while another superconducting sample to be K0.83(2)Fe1.64(1)Se2 in a powder neutron diffraction refinement study Bao et al. (2011). Thus, the iron valance in the superconducting samples is very close to but not exactly at 2+, similar to that in the previously discovered iron chalcogenide superconductors Fe1+δ(Se,Te) Bao et al. (2009); McQueen et al. (2009), but very different from the conclusion of the ARPES studies which claim intact FeSe layers in Fe2Se2 Zhang et al. (2011); Mou et al. (2011); Wang et al. (2011d). An alternative interpretation of the ARPES data has been offered by Berlijn et al Berlijn et al. (2012).
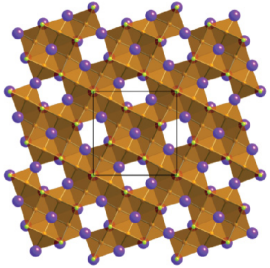
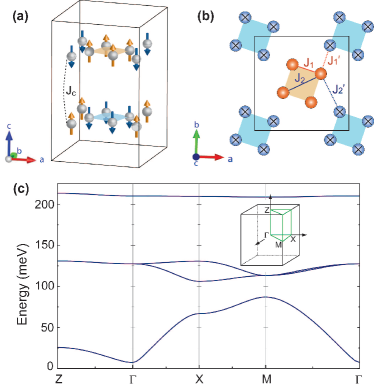
The Fe vacancy not only exists in these new superconductors but also forms a nearly ideal superlattice on the FeSe square plane, see FIG. 1. The ordered structure is refined in the tetragonal unit cell, and the structure parameters are tabulated in Zavalij et al. (2011); Bao et al. (2011). The prominent structural feature of the superconducting samples is the almost empty 4 Fe1 site with an occupancy at a few percent and the full occupancy of the 16 Fe2 site, see TABLE 2, below room temperature.
| K0.83(2)Fe1.64(1)Se2 Bao et al. (2011) | K0.862(3)Fe1.563(4)Se2 Bacsa et al. (2011) | K0.93(1)Fe1.52(2)Se2 Bacsa et al. (2011) | K0.99(1)Fe1.48(1)Se2 Bao et al. (2013) | ||||
|---|---|---|---|---|---|---|---|
| T(K) | 11 | 295 | 500 | 550 | 90 | 100 | 295 |
| 0.062(8) | 0.059(6) | 0.22(2) | 0.26(1) | 0.227(3) | 0.118(7) | 0.29(1) | |
| 1.008(4) | 1.020(6) | 0.951(4) | 0.935(3) | 0.920(1) | 0.918(5) | 0.857(6) | |
| 0.062(8) | 0.058(6) | 0.23(2) | 0.28(1) | 0.247(3) | 0.129(8) | 0.34(1) | |
If the Fe1 site is completely empty and the Fe2 site fully occupied with the perfect Fe vacancy order, the sample composition would be Fe1.6Se2, or Fe4Se5 (245). As the non-stoichiometric Fe1+δ(Se,Te) (11) superconductors are referred to as the 11 family, the slightly off-stoichiometric iron selenide superconductors with the Fe vacancy order Fe4+δSe5, where and due to the Fe valence +, can also be referred to as the 245 superconductors Zavalij et al. (2011); Bao et al. (2011).
In addition to K and Cs, the Rb, (Tl,K) and (Tl,Rb) superconducting Fe4Se5 samples also possess the same nearly ideal Fe vacancy order Ye et al. (2011). The Fe vacancy order in all of these five known 245 superconductors disappears in an order-disorder structural transition at a very high temperature ranging from 500 to 578 K, respectively Bao et al. (2011); Ye et al. (2011).
Above the transition at , the Fe1 and Fe2 sites become equally occupied, thus restoring the symmetry as in the BaFe2As2 (122) system. However, it should be noted that this high-temperature compound cannot be called Fe2Se2 as many people mistakenly do in current literature, since the occupancy at the Fe and sites in the structure is only around 0.8 in these superconductors, see Table 2 in Bao et al. (2011). The sample composition remains to be close to Fe1.6Se2, i.e. 245. In other words, 245 does not always have the superlattice structure. Temperature is one determining factor, more on this point in the phase-diagram section. A 245 compound at high temperature above does not make it a 122 compound, despite of its share of the same space group symmetry with the 122 compounds.
II Magnetic order of the 245 superconductors
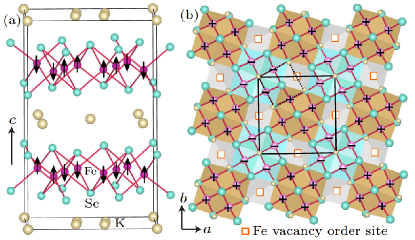
Slightly below the order-disorder transition K, an antiferromagnetic order develops at K in the K2Fe4Se5 superconductor Bao et al. (2011). The c-axis is the easy axis of the magnetic order. The four magnetic moments on the nearest-neighbor square block behave like a superspin, forming the simple chessboard antiferromagnetic pattern in the plane, see FIG. 2. With the development of the staggered magnetic moment which reaches 3.31(2) /Fe at 11 K, the distance between the four Fe atoms on the block of the same spin orientation also shrinks from the regular square lattice in the high temperature structure Bao et al. (2011). This strong magnetostructural tetramerization greatly contributes to the stability of the block antiferromagnetic order on the vacancy ordered lattice according to band structure calculations Cao and Dai (2011); Yan et al. (2011).
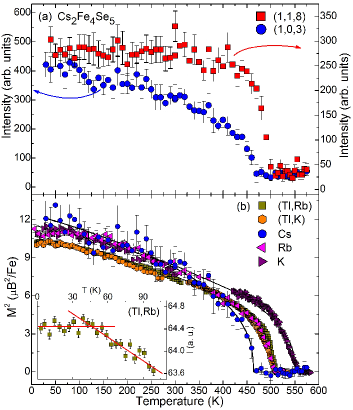
The same large moment and high antiferromagnetic order in FIG. 2 also exists in the rest four 245 superconductors Ye et al. (2011). In FIG. 3(a), magnetic Bragg peak (103) due to the tetramer block antiferromagnetic order is shown as a function of temperature together with the structural Bragg peak (118) due to the Fe vacancy order. The magnetic order starts to develop as soon as sufficient order has been established in the superlattice. FIG. 3(b) compares the squared magnetic order parameter of the five 245 superconductors. The ranges from 471 to 559 K but the staggered magnetic moment stays at 3.3(1) /Fe, close to the atomic value 4 /Fe for the Fe2+ ions, refer to TABLE 1. The staggered magnetic moment in 245 superconductors is larger than the record size 2.0 /Fe of previous Fe-based superconductors Bao et al. (2009).
One remarkable feature of the 245 superconductors is the coexistence of superconductivity with the very strong antiferromagnetic order. Inset to FIG. 3 shows the inflection of the magnetic intensity when is approached in (Tl,Rb)2Fe4Se5 superconductor. This indicates strong interaction between the antiferromagnetic order and superconductivity, and has served as a definite evidence for the coexistence in unconventional magnetic superconductors such as heavy-fermion UPt3 Aeppli et al. (1988) and Fe-based Ba(Fe0.953Co0.047)2As2 Pratt et al. (2009). The superconducting symmetry of the 245 materials has to be such that it can survive in the tremendously strong staggered magnetic field imposed by the large magnetic moment.
While the antiferromagnetic order in 245 superconductors does not break the four-fold tetragonal crystal symmetry, antiferromagnetic order in all previous families of Fe-based superconductors exists in a distorted crystal structure of a symmetry lower than the tetragonal one de la Cruz et al. (2008); Huang et al. (2008); Bao et al. (2009). It has been discovered in neutron diffraction works that there exists empirical rules that defines the relation between the shortened spacing of the Fe neighboring pair and their ferromagnetic interaction, and relation between the expanded spacing and antiferromagnetic interaction in NdFeAsO (1111) Qiu et al. (2008), BaFe2As2 Huang et al. (2008) and Fe1+δTe Bao et al. (2009) of the 1111, 122 and 11 families. This intimate structure-magnetism relationship can be explained as due to different occupation of the and orbitals, which leads to the structural distortion from the in-plane four-fold symmetry and prepares the magnetic exchange interactions of correct signs for the observed antiferromagnetic order Qiu et al. (2008); Yildirim (2008); Huang et al. (2008); Bao et al. (2009). Such an orbital ordering mechanism can also be successfully applied to explain the tetramer block antiferromagnetism in 245 superconductors in a unified fashion Lv et al. (2011); Yin et al. (2012), satisfying the same empirical rules connecting the lattice expansion (contraction) with (anti)ferromagnetic exchange interaction Bao et al. (2011). Meanwhile, the spin-density-wave scenario due to the nesting Fermi surface de la Cruz et al. (2008) faces serious experimental difficulties, such as no anomaly in resistivity at . Refer to Bao (2013) for more detailed discussion.
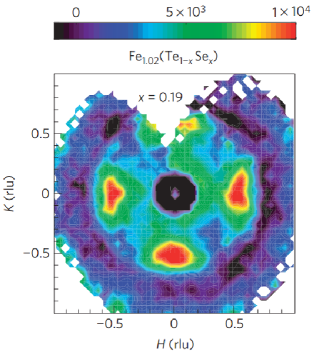
When the lattice distortion of Fe1+δTe is suppressed with Se substitution, the long-range antiferromagnetic order that breaks the four-fold symmetry is replaced by a glassy short-range magnetic order Bao et al. (2009). FIG. 4 shows the diffuse scattering pattern in the basal plane from the glassy order. The order contains the same tetramer block of 245 superconductors as a constituent in fluctuating magnetic clusters Thampy et al. (2012); Zaliznyak et al. (2011). Thus, it appears that the magnetostructural tetramerization is a common tendency among the two families of iron chalcogenide superconductors Yin et al. (2012). The condensation of the tendency to a long-range order possibly needs the relief of magnetic frustration that is alluded to by Yildirim Yildirim (2008), with the lattice distortion in the 11 family or the tetramerization introduced by the vacancy order in the 245 family.
III Composition Phase Diagram
No polycrystalline 245 superconductor has been reported so far. The as-grown single crystal is also usually non-superconducting. The crystal becomes superconducting after an annealing process. When the superconducting sample is ground, we always find pure Fe intergrowth between the 245 plates Bao et al. (2011). This may not be surprising for intercalating compounds. However, it has contributed to widespread systematic error in the determination of the sample composition in current research, that derives the nominal composition either using the starting material ratio, or employing the inductively coupled plasma (ICP) analysis method when both the genuine 245 crystal and the Fe intergrowth are vaporized. In neutron or x-ray diffraction experiments, different materials in the bulk sample can be detected, and their compositions and structures separately refined. We have found that the refined composition is quite different from the nominal composition Zavalij et al. (2011); Bao et al. (2011).
FIG. 5 shows the phase diagram of KxFe2-ySe2, of which samples were prepared using the same procedure for the series of samples published in Wang et al. (2011c). First of all, the and in the chemical formula KxFe2-ySe2 are not completely independent, and the actual sample compositions shown on the basal plane cluster along the black line which defines the Fe valance exactly at . Thus, the series of samples made using the Bridgman method all contain Fe of valence close to . Consequently with , the charge neutrality requires that when more K of valence is intercalated between the FeSe planes, more Fe vacancy is created. When and () at the left side of the phase-diagram, KxFe2-ySe2 becomes K0.8Fe1.6Se2, namely K2Fe4Se5. One of five Fe sites is vacant. When and at the right, KxFe2-ySe2 is KFe1.5Se2, i.e. K2Fe3Se4 (234). One of four Fe sites is vacant.
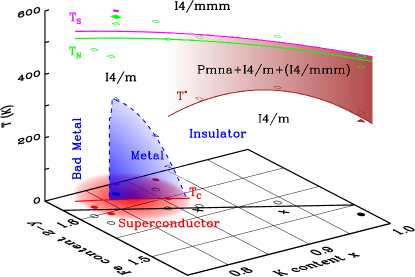
The two superconducting samples at left in the phase diagram FIG. 5 show consistently high a resistivity above , see FIG. 6(a). They also show poor diamagnetic response below , see inset to FIG. 6(c). Moving to the right in the phase diagram, the normal state resistivity of the next three superconducting sample shows a bump, which defines the metal-insulator crossover point (blue triangle and dashed line) in the phase diagram. These samples demonstrate a much better diamagnetic response. The sample K0.83Fe1.64Se2 of the highest crossover temperature, showing the lowest overall normal state resistivity, was made following the same recipe as that used in the previous neutron powder diffraction study Bao et al. (2011). Below the crossover temperature where the metal-like positive-slope resistivity exists, the occupancy ratio of the two Fe sites has approached the minimum value that we have observed, see TABLE 2, indicating a highly ordered vacancy superlattice.
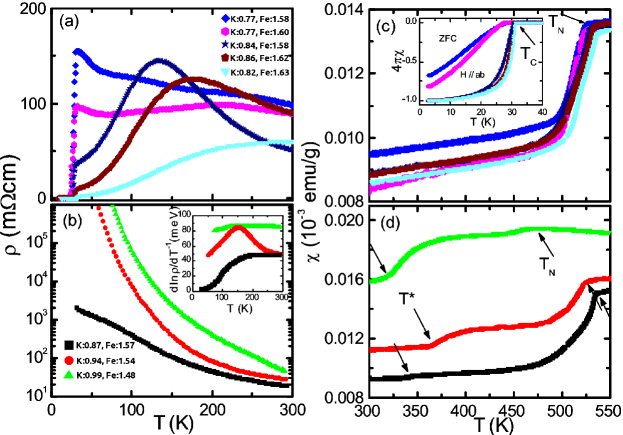
Moving further to the right in the phase diagram FIG. 5, the three insulating samples shows a progressive opening of a transport activation gap from a logarithmic behavior at low temperature, see FIG. 6(b) and inset therein. Except under the small dome of the metallic crossover and the superconducting phase underneath, most region of the phase diagram stays in insulating phase Bao et al. (2013).
Basca et al. are the first to perform single crystal x-ray refinement study of K0.862(3)Fe1.563(4)Se2 at 90 K and K0.93(1)Fe1.52(2)Se2 at 100 K Bacsa et al. (2011) in this insulating phase, and their compositions are marked by the crosses in the basal plane of FIG. 5. The crystal structure in the temperature range is described by the space group. However, there is substantial disorder in the superstructure. The refined structure parameters for the first crystal are list in Table 1 in Bacsa et al. (2011). The occupancy at the two Fe sites is quoted in TABLE 2. The for the first crystal and for the second crystal.
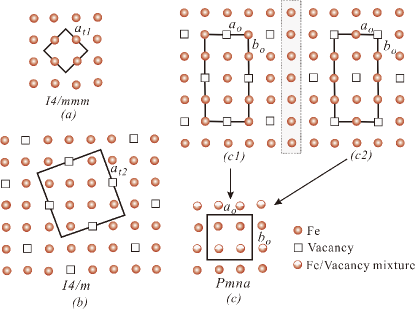
We performed neutron powder diffraction study in a wide temperature range for K0.99(1)Fe1.48(1)Se2, which is very close to the 234 end member Bao et al. (2013). One of four Fe is vacant at the 234 composition, and the vacancy order shown in FIG. 7(c1) or (c2) has been discussed in works on TlFe1.5Se2 and TlFe1.5S2 Sabrowsky et al. (1986). Surprisingly, this orthorhombic superstructure is not the ground state in KFe1.5Se2. It appears in the order-disorder transition at K down to a finite temperature K as a competing phase coexisting with an imperfect Fe vacancy order, as well as with a remnant vacancy-disordered phase of the symmetry from high temperature Bao et al. (2013). As one of the three phases in the phase separated region in the phase diagram FIG. 5, substantial structural faults exist in this vacancy order so that the average pattern in FIG. 7(c) describes our data. The refined structural parameters in orthorhombic space group are listed in Table 3 in Bao et al. (2013). Magnetic structure in the orthorhombic phase is the same as that in the BaFe2As2 with the staggered moment 2.8(1) /Fe from neutron diffraction study on K0.85Fe1.54Se2 Zhao et al. (2012).
Below 380 K, no remnant phase can be detected in K0.99Fe1.48Se2. Below K, the phase also disappears, leaving the Fe vacancy order as the only phase at low temperature Bao et al. (2013), consistent with the case of K0.93Fe1.52Se2 at 100 K and K0.862Fe1.563Se2 at 90 K in the x-ray work Bacsa et al. (2011). Refined structure parameters for K0.99Fe1.48Se2 at 50 and 295 K are listed in Table 2 of Bao et al. (2013), and the staggered antiferromagnetic moment is 3.16(5) /F, similar to the value in 245 Bao et al. (2011). The Fe occupancy data for K0.99Fe1.48Se2 are also quoted in TABLE 2. Together with the data from Basca et al. Bacsa et al. (2011), the enhanced in the insulating phase of FIG. 5 reflects the increasing disorder necessary to resolve the mismatch between the number of Fe vacancies in the material and the number of vacancies in the superlattice pattern.
The site disorder registered in the substantial value for samples away from 245 on the right part of the phase diagram in FIG. 5 manifests in the telltale logarithmic resistivity close to the metal-insulator crossover shown in FIG. 6(b). Above the crossover temperature for the 245 sample, the value also increases substantially from the 0.06 base value, see TABLE 2. Therefore, the metal-insulator crossover in the KxFe2-ySe2 system is likely also driven by the Anderson weak localization process. A similar situation in the 11 chalcogenide superconductors, albeit not by site disorder scattering but by spin-glass quasi-static scattering of electrons, has been uncovered previously in a similar study combining neutron scattering and bulk techniques Liu et al. (2010). In both 11 and 245 iron chalcogenide superconductors, therefore, metallic transport behavior in the normal state serves as the prelude to superconductivity at lower temperature.
Neutron diffraction refinement studies not only provide microscopic mechanism for the normal state transport properties, they also explain the anomalies in magnetic susceptibility. The antiferromagnetic transition leaves a strong reduction in the susceptibility, FIG. 6(c)-(d). The further reduction at in FIG. 6(d) corresponds to a rapid increase in the staggered magnetic moment from 2.8 to 3.2 in the conversion of the to the phase, see Fig. 1(b) in Bao et al. (2013). The inhibition of the susceptibility is caused by the large 6.5(3) meV magnetic excitation gap of the block antiferromagnetic order Chi et al. (2013).
The preference of the tetragonal superlattice of the symmetry over the orthorhombic one-out-of-four superlattice of the symmetry shown in FIG. 7 as the ground state even in the 234 compound is an experimental confirmation to the large electronic energy gain in the formation of the magnetostructural tetramers in ab initio energy band theory Cao and Dai (2011); Yan et al. (2011). When temperature is raised above , the material enters a two-phase mixture of the two Fe vacancy orders to gain in entropy, henceforth in free energy, as can be understood in a simple two-level statistical physical model.
A phase diagram with samples scattering along a bending line on the basal plane of FIG. 5 has also been published that is consistent with our result Yan et al. (2012). However, only , and are marked, using features in bulk measurement data at the structural and magnetic transitions identified in our neutron scattering works. The use of the valence as the x-axis in their two-dimensional phase diagram can also be misleading, since a valence change originating at e.g. 234 will not lead to superconductivity.
The phase separated region between and in phase diagram FIG. 5 covers the room temperature. Many studies on 245 superconductors reporting phase separation used samples of actual compositions in this miscibility gap. Therefore, all of the three types of structural phases in the phase region have been observed in transmission electron microscopy study Wang et al. (2011e). The existence of the Fe vacancy order also shows up in new phonon modes detected in optic and Raman measurements of various samples over the phase-diagram Chen et al. (2011); Zhang et al. (2012).
IV Magnetic excitations of the 245 superconductors
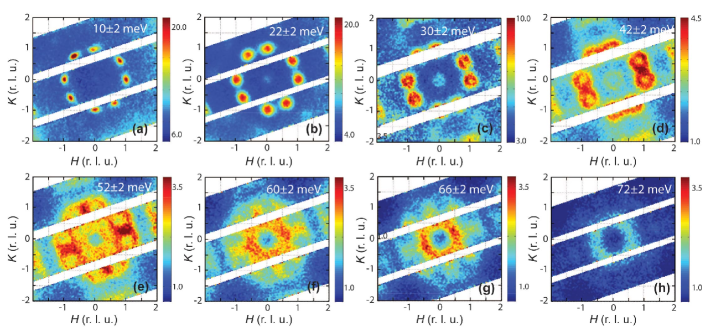
The whole magnetic excitation spectrum in the (Tl,Rb)2Fe4Se5 superconductor (T K) has been measured up to 300 meV with a chopper inelastic neutron spectrometer Chi et al. (2013). Some of the data are shown in FIG. 8, demonstrating the evolution of the spin-wave cones at the two sets of magnetic Bragg spots from a twinned single-crystal sample.
Consistent with the expectation for a large-moment antiferromagnet, magnetic excitation spectrum can be fitted by a Heisenberg Hamiltonian of localized magnetic moments
| (1) |
which includes five exchange constants , , , and as depicted in Fig. 9(a) and (b), and the single-ion anisotropy constant that quantifies the observed Fe spin alignment along the c-axis Ye et al. (2011). The spin-wave dispersion, as well as the scattering intensity of the acoustic branch, can be accounted for with the following parameters Chi et al. (2013):
| (2) |
Except the weaker antiferromagnetic which frustrates the ferromagnetically aligned spin block, the remaining terms help stabilizing the observed block antiferromagnetic order. There exists a qualitative agreement between these experimental values and ab initio linear response theoretic results Ke et al. (2012). The resulting spin wave dispersion curves in various high symmetry directions are shown in Fig. 9(c).
Low energy magnetic excitations ( meV) from a superconducting Rb0.82Fe1.68Se2 sample has also been investigated with a chopper inelastic neutron spectrometer Wang et al. (2012a). The data are not sufficient to determine the magnetic exchange interactions on the Fe vacancy lattice, and the focus of the work was on some extra features around the in-plane () point in the unit cell notation. No such features are observed in our study on the (Tl,Rb)2Fe4Se5 superconductor. Judging from the phase-diagram in FIG. 5 and the fact that the magnetic zone center of the phase is at () Zhao et al. (2012), the Rb0.82Fe1.68Se2 sample used in the work is likely not pure and the impurity phase contributes the extra magnetic excitations.
The acoustic branch of magnetic excitations ( meV) from the K2Fe4Se5 superconductor has been measured with a triple-axis spectrometer along two directions in the reciprocal space Xiao et al. (2013). An independent determination of magnetic Hamiltonian, however, is out of reach. Thus, the and used in data fitting were borrowed from the values of a neutron scattering study on an insulating Rb0.98Fe1.58Se2 sample Wang et al. (2011f). This insulating sample locates at the right side of the phase diagram, see FIG. 5, thus necessarily containing substantial site disorder with a large value. Although an exchange-interaction between the third nearest neighbor spin pair in the plane in principle is possible Wang et al. (2011f) in this insulating sample of rather disordered superlattice, the argument to include in the intensity fitting could be nullified due to the inclusion of the scattering intensity from the close-by twin Bragg spot in the coarse spatial resolution volume of the spectrometer used in the study.
We do not review inelastic neutron scattering works on the so-called ”resonance mode” in the 245 family of Fe-based superconductors. As shown in e.g. Figure 3 of Taylor et al. (2013) for a related FeSe superconductor, the mode keeps decreasing above the superconducting transition . This is fundamentally different from the resonance mode, observed with significant signal to noise ratio, in the 122 family of Fe-based superconductors. The association of the spectral feature with superconductivity is premature at the moment.
V Phase diagram at high pressure
The stoichiometric Fe4Se5 is an antiferromagnetic semiconductor according to band structure calculations Cao and Dai (2011); Yan et al. (2011). Superconducting samples, as presented above, are slightly off-stoichiometric and show metal-like transport property below the semiconductor-metal crossover temperature, FIG. 6(a). The 245 superconductor also locates close to the miscibility gap of phase separation, refer to FIG. 5. Thus, an important question is whether the 245 superconductor is a doped semiconductor or only a minority phase in the phase-separated sample is superconducting Shoemaker et al. (2012). A closely related question is whether inhomogeneity is intrinsic to a off-stoichiometric superconductor or a pure superconducting phase can be identified and hopefully isolated Ricci et al. (2011); Liu et al. (2012); Charnukha et al. (2012); Wang et al. (2012b, 2011e); Ksenofontov et al. (2011); Zhang et al. (2013); Texier et al. (2012). The majority view at the moment is that the phase with the Fe superlattice and the large-moment antiferromagnetic order is irrelevant to the superconductivity. The A2Fe3Se4, AFe2Se2 or AxFe2Se2 phase has all been proposed as the superconducting phase.
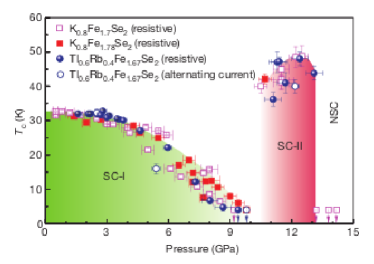
While the samples of the 245 family of superconductors involves complex preparation issues due to the proximity to the miscibility gap, high pressure offers another way to control the phases and investigate physics properties of the material Guo et al. (2012); Gooch et al. (2011). In particular, superconductivity in (Tl,Rb)2Fe4Se5 is suppressed by high pressure at GPa, and then reappears between 11 and 13 GPa with a higher K Sun et al. (2012), FIG. 10.
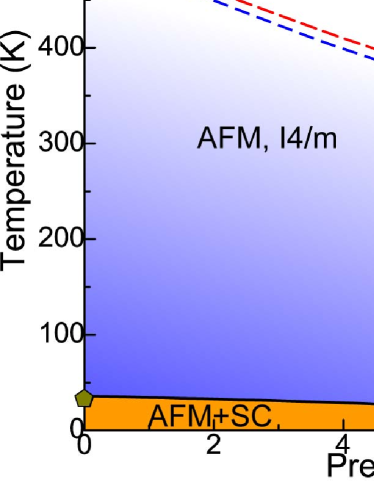
Single-crystal high pressure neutron diffraction study on the (Tl,Rb)2Fe4Se5 superconductor has been recently performed Ye et al. (2014). Both the Fe vacancy order and the block antiferromagnetic order can be simultaneously measured. The phase diagram is shown in FIG. 11. A note of caution is that neutron scattering experiment at 9 GPa is not possible to be conducted at very low temperature at this time. A close relation of the structural and magnetic orders with the superconducting phase can be deduced.
High pressure x-ray structure study of the 245 superconductors have been conducted previously. The neutron diffraction result is consistent with that by Guo et al. Guo et al. (2012), but fundamentally different from that by Ksenofontov et al. Ksenofontov et al. (2012). Ksenofontov et al. also reported that the AxFe2Se2 phase survives beyond the pressure that suppresses the superconducting phase Ksenofontov et al. (2012).
VI Concluding remarks
Elastic and inelastic neutron scattering studies have play a crucial role in determining the sample composition, crystal structure, phase diagram, magnetic order and excitations in the 245 family of Fe-based superconductors. The well-ordered superlattice characterized by a small value in the structure is linked with the metal-like normal state transport property, which precedes the occurrence of the superconductivity. Like in the 11 family of iron chalcogenide superconductors, the Anderson localization of conducting electrons by disordered scattering is also fatal to superconductivity in the 245 family of iron chalcogenide superconductors.
The large-moment block antiferromagnetic order is crucial for the stability of the Fe vacancy order over its competing phase such as the orthorhombic vacancy order or the disordered Fe partial occupancy in the structure, which exists only in an intermediate temperature range. This is due to the large energy gain in the tetramerization process. The same kind of magnetostructural coupling in which the contraction and expansion of the lattice are linked with ferromagnetic and antiferromagnetic exchange interactions, respectively, is universal in all Fe based superconducting families, reflecting the common orbital ordering mechanism.
The low charge density left after the majority of electrons form the large magnetic moment close to the atomic limit on Fe2+, the off-stoichiometric composition of the superconducting phase, and the close-by miscibility gap of multiple phases have caused complex material control and characterization issues. Whether the 245 superconductors exist as a pure phase like in e.g. the heavy fermion superconductors or in an inhomogeneous matrix like in e.g. the cuprate superconductors is a open question. The high pressure works suggest a symbiotic relation of the vacancy order and the block antiferromagnetic order with the superconductivity.
Nonetheless, we know that the 245 superconductors are of a spin-singlet state as shown in the NMR study Yu et al. (2011). The superconductivity exists in close proximity with the strong antiferromagnetic order as demonstrated by its strong effect on magnetic order parameter. Conversely, the superconducting order parameter in the 245 materials should be able to withstand the strong staggered magnetic field. Additionally, the energy gap on the Fermi surface can be measured with ARPES. Further progress in pinning down microscopic material phase of the 245 superconductors at the correct average composition region on the phase diagram demands careful experimental study on well controlled and characterized samples.
VII acknowledgments
We thank Xianhu Chen, Minghu Fang, Genfu Chen, Qingzhen Huang, Yiming Qiu, M.A. Green, Feng Ye, Songxue Chi, A.T. Savici, G.E. Granroth, M.B. Stone, A.M. dos Santos, Qingming Zhang, Weiqiang Yu, Nanlin Wang, Jianqi Li, Lilian Sun, Donglai Feng, Wei Ku, Zhongyi Lu, Chao Cao and Jianhui Dai for collaboration and discussions in the investigation on the 245 Fe-based superconductors. The work at RUC was supported by National Basic Research Program of China (Grant Nos. 2012CB921700 and 2011CBA00112) and the National Natural Science Foundation of China (Grant Nos. 11034012 and 11190024).
References
- Ishida et al. (2009) K. Ishida, Y. Nakai, and H. Hosono, J. Phys. Soc. Japan 78, 062001 (2009).
- Hsu et al. (2008) F.-C. Hsu, J.-Y. Luo, K.-W. Yeh, T.-K. Chen, T.-W. Huang, P. M. Wu, Y.-C. Lee, Y.-L. Huang, Y.-Y. Chu, D.-C. Yan, and M.-K. Wu, PNAS 105, 14262 (2008).
- Fang et al. (2008) M. Fang, H. Pham, B. Qian, T. Liu, E. K. Vehstedt, Y. Liu, L. Spinu, and Z. Q. Mao, Phys. Rev. B 78, 224503 (2008).
- Medvedev et al. (2009) S. Medvedev, T. McQueen, I. Trojan, T. Palasyuk, M. Eremets, R. Cava, S. Naghavi, F. Casper, V. Ksenofontov, G. Wortmann, and C. Felser, Nat. Mater. 8, 630 (2009).
- Guo et al. (2010) J. Guo, S. Jin, G. Wang, S. Wang, K. Zhu, T. Zhou, M. He, and X. Chen, Phys. Rev. B 82, 180520(R) (2010).
- Ying et al. (2013) T. Ying, X. Chen, G. Wang, S. Jin, X. Lai, T. Zhou, H. Zhang, S. Shen, and W. Wang, J. Am. Chem. Soc. 135, 2951 (2013).
- Burrard-Lucas et al. (2013) M. Burrard-Lucas, D. G. Free, S. J. Sedlmaier, J. D. Wright, S. J. Cassidy, Y. Hara, A. J. Corkett, T. Lancaster, P. J. Baker, S. J. Blundell, and S. J. Clarke, Nature Materials 12, 15 (2013).
- Bao et al. (2009) W. Bao, Y. Qiu, Q. Huang, M. A. Green, P. Zajdel, M. R. Fitzsimmons, M. Zhernenkov, M. Fang, B. Qian, E. Vehstedt, J. Yang, H. Pham, L. Spinu, and Z. Mao, Phys. Rev. Lett. 102, 247001 (2009).
- McQueen et al. (2009) T. M. McQueen, Q. Huang, V. Ksenofontov, C. Felser, Q. Xu, H. Zandbergen, Y. S. Hor, J. Allred, A. J. Williams, D. Qu, J. Checkelsky, N. P. Ong, and R. J. Cava, Phys. Rev. B 79, 014522 (2009).
- Bao et al. (2011) W. Bao, Q. Huang, G. F. Chen, M. A. Green, D. M. Wang, J. B. He, X. Q. Wang, and Y. Qiu, Chin. Phys. Lett. 28, 086104 (2011).
- Ye et al. (2011) F. Ye, S. Chi, W. Bao, X. F. Wang, J. J. Ying, X. H. Chen, H. D. Wang, C. H. Dong, and M. H. Fang, Phys. Rev. Lett. 107, 137003 (2011).
- Mizuguchi et al. (2011) Y. Mizuguchi, H. Takeya, Y. Kawasaki, T. Ozaki, S. Tsuda1, T. Yamaguchi, and Y. Takano, Appl. Phys. Lett. 98, 042511 (2011).
- Krzton-Maziopa et al. (2011) A. Krzton-Maziopa, Z. Shermadini, E. Pomjakushina, V. Pomjakushin, M. Bendele, A. Amato, R. Khasanov, H. Luetkens, and K. Conder, J. Phys.: Condens. Mat. 23, 052203 (2011).
- Wang et al. (2011a) A. F. Wang, J. J. Ying, Y. J. Yan, R. H. Liu, X. G. Luo, Z. Y. Li, X. F. Wang, M. Zhang, G. J. Ye, P. Cheng, Z. J. Xiang, and X. H. Chen, Phys. Rev. B 83, 060512 (2011a).
- Fang et al. (2011) M. Fang, H. Wang, C. Dong, Z. Li, C. Feng, J. Chen, and H. Yuan, Europhys. Lett. 94, 27009 (2011).
- Wang et al. (2011b) H. Wang, C. Dong, Z. Li, S. Zhu, Q. Mao, C. Feng, H. Q. Yuan, and M. Fang, Europhys. Lett. 93, 47004 (2011b).
- Zhang et al. (2011) Y. Zhang, L. X. Yang, M. Xu, Z. R. Ye, F. Chen, C. He, J. Jiang, B. P. Xie, J. J. Ying, X. F. Wang, X. H. Chen, J. P. Hu, and D. L. Feng, Nature Mater. 10, 273 (2011).
- Sabrowsky et al. (1986) H. Sabrowsky, M. Roshenberg, D. Welz, P. Deeppe, and W. Schafer, J. Mag. Mag. Mater. 54-57, 1497 (1986).
- Haggström et al. (1986) L. Haggström, H. R. Verma, S. Bjarman, and R. Wäppling, J. Solid State Chem. 63, 401 (1986).
- Zavalij et al. (2011) P. Zavalij, W. Bao, X. F. Wang, J. J. Ying, X. H. Chen, D. M. Wang, J. B. He, X. Q. Wang, G. Chen, P.-Y. Hsieh, Q. Huang, and M. A. Green, Phys. Rev. B 83, 132509 (2011).
- Wang et al. (2011c) D. M. Wang, J. B. He, T.-L. Xia, and G. F. Chen, Phys. Rev. B 83, 132502 (2011c).
- Mou et al. (2011) D. Mou, S. Liu, X. Jia, J. He, Y. Peng, L. Zhao, L. Yu, G. Liu, S. He, X. Dong, J. Zhang, H. Wang, C. Dong, M. Fang, X. Wang, Q. Peng, Z. Wang, S. Zhang, F. Yang, Z. Xu, C. Chen, and X. J. Zhou, Phys. Rev. Lett. 106, 107001 (2011).
- Wang et al. (2011d) X.-P. Wang, T. Qian, P. Richard, P. Zhang, J. Dong, H.-D. Wang, C.-H. Dong, M.-H. Fang, and H. Ding, Europhys. Lett. 93, 57001 (2011d).
- Berlijn et al. (2012) T. Berlijn, P. J. Hirschfeld, and W. Ku, Phys. Rev. Lett. 109, 147003 (2012).
- Bacsa et al. (2011) J. Bacsa, A. Ganin, Y. Takabayashi, K. Christensen, K. Prassides, M. Rosseinsky, and J. Claridge, Chem. Sci. 2, 1054 (2011).
- Bao et al. (2013) W. Bao, G. N. Li, Q. Huang, G. F. Chen, J. B. He, M. A. Green, Y. Qiu, D. M. Wang, J. L. Luo, and M. M. Wu, Chin. Phys. Lett. 30, 027402 (2013).
- Cao and Dai (2011) C. Cao and J. Dai, Phys. Rev. Lett. 107, 056401 (2011).
- Yan et al. (2011) X.-W. Yan, M. Gao, Z.-Y. Lu, and T. Xiang, Phys. Rev. B 83, 233205 (2011).
- Aeppli et al. (1988) G. Aeppli, E. Bucher, C. Broholm, J. K. Kjems, J. Baumann, and J. Hufnagl, Phys. Rev. Lett. 60, 615 (1988).
- Pratt et al. (2009) D. K. Pratt, W. Tian, A. Kreyssig, J. L. Zarestky, S. Nandi, N. Ni, S. L. Bud’ko, P. C. Canfield, A. I. Goldman, and R. J. McQueeney, Phys. Rev. Lett. 103, 087001 (2009).
- de la Cruz et al. (2008) C. de la Cruz, Q. Huang, J. W. Lynn, J. Li, W. Ratcliff, J. L. Zarestky, H. A. Mook, G. F. Chen, J. L. Luo, N. L. Wang, and P. Dai, Nature 453, 899 (2008).
- Huang et al. (2008) Q. Huang, Y. Qiu, W. Bao, M. Green, J. Lynn, Y. Gasparovic, T. Wu, G. Wu, and X. H. Chen, Phys. Rev. Lett. 101, 257003 (2008).
- Qiu et al. (2008) Y. Qiu, W. Bao, Q. Huang, T. Yildirim, J. Simmons, M. Green, J. Lynn, Y. Gasparovic, J. Li, T. Wu, G. Wu, and X. Chen, Phys. Rev. Lett. 101, 257002 (2008).
- Yildirim (2008) T. Yildirim, Phys. Rev. Lett. 101, 057010 (2008).
- Lv et al. (2011) W. Lv, W.-C. Lee, and P. Phillips, Phys. Rev. B 84, 155107 (2011).
- Yin et al. (2012) W.-G. Yin, C.-H. Lin, and W. Ku, Phys. Rev. B 86, 081106(R) (2012).
- Bao (2013) W. Bao, Chin. Phys. B 22, 087405 (2013).
- Thampy et al. (2012) V. Thampy, J. Kang, J. A. Rodriguez-Rivera, W. Bao, A. T. Savici, J. Hu, T. J. Liu, B. Qian, D. Fobes, Z. Q. Mao, C. B. Fu, W. C. Chen, Q. Ye, R. W. Erwin, T. R. Gentile, Z. Tesanovic, and C. Broholm, Phys. Rev. Lett. 108, 107002 (2012).
- Zaliznyak et al. (2011) I. A. Zaliznyak, Z. Xu, J. M. Tranquada, G. Gu, A. M. Tsvelik, and M. B. Stone, Phys. Rev. Lett. 107, 216403 (2011).
- Liu et al. (2010) T. Liu, B. Q. J. Hu, D. Fobes, Z. Mao, W. Bao, M. Reehuis, S. Kimber, K. Prokes, S. Matas, D. Argyriou, A. Hiess, A. Rotaru, H. Pham, L. Spinu, Y. Qiu, V. Thampy, A. Savici, J. A. Rodriguez, and C. Broholm, Nature Mat. 9, 716 (2010).
- Zhao et al. (2012) J. Zhao, H. Cao, E. Bourret-Courchesne, D.-H. Lee, and R. J. Birgeneau, Phys. Rev. Lett. 109, 267003 (2012).
- Chi et al. (2013) S. Chi, F. Ye, W. Bao, M. Fang, H. D. Wang, C. H. Dong, A. T. Savici, G. E. Granroth, M. B. Stone, and R. S. Fishman, Phys. Rev. B 87, 100501(R) (2013).
- Yan et al. (2012) Y. J. Yan, M.Zhang, A. F. Wang, J. J. Ying, Z. Y. Li, W. Qin, X. G. Luo, J. Q. Li, J. Hu, and X. H. Chen, Sci. Rep. 2, 212 (2012).
- Wang et al. (2011e) Z. Wang, Y. J. Song, H. L. Shi, Z. Wang, Z.Chen, H. F. Tian, G. F. Chen, J. Guo, H. X. Yang, and J. Q. Li, Phys. Rev. B 83, 140505 (2011e).
- Chen et al. (2011) Z. G. Chen, R. H. Yuan, T. Dong, G. Xu, Y. G. Shi, P. Zheng, J. L. Luo, J. G. Guo, X. L. Chen, and N. L. Wang, Phys. Rev. B 83, 220507 (2011).
- Zhang et al. (2012) A. M. Zhang, J. H. Xiao, J. B. He, D. M. Wang, G. F. Chen, and Q. M. Zhang, Phys. Rev. B 85, 024518 (2012).
- Ke et al. (2012) L. Ke, M. van Schilfgaarde, and V. Antropov, Phys. Rev. B 86, 020402(R) (2012).
- Wang et al. (2012a) M. Wang, C. Li, D. L. Abernathy, Y. Song, S. V. Carr, X. Lu, S. Li, Z. Yamani, J. Hu, T. Xiang, and P. Dai, Phys. Rev. B 86, 024502 (2012a).
- Xiao et al. (2013) Y. Xiao, S. Nandi, Y. Su, S. Price, H.-F. Li, Z. Fu, W. Jin, A. Piovano, A. Ivanov, K. Schmalzl, W. Schmidt, T. Chatterji, T. Wolf, and T. Brückel, Phys. Rev. B 87, 140408 (2013).
- Wang et al. (2011f) M. Wang, C. Fang, D.-X. Yao, G. Tan, L. W. Harriger, Y. Song, T. Netherton, C. Zhang, M. Wang, M. B. Stone, W. Tian, J. Hu, and P. Dai, Nat. Commun. 2, 580 (2011f).
- Taylor et al. (2013) A. E. Taylor, S. J. Sedlmaier, S. J. Cassidy, E. A. Goremychkin, R. A. Ewings, T. G. Perring, S. J. Clarke, and A. T. Boothroyd, Phys. Rev. B 87, 220508 (2013).
- Sun et al. (2012) L. L. Sun, X. J. Chen, J. Guo, P. W. Gao, Q. Z. Huang, H. D. Wang, M. H. Fang, X. L. Chen, G. F. Chen, Q. Wu, C. Zhang, D. C. Gu, X. L. Dong, L. Wang, K. Yang, A. G. Li, X. Dai, H. K. Mao, and Z. X. Zhao, Nature 483, 67 (2012).
- Shoemaker et al. (2012) D. P. Shoemaker, D. Y. Chung, H. Claus, M. C. Francisco, S. Avci, A. Llobet, and M. G. Kanatzidis, Phys. Rev. B 86, 184511 (2012).
- Ricci et al. (2011) A. Ricci, N. Poccia, G. Campi, B. Joseph, G. Arrighetti, M. R. L. Barba, M. Burghammer, H. Takeya, Y. Mizuguchi, Y. Takano, M. Colapietro, N. L. Saini, and A. Bianconi, Phys. Rev. B 84, 060511(R) (2011).
- Liu et al. (2012) Y. Liu, Q. Xing, K. W. Dennis, R. W. McCallum, and T. A. Lograsso, Phys. Rev. B 86, 144507 (2012).
- Charnukha et al. (2012) A. Charnukha, A. Cvitkovic, T. Prokscha, D. Pröpper, N. Ocelic, A. Suter, Z. Salman, E. Morenzoni, J. Deisenhofer, V. Tsurkan, A. Loidl, B. Keimer, and A. V. Boris, Phys. Rev. Lett. 109, 017003 (2012).
- Wang et al. (2012b) C. N. Wang, P. Marsik, R. Schuster, A. Dubroka, M. Rössle, C. Niedermayer, G. D. Varma, A. F. Wang, X. H. Chen, T. Wolf, and C. Bernhard, Phys. Rev. B 85, 214503 (2012b).
- Ksenofontov et al. (2011) V. Ksenofontov, G. Wortmann, S. A. Medvedev, V. Tsurkan, J. Deisenhofer, A. Loidl, and C. Felser, Phys. Rev. B 84, 180508 (2011).
- Zhang et al. (2013) A. M. Zhang, T. L. Xia, K. Liu, W. Tong, Z. R. Yang, and Q. M. Zhang, Sci. Rep. 3, 1216 (2013).
- Texier et al. (2012) Y. Texier, J. Deisenhofer, V. Tsurkan, A. Loidl, D. S. Inosov, G. Friemel, and J. Bobroff, Phys. Rev. Lett. 108, 237002 (2012).
- Guo et al. (2012) J. Guo, X.-J. Chen, J. Dai, C. Zhang, J. Guo, X. Chen, Q. Wu, D. Gu, P. Gao, L. Yang, K. Yang, X. Dai, H. kwang Mao, L. Sun, and Z. Zhao, Phys. Rev. Lett. 108, 197001 (2012).
- Gooch et al. (2011) M. Gooch, B. Lv, L. Z. Deng, T. Muramatsu, J. Meen, Y. Y. Xue, B. Lorenz, and C. W. Chu, Phys. Rev. B 84, 184517 (2011).
- Ye et al. (2014) F. Ye, W. Bao, S. Chi, A. M. dos Santos, J. J. Molaison, M. Fang, H. Wang, Q. Mao, J. Wang, J. Liu, and J. Sheng, arXiv:1405.4020 (2014).
- Ksenofontov et al. (2012) V. Ksenofontov, S. A. Medvedev, L. M. Schoop, G. Wortmann, T. Palasyuk, V. Tsurkan, J. Deisenhofer, A. Loidl, and C. Felser, Phys. Rev. B 85, 214519 (2012).
- Yu et al. (2011) W. Yu, L. Ma, J. B. He, D. M. Wang, T.-L. Xia, G. F. Chen, and W. Bao, Phys. Rev. Lett. 106, 197001 (2011).