The detection rate of early UV emission from supernovae:
A dedicated GALEX/PTF survey and calibrated theoretical estimates
Abstract
The radius and surface composition of an exploding massive star, as well as the explosion energy per unit mass, can be measured using early UV observations of core collapse supernovae (SNe). We present the first results from a simultaneous GALEX/PTF search for early UV emission from SNe. Six Type II SNe and one Type II superluminous SN (SLSN-II) are clearly detected in the GALEX NUV data. We compare our detection rate with theoretical estimates based on early, shock-cooling UV light curves calculated from models that fit existing Swift and GALEX observations well, combined with volumetric SN rates. We find that our observations are in good agreement with calculated rates assuming that red supergiants (RSGs) explode with fiducial radii of 500 R⊙, explosion energies of erg, and ejecta masses of 10 M⊙. Exploding blue supergiants and Wolf-Rayet stars are poorly constrained. We describe how such observations can be used to derive the progenitor radius, surface composition and explosion energy per unit mass of such SN events, and we demonstrate why UV observations are critical for such measurements. We use the fiducial RSG parameters to estimate the detection rate of SNe during the shock-cooling phase ( d after explosion) for several ground-based surveys (PTF, ZTF, and LSST). We show that the proposed wide-field UV explorer ULTRASAT mission, is expected to find SNe per year ( SN per deg2), independent of host galaxy extinction, down to an NUV detection limit of mag AB. Our pilot GALEX/PTF project thus convincingly demonstrates that a dedicated, systematic SN survey at the NUV band is a compelling method to study how massive stars end their life.
1 Introduction
Massive stars explosively end their life in a Core Collapse Supernova (CC SN). Few solid facts are known about SN progenitors. Hydrogen-rich Type II SNe (and in particular, Type II-P) are firmly associated with red supergiant (RSG) progenitors, while rare underluminous SNe II (e.g., SN 1987A) may arise from blue superiants (BSG). Other classes of core-collapse SNe that are depleted in hydrogen (e.g., Types Ib, Ic) probably arise from stripped stars, such as Wolf-Rayet (W-R) stars, but the exact mapping is unknown; see Filippenko (1997) and Smartt (2009) for reviews of SN types and progenitors, respectively. The final stages of massive star evolution and the physics of the explosion are also poorly understood, see, e.g., Langer (2012) and references therein.
Although there are numerous SN detections every year (Gal-Yam et al. 2013), most events are discovered a long time (days) after the explosion of the star. This delay is unfortunate since radiation emitted during the first few days after SN explosion is governed by relatively simple physics: recombination and line opacity are negligible and in most cases so is radioactivity. This early emission encodes crucial information about the outer envelope of the exploding star (approximately its outer M⊙) that can be extracted from robust and simple models. Exploring this outer shell mass is very interesting as it is it that determines the stellar radius and outer density profile of the star, and its properties can be used to study currently poorly-known stellar physics such as the mixing length and convection parameters. Observations starting only after this early period thus result in loss of this information about the supernova progenitor star and the explosion mechanism itself. Only a handful of events were detected during this early phase (e.g. Arnett et al. 1989; Schmidt et al. 1993; Campana et al. 2006; Soderberg et al. 2008; Gezari et al. 2008,2010; Schawinski et al. 2008; Arcavi et al. 2011; Cao et al. 2013; Gal-Yam et al. 2011; 2014), and even in these cases the time resolution of the measurements is generally too poor to form a well-sampled light curve.
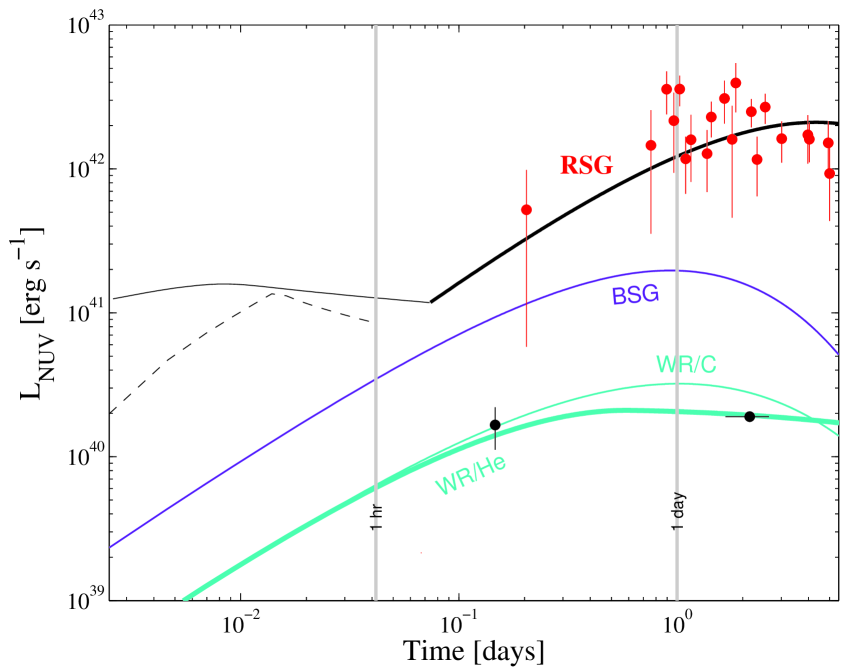
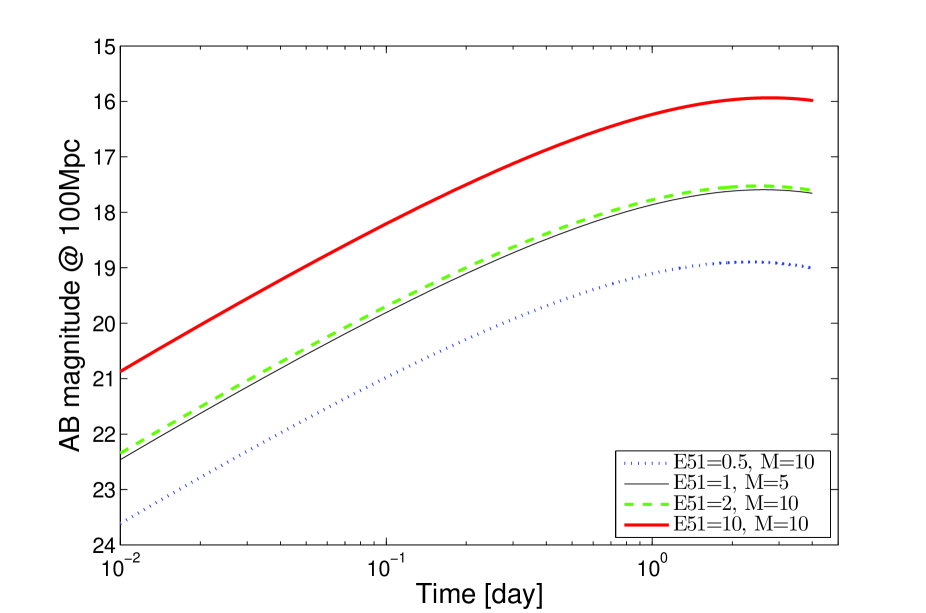
An early detection of the SN and a measurement of its light curve are useful to understand the physics of the explosion itself, and its progenitor properties. The first light escaping from an exploding star emerges as a shock breakout flare, with a hot spectrum peaking in the ultra-violet (UV) or X-ray bands. Models for this shock breakout emission have a long history (e.g., Colgate 1974; Grassberg et al. 1971; Falk 1978; Klein & Chevalier 1978; Ensman & Burrows 1992, Matzner & McKee 1999). In recent years several theoretical models were developed in order to describe emerging observations of the explosion shock breakout (e.g., Nakar & Sari 2010; Sapir et al. 2011; Katz et al. 2012; Sapir et al. 2013). Fig. 1 shows that exact analytic and numerical solutions by Sapir et al. (2013) are in general agreement with analytic models by Nakar & Sari (2010) after appropriate rescaling111To correct the NS10 formulae we divided the luminosity in their equations 29, 32 and 39 by a factor of 2.5. (E. Nakar; Personal Communication). of the latter. However, only a single such flare has been serendipitously observed (Soderberg et al. 2008) and the relevant theory is virtually untested. If detected, shock breakout flares provide a direct measure of the pre-explosion stellar radius R∗: the flare duration scales as R∗/c, and the integrated luminosity as R (Klein & Chevalier 1978; Katz et al. 2012).
Following an initial shock breakout flare (i.e., at times h post-explosion), the expanding stellar envelope emits a fraction of the leftover stored explosion energy during the shock cooling phase, initially peaking in the UV. This phase is better understood theoretically (e.g., Grassberg et al. 1971; Chevalier 1976, 1992; Chevalier & Frensson 1998) and has been observed in a few cases (by GALEX, Schawinski et al. 2008, Gezari et al. 2008; and by Swift, Soderberg et al. 2008; data shown as red and black circles in Fig. 1). The shock cooling phase is longer and more luminous in larger stars. These works and, in particular, more recent models (e.g. Nakar & Sari 2010, hereafter NS10; Rabinak & Waxman 2011, hereafter RW11) demonstrate that the shock breakout and subsequent cooling phases during the first days after explosion encode information about the SN progenitor radius and surface composition, the explosion energy per unit mass, and the line of sight extinction (see below for details). This is strong motivation to design surveys targeting early UV emission from SNe. In this paper we use the results of a pilot PTF/GALEX survey to robustly estimate the number of early SN detections expected from such surveys.
We review the derivation of physical progenitor and SN parameters from early observations of SNe in and describe a sample of SNe with early UV emission detected by a GALEX/PTF wide-field experiment in . We summarize our implementation of theoretical models in and show that these fit the handful of available data. We then combine these models with volumetric SN rates to estimate the expected number of detections from the GALEX experiment we conducted in , show our fiducial models fit the observations well, and provide validated predictions for the proposed ULTRASAT space mission (Sagiv et al. 2014). We conclude in .
2 Motivation: deriving SN progenitor properties from early UV emission
The early shock-cooling emission from SNe is governed by simple and well understood physics and can thus be used to derive robust constraints on the physical parameters of the exploding star and of the explosion. Roughly, the rise-time to peak determines the progenitor radius , the peak flux determines the explosion energy per unit ejecta mass , and the post-peak light curve constrains the surface composition (RW11). This simple physics description holds as long as the temperature in the emitting region is eV (see RW11 for details222Several complications, that prevent the construction of a simple and robust model, arise when the temperature of the emitting region drops below eV (RW11): complicated opacity variations, significant contribution to the luminosity from recombination, and penetration of the photosphere into deep envelope layers, which did not initially (i.e. before the explosion) lie at a very small distance, , from the surface of the star. As long as the emission is dominated by shells with , the luminosity and the color temperature are nearly independent of the pre-explosion density distribution. As the photosphere penetrates deeper, the emission becomes dependent on the details of the density distribution (see the “+” signs in Figs. 2-4 of RW11, indicating the limit of model validity).), for which the emission peak is at . In all optical bands (including the band) the emission peak occurs only after the temperature falls below this threshold value (see Rubin et al. 2015 for detailed discussion). For this reason, the observational photometric parameters (rise-time to peak, peak flux) cannot be related to physical parameters via a simple and robust model, making optical-light observations not useful for this analysis.
For commonly assumed progenitor parameters, shock breakout is expected to be accompanied by soft ( keV) X-ray emission with luminosity of () for BSG (RSG/He-WR) progenitors (Sapir, Katz & Waxman 2013). However, the ability to use X-ray observations to constrain progenitor and explosion parameters is limited by several factors.
(i) First, the theory of X-ray emission from massive star explosions is not sufficiently well understood to ensure that stellar/explosion parameters can be reliably constrained based on X-ray observations. This is reflected, for example, by the fact that none of the few X-ray detections can be explained as shock breakout from a stellar edge (e.g., Sapir et al. 2013); these rather require more complex structures (such as winds or extended envelopes, e.g., Campana et al. 2006; Moriya et al. 2015).
(ii) Second, the detection rate of X-ray breakouts is expected to be very low, even for future instruments with order of magnitude better sensitivities than past or current instruments. The non-detection of the predicted soft X-ray breakout signal of BSG explosions (which are expected to dominate the detection event rate) in archival searches of ROSAT (Vikhlinin 1998) and XMM (Law et al. 2004) data imply an upper limit of on the rate of such events (Sapir et al. 2013; Sapir & Halbertal 2014) which is about two orders of magnitude lower than the expected BSG explosion rate. This discrepancy may be related to the above mentioned tension between model predictions and observations, or to high obscuration of the explosions. In any case, it implies that a soft X-ray detector with a 1 sr FOV and sensitivity of (over s) will detect events per year (consistent with the null detection of such events so far by MAXI; Camp et al. 2013). In a similar manner we can estimate the detection rate of early X-ray emission from SNe from the discovery of the early X-ray signal from SN 2008D by Soderberg et al. (2008). SWIFT-XRT could detect SN 2008D-like events out to Mpc (Soderberg 2008). Even future wide-field Lobster telescopes will have a sensitivity which is times less than XRT (Camp et al. 2013), and thus would detect such events only to Mpc. This implies that even if the X-ray breakout rate is as high as the entire core-collapse SN rate, Mpc-3 y-1, such a future mission would detect 3 events per year (for an all sky detector).
(iii) Finally, we note that massive star explosions associated with strong high-energy short transients, gamma-ray bursts (GRB) and X-ray flashes (XRF), like SN 2006aj (Campana et al. 2006), are both not understood theoretically and are very rare in the volumetric sense, as they account for of core-collapse SNe (e.g., Podsiadlowski et al. 2004). The detection of such events cannot therefore be used to study the general properties of SN progenitor/explosion parameters.
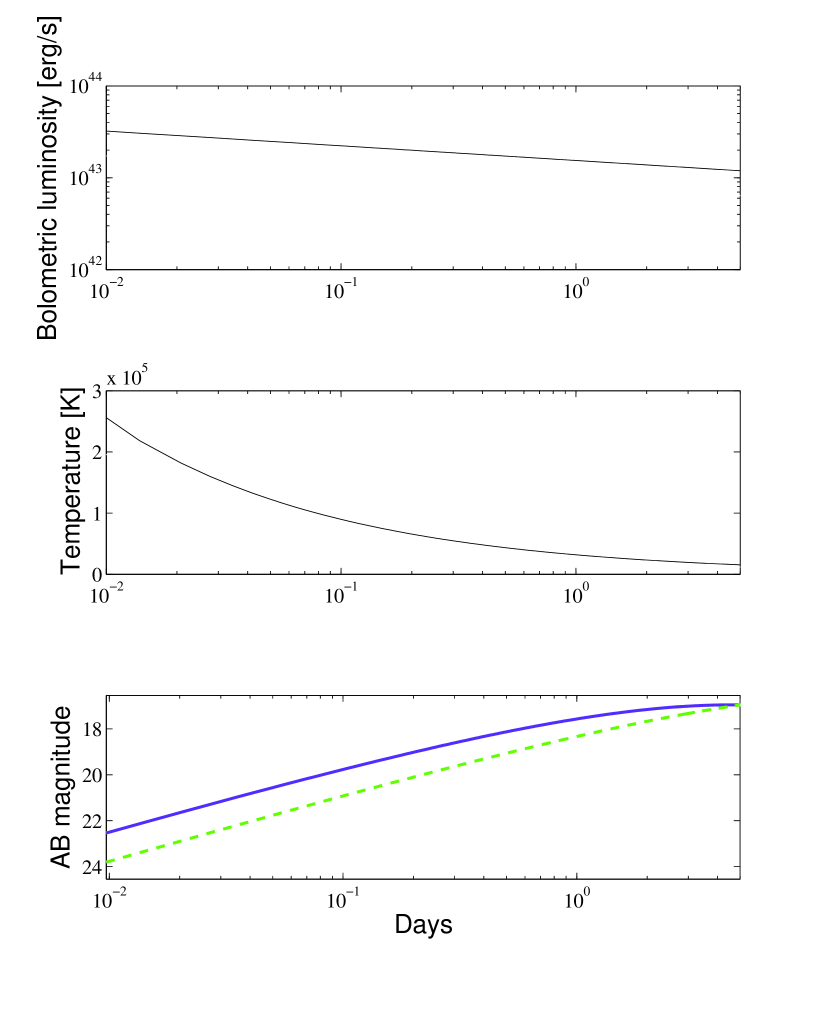
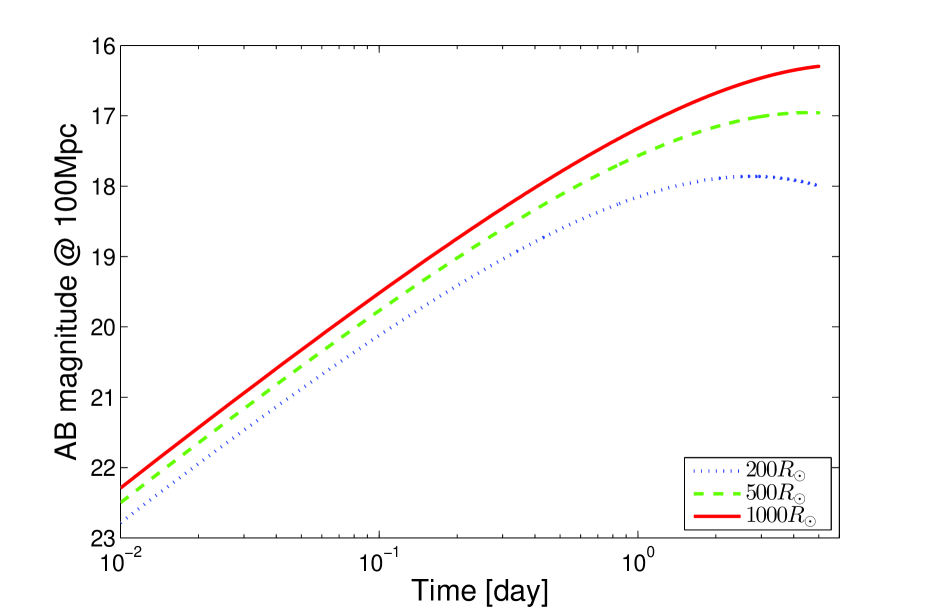
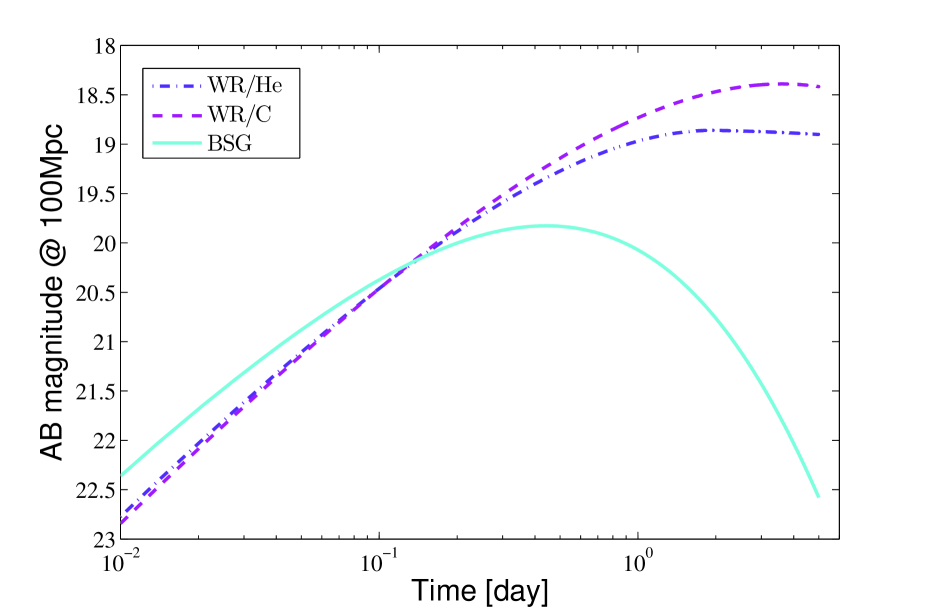
Thus, there is strong motivation to study early SN emission in the UV. The bolometric luminosity of the early UV emission from SNe remains nearly constant, while the temperature of the cooling, expanding gas declines with time. In any given band, the measured flux will rise as the peak of the emitted spectrum cools and approaches the band center, reaching maximum when the spectral peak is within the band, then declines as further cooling drives the emission peak to redder wavelengths (Fig. 2; see an animated version on http://www.weizmann.ac.il/astrophysics/ultrasat/animations/ganot14a.gif). The rate of cooling (and thus the time it takes for the flux to peak in a given band) depends on the stellar radius and the composition of the envelope which determines the opacity. For supergiant explosions with thick hydrogen envelopes, the opacity is known (Thomson scattering) and time independent, so the radius is straightforwardly inferred (Fig. 3). For evolved (e.g., W-R) stars the opacity is a function of the surface composition (mass fraction of He, C and O). RW11 show that, given a well-sampled UV light curve, one can infer the stellar radius and constrain the surface composition (Fig. 4).
Model calculations such as those of RW11 above assume standard massive star models and this leads to the prediction of a nearly-constant shock-cooling luminosity. However, some recent works hint that at least some stars undergo violent pre-explosion evolution, e.g., eruptive mass loss (e.g., Pastorello et a. 2007; Ofek et al. 2013, 2014a, Gal-Yam et al. 2014) and thus their pre-explosion density distribution may strongly deviate from standard models. In this case the shock-cooling luminosity will not be constant.
However, RW11 also show that by combining UV and optical data one can determine the exact extinction towards an event and, correcting for it, measure both the temperature evolution and the radius without any assumptions regarding a constant shock-cooling luminosity. For such events, the luminosity and temperature evolution extracted from the UV+optical data will then measure the non-standard density profile, mapping recent pre-explosion mass loss and the physics of the final stages of stellar evolution.
In all cases, the extinction-corrected absolute luminosity evolution can be used to derive the energy per unit mass in the exploding ejecta (E/M), yet another vital constraint on the explosion (Fig. 5). The full route from UV light curves to physical stellar parameters has been demonstrated for (the only) three SN events with useful data (Types II and Ib; Schawinski et al. 2008; Gezari et al. 2008; Soderberg et al. 2008) by RW11.
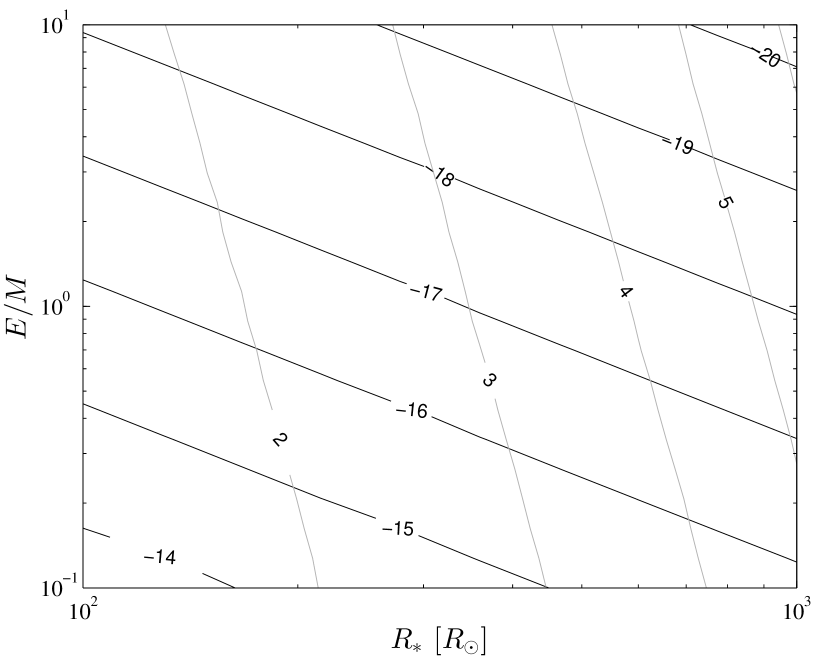
Fig. 6 shows how the progenitor radius and the explosion energy per unit mass can be directly derived from measurements of the UV peak absolute magnitude and rise time. Useful formulae to connect the observed parameters to RW11 model parameters are provided below, for radii R∗ measured in units of the solar radius R⊙, energy E in units of erg and normalized to ejecta masses of M⊙. We provide formulae for the absolute magnitude in the ULTRASAT band (M), as well as for the Swift UVW1 and UVW2 bands (M, M). The rise time trise is defined as the time in days it takes the UV magnitude to rise by 1 magnitude to peak.
| (1) |
| (2) |
| (3) |
| (4) |
| (5) |
| (6) |
Early UV emission is thus a powerful way to study the progenitor properties of SNe, motivating efforts to measure it systematically for a large sample of SN events by wide-field UV surveys. We will now provide estimates of the expected SN detection rates by such surveys using observations and theory.
3 The GALEX/PTF wide-field, shallow UV variability survey
3.1 Survey description
We conducted a UV wide-field transient survey during a nine week period from 2012 May 24 through 2012 July 28. This survey used the GALEX NUV camera to cover a total area of 600 square degrees. Operating in scanning mode, the GALEX NUV camera observed strips of sky in a drift-scan mode with an effective average integration time of s, reaching a NUV limiting magnitude of mag AB. Each strip was visited once every 3 days. In parallel, we observed the same area with the Palomar Transient Factory (PTF; Law et al. 2009; Rau et al. 2009) in -band, reaching a limiting magnitude of R mag AB with a cadence of 2 days, weather permitting.
The main scientific goals of this survey were to study the early UV emission from SNe (this work; Ganot et al. 2015, in prepartion), AGN variability, stellar activity (flares) and white dwarf variability. We estimate the completeness of this survey to SNe exploding in the FOV and above the limiting magnitude (at some time) at mainly due to the combined effects of GALEX data loss due to failed downlink and image corruption (about ), PTF weather losses and PTF survey incompleteness ( compounded). A full description of this survey, its completeness and its results will be presented in a series of forthcoming papers.
3.2 Detected SN sample
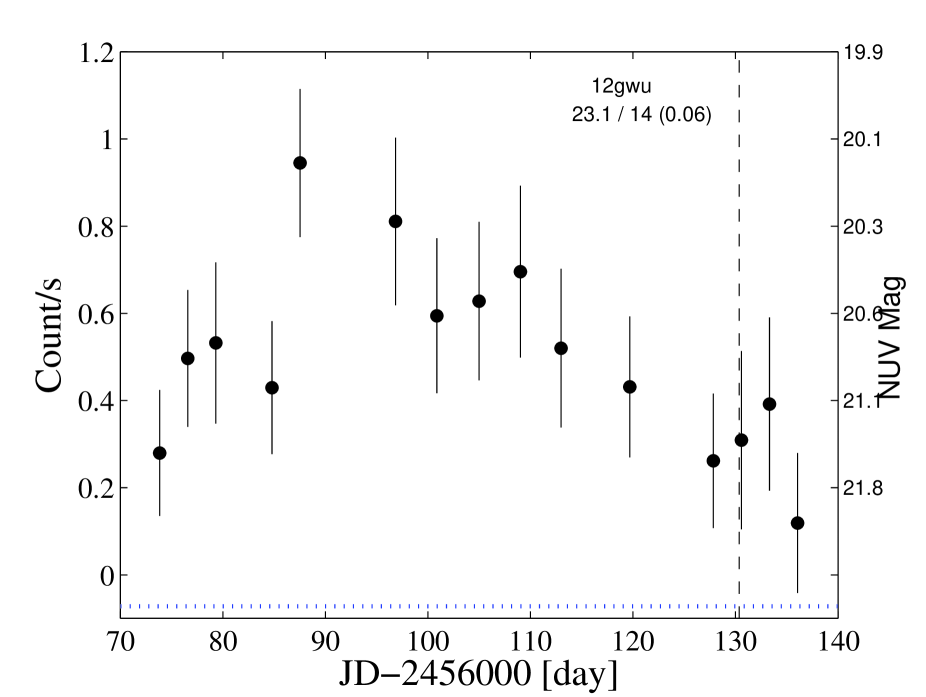
In this initial work we limit our analysis to the sample of spectroscopically-confirmed SNe detected with PTF within the GALEX field of view during the survey period. The SN sample includes 33 Type Ia SNe that will be presented elsewhere as well as 10 core-collapse SNe. We list these core-collapse SNe in Table 1, and review their properties below. Interestingly, our survey also detected a distant superluminous SN of Type II (SLSN-II; Gal-Yam 2012) at . This remarkable event (PTF12gwu; Fig. 8) will be the subject of a separate publication. All of these events were spectroscopically classified as part of PTF operations and redshifts were measured from host galaxy lines (except for a single case, PTF12fkp, where the redshift is determined at lower accuracy from the SN lines).
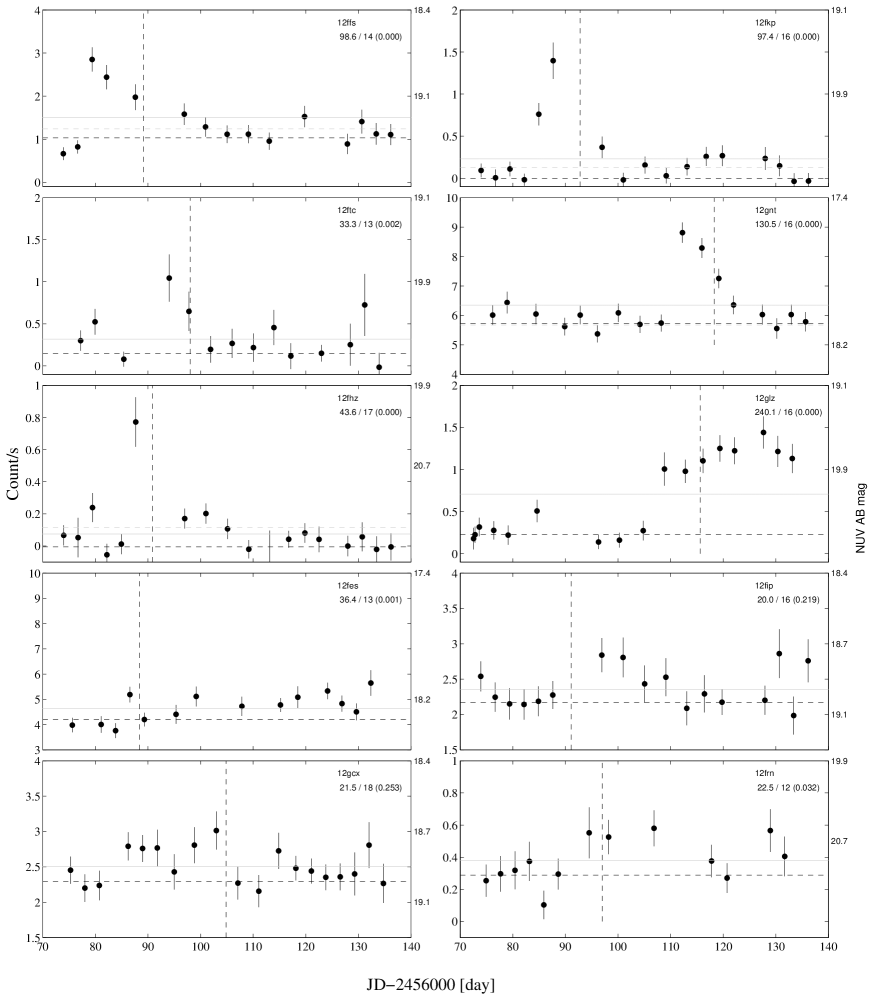
We show the GALEX NUV light curves of the ten core-collapse SNe in Fig. 7. GALEX UV photometry was measured at the PTF SN locations using custom aperature photometry routines (Ofek 2014). We used an aperture of 5 pixels (). The sky was measured in an annulus with inner and outer radii of 20 and 50 pixels, and we used a zero point of mag and an aperture correction of mag for the GALEX NUV camera (Morrissey et al. 2007). The photometry is marked by solid circles with 1 error bars. PTF discovery dates are marked with vertical lines. Blue dotted horizontal lines indicate the flux level measured at these locations in pre-explosion GALEX data obtained prior to the start of our experiment. When such past imaging is not in hand, we indicate with dashed horizontal lines the quiescent flux level as measured from our GALEX data (the precentile flux level, to avoid contamination by the SN flare emission). To assess detection significance we calculated the and number of degrees of freedom obtained when fitting the data with a constant flux level, noted below each object name in Fig. 7, where we also report in parenthesis the resulting false positive probability (FPA). Six events show clear UV flares (top panels; low FPA). Only four objects show no significant UV flare emission (bottom panels). Of those four events, two (PTF12fip and PTF12gcx) are consistent with a constant flux (solid grey line). Two other events (PTF12fes and PTF12frn) are inconsistent with a constant flux (low FPA) but show no clear flare-like structure. We conclude that 6 GALEX events are robustly detected.
Of those six, PTF photometry and spectroscopy indicates that they all are Type II SNe (2 SNe II-P, 1 intermediate II-P/L, 1 II-L, 1 IIn and 1 IIb; Table 1). The mean redshift of the GALEX-detected sample, as well as of the entire set of core-collapse SNe is . Interestingly, of the six GALEX-detected SNe only one occurred in a luminous host, while four are located in dwarf galaxies, only marginally detected in our GALEX NUV observations. This indicates that for NUV-detected core-collapse SNe, the host galaxy light contribution to the background is typically negligible. Most events are detected only during a small number of GALEX epochs (1-3) around their PTF discovery date, while the single detected Type IIn SN shows a prolonged period of UV luminosity extending beyond the duration of our survey period. Interestingly, in all cases the first UV detections occur prior to the optical discovery by PTF, elucidating the superiority of the UV over the optical for early SN studies.
We note that one out of these 6 events (PTF12glz) is a luminous Type IIn SN and displays a prolonged UV emission. The light curves of such events were suggested to be powered, at early times, via the explosion shock breaking out from a spatially extended opaque wind, rather than from the surface of a star (Ofek et al. 2010) and the decaying part is presumably due to the conversion of kinetic energy to optical luminosity (see also Chevalier & Irwin 2011; 2012; Balberg & Loeb 2011; Moriya & Tominaga 2012; Ginzburg & Balberg 2012; Ofek et al. 2014b and Svirski & Nakar 2014). Such events are relatively rare in the volumetric sense, but their detectability to larger distances compensates for this in flux-limited surveys. Out results indicate that in shallow UV surveys such events will constitute of the sample. An extreme such case are SLSNe that are so UV-luminous that they are detected over a huge volume, and may have similar detection rates (by number).
A brief report about these events was presented in Barlow et al. (2013), and a detailed analysis will be presented in Ganot et al. (2015, in preparation) and additional future publications.
| PTF name | RA | Dec | Redshift | Type | PTF discovery date |
| PTF12ffs | 14:42:07.33 | +09:20:29.8 | 0.0511 | SN IIa | June 10, 2012 |
| PTF12fhz | 15:18:20.09 | +10:56:42.7 | 0.0987 | SN IIb | June 12, 2012 |
| PTF12fkp | 14:46:54.81 | +10:31:26.4 | 0.12 | SN II-L | June 14, 2012 |
| PTF12ftc | 15:05:01.88 | +20:05:54.6 | 0.0732 | SN II-P | June 19, 2012 |
| PTF12glz | 15:54:53.04 | +03:32:07.5 | 0.0799 | SN IIn | July 7, 2012 |
| PTF12gnt | 17:27:47.30 | +26:51:22.1 | 0.029 | SN II-P | July 9, 2012 |
| PTF12fes | 16:00:35.13 | +15:41:03.5 | 0.0359 | SN Ib | June 9, 2012 |
| PTF12fip | 15:00:51.04 | +09:20:25.1 | 0.034 | SN II-P | June 12, 2012 |
| PTF12frn | 16:22:00.16 | +32:09:38.9 | 0.136 | SN IIn | June 18, 2012 |
| PTF12gcx | 15:44:17.32 | +09:57:43.1 | 0.045 | SN IIb | June 26, 2012 |
-
a
A bright SN II with a light curve intermediate between SNe II-P and II-L
-
b
A bright SN II with a very long rise time, similar to SN 1998A (Pastorello et al. 2005), SN 2000cb (Kleiser et al 2011) and SNe 2005ci and 2005dp (Arcavi et al. 2012).
4 Theoretical estimates of early UV emission from SNe
4.1 Light curve models and comparison with data
We have calculate theoretical early UV light curves for SNe in the following manner. We use the analytic formalism of Rabinak & Waxman (2011; RW11), that has been tested against numerical simulations and self-similar solutions and describes available observations well (). Other analytical models (NS10; Chevalier 1992) are broadly similar and using those instead does not alter our derived detection rates. We are careful to correct the typographical error appearing in the RW11 formulae according to the published Erratum (Rabinak & Waxman 2013).
Our calculations include the following steps. First, we calculate the RW11 bolometric luminosity for a set of progenitor parameters (radius R∗; explosion energy E and ejected mass M). The model parameter is set to its suggested value of . We use the Thomson opacity for supergiant stars, and the prescriptions of RW11 for mixed He/C/O envelopes of W-R stars. We corrected the temperature up by a factor of 1.2 as suggested by RW11, to account for the fact that the color temperature is set at Thomson optical depth above unity (see NS10 for an analytic approximation). Using the evolving radius and temperature, we then calculate black-body spectral curves as a function of time. Convolving these spectra with a sensitivity curve for a given observational band (e.g., NUV or optical bands), we calculate the light curve in these bands via synthetic photometry (Ofek 2014).
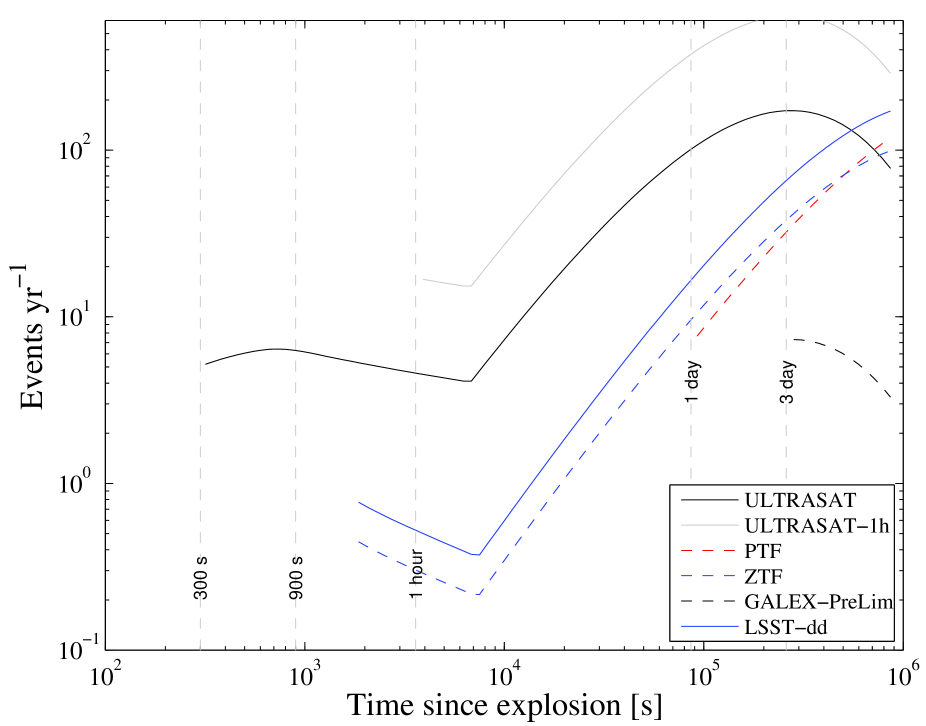
To determine object detectability we now assume a distance as well as a value for Galactic extinction, and calculate the flux from an object as a function of time since explosion, and the distance. This is then translated to a number of detections for a survey with a given sensitivity (depth) in a given band, and a given field of view (e.g., Fig. 9), if we know the volumetric rate of the event in question.
4.2 Volumetric rates
We use the volumetric SN rates from Li et al. (2011). Using a sample of nearby SNe these authors have measured rates for Type II SNe and Type Ib/c SNe of approximately SN Mpc-3 yr-1 and SN Mpc-3 yr-1, respectively. Since Type II SNe typically result from red supergiant stars (Smartt 2009), we normalize our predictions for RSG explosions using the Type II SN rate.
In contrast, the nature of the progenitors of SNe Ib/c is still unclear. While some indications exist that these arise from compact W-R stars (e.g., Corsi et al. 2012, Cao et al. 2013), other events appear to require more extended progenitors with radii well above cm (e.g., SN 2008D, RW11; SN 2006aj, Nakar & Piro 2014). We have thus aribitrarily assigned of the volumetric rate of SNe Ib/c to compact W-R progenitors, and to more extended BSG-like stars. For optical/UV surveys the expected number of early detections of such compact stars are, in any case, small compared to the dominant population of red supergiant explosions.
5 Results
Combining our UV light curve models and the measured SN volumetric rates, we can predict the expected number of detections of various progenitor explosions (RSG, BSG and W-R) as a function of progenitor parameters R∗, E and M. We begin by comparing our predictions with the GALEX/PTF survey we have conducted (), and provide predictions for other space () and ground-based () surveys. We discuss the fractions of SN types in wide-field surveys in based on observed PTF data.
5.1 Predicted rates for the GALEX/PTF experiment and fiducial progenitor parameters
Using the procedure described above, we predict the expected number of early UV detections of Type II SNe in our GALEX/PTF experiment assuming all of these result from RSG progenitors with a single set of fiducial parameters. We set these to be R R⊙, E erg and M M⊙, which agree with typical values for RSG radii and energy and mass estimates for Type II SNe. Using this set of fiducial parameters and the RW11 models, we predict that our survey should have detected 7 SNe (Table 2; assuming it was complete, see above). Comparing this with the actual number of 6 detections (; Fig. 7), we find good agreement with the predictions given the small numbers involved. We conclude that using the set of fiducial RSG model parameters and RW11 models to predict early UV SN detection numbers is validated by our GALEX/PTF experiment.
We calculate the number of BSG and W-R explosions using the parameters R R⊙, E erg and M M⊙ and for W-R stars R R⊙, E erg and M M⊙ and the rates from . Even with these rather optimistic parameters (high E and large R), the predicted number of BSG and W-R explosion detections within the GALEX/PTF experiment is small (). This is consistent with our non detection of early UV emission from SNe Ib/c (or the peculiar SN II PTF12gcx, which we suspect may have had a BSG progenitor). We retain these as fiducial parameters for predictions, but note these are not constrained by our observations.
5.2 Predictions for ULTRASAT
Having in hand a set of calibrated fiducial progenitor parameters for RSGs (R R⊙, E erg, M M⊙; RW11 models) that have been validated by reproducing our GALEX observations, we can now predict the expected rates for the proposed ULTRASAT mission. For BSG and W-R explosions our parameters are poorly constrained by data, so any predictions are tentative, but the rate is expected to be dominated by RSG explosions (and it is). This wide-field UV space explorer has been described in Sagiv et al. (2014), and here we use its current technical formulation, a field of view of 210 square degrees and a 5 limiting sensitivity of mag AB in s integration in the NUV ( nm band).
As can be seen in Table 2, ULTRASAT is predicted to discover the early shock-cooling emission from no less than 110 events per year. Of these, the large majority (100) are expected to be due to RSG explosions. A handful of events (formally 6 per year) are expected to be detected during the shock-breakout phase ( hour after explosion) but we consider this number only as a tentative estimate since the theory of SN emission at this phase has not been tested observationally yet. We note that this prediction does not account for extinction of these SNe in their hosts, but such extinction will not affect the rate prediction. The reason is that we chose our fiducial RSG parameters to match the observed GALEX/PTF rate. If we include an arbitrary mean extinction in our modelling (reducing the expected number in the GALEX experiment), this would drive the RSG parameters towards values with brighter UV flares (larger R or higher E/M) to exactly compensate and return the expected rate to its observed value. The effects of extinction thus cancel out and our predicted rates remain the same.
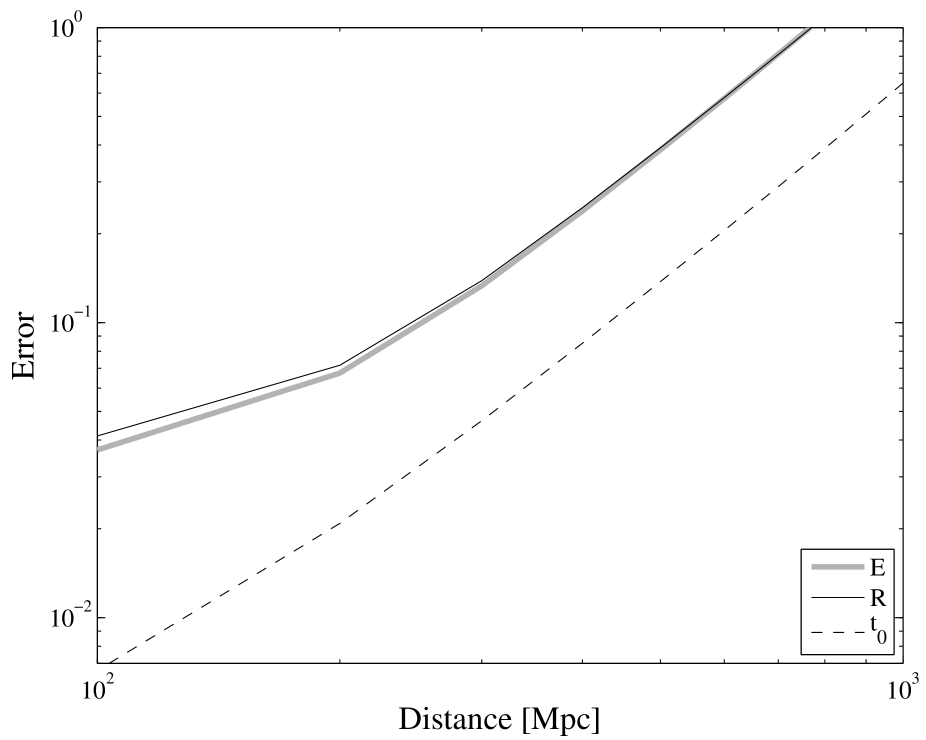
We can estimate the expected accuracy with which we can derive progenitor and explosion parameters from ULTRASAT data in the following manner. For out fiducial RW11 models, we calculate the covariance matrix taking , and the explosion time as free parameters, Poisson errors appropriate for the distance of a given event, its expected luminosity and the ULTRASAT sensitivity (limiting magnitude of M AB Mag during s integrations), as well as systematic errors. The square root of the diagonal elements of the covariance matrix are reported in Fig. 10. As can be seen, ULTRASAT will provide accurate measurements of these parameters (to below out to Mpc).
Another simple, robust and extinction-free lower limit on the ULTRASAT detection rate is obtained by scaling our GALEX results. Our GALEX experiment detected N events in t=2 months, using a survey area of deg2, had a 5 flux sensitivity of S mag AB, and covered a sky area with A mag higher NUV extinction compared to the ULTRASAT NUV-optimized fields. Thus, direct scaling to the ULTRASAT yearly yield would give NN year / 2 months) (SSANUV)3/2 which yields N events y-1. This lower limit is based purely on NUV-detected SNe so it accounts for all sources of extinction. It is also a conservative lower limit since it uses the rate from the GALEX/PTF survey which had a UV cadence of 3 d, compared to the expected ULTRASAT cadence of 900 s. Many short events likely missed by our GALEX/PTF search could be detected by ULTRASAT. Finally, this assumes a efficiency for our GALEX/PTF experiment, while in reality its completeness was no more than (see above). Correcting just for this factor, our lower limit is in good agreement with the theoretical prediction. The formal error on this lower limit is due to Poisson small number statistics related to the GALEX detection number (6). At confidence, this error is by a factor of 2 or less (Gehrels 1986).
We conclude that ULTRASAT is absolutely guaranteed to find explosions of large RSG stars per year using this direct scaling from our GALEX observations, and that this number is with high confidence twice as large. The predicted detection rate for other UV missions operating in a similar wavelength range can be estimated using simple scaling according to field of view and limiting flux , .
An interesting final point is that our GALEX/PTF experiment discovered one superluminous SN (SLSN-II) in two months. Using the same scaling above for ULTRASAT indicates this mission will likely detect SLSNe per year. These will be quite unique in having been discovered early and having UV coverage, which is crucial in order to shed light on the progenitors and power sources of these most energetic and UV-bright objects.
5.3 Predictions for other surveys
The same models we apply above can also be used to predict the expected early SN discovery rate for other experiments, in particular ground-based optical surveys. We note that these surveys would not be able to carry out the science investigation motivated in since, as explained above, it requires early UV data. However, these ground-based surveys could conceivably trigger UV follow-up observations from space (e.g., by Swift or even HST) that will allow progenitor and SN physics to be extracted from early data, at least for a few objects.
The iPTF survey at Palomar Observatory is operating the PTF survey camera and has demonstrated its ability to quickly discover SNe and trigger space-based UV follow-up (Gal-Yam et al. 2011). We calculate the expected number of events for an iPTF survey covering deg2 with a nightly cadence in -band (Table 2). iPTF has a lunation-averaged depth of mag, and we have assumed a temporal efficiency (including loss due to daytime and weather). The predicted yearly yield (9 events) is consistent with iPTF detections of several SNe at ages d so far (e.g., Gal-Yam et al. 2014).
Next, we consider the coming Zwicky Transient Facility (ZTF) that will be using an even larger camera mounted on the same telescope at Palomar Observatory. While the observing strategy of ZTF has not been finalized yet, we consider here a -band survey of deg2 with a cadence of h. We assume this survey will use of the ZTF time, and the same temporal efficiency as above. With a dozen or so events per year, all securely detected at day, ZTF, hopefully coupled with Swift, will be able to provide the first few examples of the science expected from ULTRASAT.
Finally, it is interesting to consider what the Large Synoptic Survey Telescope (LSST) could achieve. Assuming that, as part of a “deep drilling” experiment, LSST will observe a single field of view at any given time repeatedly every h in the -band with a lunation-averaged depth of mag and a temporal efficiency as above, LSST will be able to perhaps detect less than 1 SN per year within 1h of explosion, and about 20 events within 1 day, still well below the expected performance of ULTRASAT. In addition, these events will be typically distant and hence faint, and difficult to follow-up (e.g., spectroscopically).
| Survey | Band | Cadence | FOV [deg2] | Expected Number [SN yr-1] | |||||
|---|---|---|---|---|---|---|---|---|---|
| RSG | BSG | W-R | |||||||
| h | d | h | d | h | d | ||||
| GALEX/PTF | NUV | 3 d | 600 | 0 | 42a | 0 | 0 | 0 | 0 |
| ULTRASAT | NUV | s | 210 | 6 | 100 | 1 | 8 | 0 | 4 |
| ULTRASAT | NUV | s | 210 | 20 | 380 | 3 | 30 | 1 | 13 |
| iPTF b | 1 d | 1000 | 0 | 6 | 0 | 2 | 0 | 1 | |
| ZTFc | 0.5 h | 2100 | 0 | 9 | 0 | 2 | 0 | 1 | |
| LSSTd | 0.5 h | 9.6 | 0 | 17 | 0 | 3 | 0 | 2 | |
-
a
For our GALEX/PTF Pre-LIM experiement, we report here the expected number within 3 d (not 1 d) to match its low actual cadence. As the survey ran for 2 m (1/6 yr), the expected number of SNe from RSG explosions for the actual experiment is 42/6=7 events.
-
b
Assumed temporal efficiency of (including loss due to daytime and average weather) and lunation-averaged depth of 20.6 mag.
-
c
temporal efficiency as above, average depth 20.4 mag, and survey time spent in g-band.
-
d
Assumed the following for the LSST deep-drilling project: 1 LSST field observed at any given time, temporal efficieny as above, g=24.2 mag lunation-averaged depth.
5.4 Estimated SN fractions in wide-field surveys
In view of the complexity of massive stars and the resulting diversity of their explosive core-collapse SN outcomes, an important aspect in the design of a survey to systematically study early emission from massive star explosions is the number of different SN types one expects to obtain significant data about. To assess this for our own survey, as well as future programs such as ULTRASAT (Sagiv et al. 2014), we use the large sample of spectroscopically-confirmed SNe from the PTF survey (Law et al. 2009; Rau et al. 2009; Arcavi et al. 2010). The final sample from PTF (2009-2012) includes 484 events. This sample is suitable for our study as it comes from a relatively shallow survey with a depth identical to the GALEX/PTF survey (by definition) and similar to that predicted for ULTRASAT. The survey is also untargeted (it is not focussed on known catalogued galaxies that are typically biased towards more massive and metal-rich objects).
The fractions of SNe of different types from the PTF flux-limited sample are reported in Table 3. The separation of the common class of Type II SNe into photometric subclasses (II-P and II-L) should not be regarded as final, and is, in any case, controversial (e.g., Arcavi et al. 2012; Anderson et al. 2013; Faran et al. 2014a,b). The size of the PTF sample allows estimates of the observed fractions of even rare classes (e.g., Ic-BL and II-pec) with reasonable accuracy.
Table 3 also provide estimates for a fiducial sample of 100 events, as well as the confidence lower-limit on the expected number of SNe from each class in this fiducial sample. We find that all SN types except for the rare Type II-pec events are expected to be detected in samples of size 100 events or larger.
Next, we estimate the expected yield of our GALEX/PTF experiment and compare it with our actual findings (right columns of Table 3). We find excellent agreement even for the small numbers in questions. We counted PTF12ffs as a Type II-P event, but including it instead in the II-L class would not significantly alter this result in view of the small SN numbers.
| SN Type | PTF number | Fraction | Expected # | Minimum # | Expected | Actual |
|---|---|---|---|---|---|---|
| of total | (per 100) | ( c.l.)a | (per 10) | GALEX/PTF | ||
| II-P | 193 | 40% | 40 | 30 | 4 | 4 |
| II-L | 70 | 14% | 14 | 8 | 1 | 1 |
| IIb | 24 | 5% | 5 | 2 | 1 | 1 |
| IIn | 91 | 19% | 19 | 12 | 2 | 2 |
| II-pecb | 5 | 1% | 1 | 0 | 0 | 1 |
| Ib | 34 | 7% | 7 | 3 | 1 | 1 |
| Ic | 49 | 10% | 10 | 5 | 1 | 0 |
| Ic-BL | 18 | 4% | 4 | 1 | 0 | 0 |
-
a
Minimum number expected per 100 events at a confidence level of calculated using small-number Poisson statistics (Gehrels 1986).
-
b
Peculiar Type II SNe with very long rise times, similar to SN 1987A or PTF12gcx (see note to Table 1)
6 Conclusions
Motivated by the scientific promise of early UV observations of SNe, we have conducted a GALEX/PTF survey for such events that detected six Type II SNe at ages d. We develop a theoretical framework to predict the number of early UV SN detections in general surveys, using theoretical UV light curves that fit existing data well, combined with measured volumetric SN rates. We find that adopting a set of reasonable physical parameters for exploding RSG SN progenitors (R R⊙, E erg and M M⊙) fits our PTF/GALEX results well. We adopt these parameters and predict the expected early UV SN detection numbers from the proposed ULTRASAT space mission, as well as several ground-based surveys (Table 2). We find that ULTRASAT is expected to discover SNe per year in the UV, within 1 day of explosion. A robust lower-limit directly derived from the GALEX UV detection rates supports this estimate. Using SN Type statistics from PTF we show that such a sample is likely to include examples of all common SN Types (Table 3). We conclude that a space mission like ULTRASAT will be able to comprehensively map the progenitor propoerties of SNe of all types (including radii and surface composition) and constrain SN explosion physics, providing a compelling answer to the question of massive stellar death.
Acknowledgments
This research was supported by grants from the Israeli Space Agnecy (ISA) and the Ministry of Science, Technology and Space (MOS).
References
- Anderson et al. (2014) Anderson, J. P., González-Gaitán, S., Hamuy, M., et al. 2014, ApJ, 786, 67
- Arcavi et al. (2010) Arcavi, I., Gal-Yam, A., Kasliwal, M. M., et al. 2010, ApJ, 721, 777
- Arcavi et al. (2011) Arcavi, I., Gal-Yam, A., Yaron, O., et al. 2011, ApJ, 742, LL18
- Arcavi et al. (2012) Arcavi, I., Gal-Yam, A., Cenko, S. B., et al. 2012, ApJ, 756, LL30
- Arnett et al. (1989) Arnett, W. D., Bahcall, J. N., Kirshner, R. P., & Woosley, S. E. 1989, ARA&A, 27, 629
- Barbarino et al. (2014) Barbarino, C., Dall’Ora, M., Botticella, M. T., et al. 2014, arXiv:1410.8393
- Balberg & Loeb (2011) Balberg, S., & Loeb, A. 2011, MNRAS, 414, 1715
- Barlow et al. (2013) Barlow, T. A., Gal-Yam, A., & Ofek, E. 2013, American Astronomical Society Meeting Abstracts #221, 221, #215.10
- Camp et al. (2013) Camp, J., Barthelmy, S., Blackburn, L., et al. 2013, Experimental Astronomy, 36, 505
- Campana et al. (2006) Campana, S., Mangano, V., Blustin, A. J., et al. 2006, Nature, 442, 1008
- Cao et al. (2013) Cao, Y., Kasliwal, M. M., Arcavi, I., et al. 2013, ApJ, 775, LL7
- Chevalier (1976) Chevalier, R. A. 1976, ApJ, 207, 872
- Chevalier (1992) Chevalier, R. A. 1992, ApJ, 394, 599
- Chevalier & Fransson (2008) Chevalier, R. A., & Fransson, C. 2008, ApJ, 683, L135
- Chevalier & Irwin (2011) Chevalier, R. A., & Irwin, C. M. 2011, ApJ, 729, LL6
- Chevalier & Irwin (2012) Chevalier, R. A., & Irwin, C. M. 2012, ApJ, 747, LL17
- Colgate (1974) Colgate, S. A. 1974, ApJ, 187, 333
- Corsi et al. (2012) Corsi, A., Ofek, E. O., Gal-Yam, A., et al. 2012, ApJ, 747, LL5
- Ensman & Burrows (1992) Ensman, L., & Burrows, A. 1992, ApJ, 393, 742
- Falk (1978) Falk, S. W. 1978, ApJ, 225, L133
- Faran et al. (2014) Faran, T., Poznanski, D., Filippenko, A. V., et al. 2014, MNRAS, 442, 844
- Faran et al. (2014) Faran, T., Poznanski, D., Filippenko, A. V., et al. 2014, MNRAS, 445, 554
- Gal-Yam et al. (2011) Gal-Yam, A., Kasliwal, M. M., Arcavi, I., et al. 2011, ApJ, 736, 159
- Gal-Yam (2012) Gal-Yam, A. 2012, Science, 337, 927
- Gal-Yam et al. (2013) Gal-Yam, A., Mazzali, P. A., Manulis, I., & Bishop, D. 2013, PASP, 125, 749
- Gal-Yam et al. (2014) Gal-Yam, A., Arcavi, I., Ofek, E. O., et al. 2014, Nature, 509, 471
- Gehrels (1986) Gehrels, N. 1986, ApJ, 303, 336
- Gezari et al. (2008) Gezari, S., Dessart, L., Basa, S., et al. 2008, ApJ, 683, L131
- Gezari et al. (2010) Gezari, S., Rest, A., Huber, M. E., et al. 2010, ApJ, 720, L77
- Ginzburg & Balberg (2014) Ginzburg, S., & Balberg, S. 2014, ApJ, 780, 18
- Grassberg et al. (1971) Grassberg, E. K., Imshennik, V. S., & Nadyozhin, D. K. 1971, Ap&SS, 10, 28
- Katz et al. (2012) Katz, B., Sapir, N., & Waxman, E. 2012, ApJ, 747, 147
- Klein & Chevalier (1978) Klein, R. I., & Chevalier, R. A. 1978, ApJ, 223, L109
- Kleiser et al. (2011) Kleiser, I. K. W., Poznanski, D., Kasen, D., et al. 2011, MNRAS, 415, 372
- Law et al. (2004) Law, N. M., Rutledge, R. E., & Kulkarni, S. R. 2004, MNRAS, 350, 1079
- Law et al. (2009) Law, N. M., et al. 2009, PASP, 121, 1395
- Langer (2012) Langer, N. 2012, ARA&A, 50, 107
- Li et al. (2011) Li, W., Chornock, R., Leaman, J., et al. 2011, MNRAS, 412, 1473
- Matzner & McKee (1999) Matzner, C. D., & McKee, C. F. 1999, ApJ, 510, 379
- Moriya & Tominaga (2012) Moriya, T. J., & Tominaga, N. 2012, ApJ, 747, 118
- Moriya et al. (2015) Moriya, T. J., Sanyal, D., & Langer, N. 2015, arXiv:1502.03218
- Morrissey et al. (2007) Morrissey, P., Conrow, T., Barlow, T. A., et al. 2007, ApJS, 173, 682
- Nakar & Sari (2010) Nakar, E., & Sari, R. 2010, ApJ, 725, 904
- Nakar & Piro (2014) Nakar, E., & Piro, A. L. 2014, ApJ, 788, 193
- Ofek et al. (2010) Ofek, E. O., Rabinak, I., Neill, J. D., et al. 2010, ApJ, 724, 1396
- Ofek et al. (2013) Ofek, E. O., Sullivan, M., Cenko, S. B., et al. 2013, Nature, 494, 65
- Ofek et al. (2014) Ofek, E. O., Sullivan, M., Shaviv, N. J., et al. 2014a, ApJ, 789, 104
- Ofek et al. (2014) Ofek, E. O., Arcavi, I., Tal, D., et al. 2014b, ApJ, 788, 154
- Ofek (2014) Ofek, E. O. 2014, Astrophysics Source Code Library, 1407.005
- Pastorello et al. (2005) Pastorello, A., Baron, E., Branch, D., et al. 2005, MNRAS, 360, 950
- Pastorello et al. (2007) Pastorello, A., Smartt, S. J., Mattila, S., et al. 2007, Nature, 447, 829
- Piro & Nakar (2013) Piro, A. L., & Nakar, E. 2013, ApJ, 769, 67
- Podsiadlowski et al. (2004) Podsiadlowski, P., Mazzali, P. A., Nomoto, K., Lazzati, D., & Cappellaro, E. 2004, ApJ, 607, L17
- Rabinak & Waxman (2011) Rabinak, I., & Waxman, E. 2011, ApJ, 728, 63
- Rabinak & Waxman (2013) Rabinak, I., & Waxman, E. 2013, ApJ, 770, 81
- Rau et al. (2009) Rau, A., et al. 2009, PASP, 121, 1334
- Sagiv et al. (2014) Sagiv, I., Gal-Yam, A., Ofek, E. O., et al. 2014, AJ, 147, 79
- Sapir et al. (2011) Sapir, N., Katz, B., & Waxman, E. 2011, ApJ, 742, 36
- Sapir et al. (2013) Sapir, N., Katz, B., & Waxman, E. 2013, ApJ, 774, 79
- Sapir & Halbertal (2014) Sapir, N., & Halbertal, D. 2014, ApJ, 796, 145
- Schawinski et al. (2008) Schawinski, K., Justham, S., Wolf, C., et al. 2008, Science, 321, 223
- Schmidt et al. (1993) Schmidt, B. P., Kirshner, R. P., Eastman, R. G., et al. 1993, Nature, 364, 600
- Smartt (2009) Smartt, S. J. 2009, ARA&A, 47, 63
- Smartt et al. (2009) Smartt, S. J., Eldridge, J. J., Crockett, R. M., & Maund, J. R. 2009, MNRAS, 395, 1409
- Soderberg et al. (2008) Soderberg, A. M., et al. 2008, Nature, 453, 469
- Svirski & Nakar (2014) Svirski, G., & Nakar, E. 2014, ApJ, 788, 113
- Vikhlinin (1998) Vikhlinin, A. 1998, ApJ, 505, L123