Quantitative Analysis of the Italian National Scientific Qualification111The final version of this paper is published in the Journal of Informetrics. Please cite as: Moreno Marzolla, Quantitative Analysis of the Italian National Scientific Qualification, Journal of Informetrics 9(2), April 2015, pp. 285–316, ISSN 1751-1577, DOI http://dx.doi.org/10.1016/j.joi.2015.02.006
Abstract
The Italian National Scientific Qualification (ASN) was introduced in 2010 as part of a major reform of the national university system. Under the new regulation, the scientific qualification for a specific role (associate or full professor) and field of study is required to apply for a permanent professor position. The ASN is peculiar since it makes use of bibliometric indicators with associated thresholds as one of the parameters used to assess applicants. The first round of the ASN received 59,149 applications, and the results have been made publicly available for a short period of time, including the values of the quantitative indicators for each applicant. The availability of this wealth of information provides an opportunity to draw a fairly detailed picture of a nation-wide evaluation exercise, and to study the impact of the bibliometric indicators on the qualification results. In this paper we provide a first account of the Italian National Scientific Qualification from a quantitative point of view. We show that significant differences exist among scientific disciplines, in particular with respect to the fraction of qualified applicants, that can not be easily explained. Furthermore, we describe some issues related to the definition and use of the bibliometric indicators and the corresponding thresholds. Our analysis aims at drawing attention to potential problems that should be addressed by decision-makers in future rounds of the ASN.
keywords:
National Scientific Qualification; ASN; Research Evaluation; Bibliometrics; Italy1 Introduction
The Italian Law 240/2010 (Law dec. 30, n. 240, 2010) introduced substantial changes in the national university system. The law is quite broad in scope: it requires universities to undergo a major internal reorganization, delegates the government to define new rules for improving the quality and efficiency of higher education system, and modifies the recruitment process of university professors. Under the new regulation, to apply for a permanent professor positions it is first necessary to acquire the National Scientific Qualification (ASN)222The acronym ASN stands for Abilitazione Scientifica Nazionale. All acronyms used in this paper (e.g., ASN, MIUR, ANVUR) are based on the original (Italian) denomination, since they have a well established meaning for the Italian scientific community, while the expanded forms are in English for the benefit of international readers.. The ASN is meant to attest that an individual has reached the scientific maturity required for applying for a specific role (associate or full professor) in a given scientific discipline (Law dec. 30, n. 240, 2010, Art. 16); however, the qualification does not guarantee that a professorship position will eventually be granted.
The Italian ASN is similar to other habilitation procedures already in place in other countries (e.g., France and Germany) in that it is a prerequisite for becoming a university professor. What makes the ASN peculiar is its reliance on bibliometry as one of the parameters used to evaluate applicants. Specifically, the Ministry of University and Research defined three quantitative indicators whose values were computed for each candidate. To grant qualification, examination committees should take into account how many indicators exceed previously computed thresholds. Such thresholds were defined as the medians of the values of those indicators for tenured professors.
The first round of the ASN started on November 2012 and completed in August 2014 with the publication of the last batch of results. Given the stagnating status of the Italian university system, the ASN represents the only opportunity for postdocs and temporary researchers to move towards a permanent position, and for tenured researchers and associate professors to move up the academic ladder. Therefore, it is not surprising that the ASN received 59,149 applications spanning 184 scientific disciplines. The curricula of all applicants, the values of their bibliometric indicators and the final reports of examination committees have been made publicly available for a short period of time. This provided an opportunity to analyze a nation-wide research assessment procedure involving a large number of applicants from all scientific areas.
The present work describes the results of the Italian ASN from a quantitative point of view. Specifically, we compute several statistics that provide a picture of the outcome of the qualification procedure. These statistics include: the fraction of successful qualifications, whether the values of bibliometric indicators are correlated with the outcome, whether those indicators have been used consistently across applicants, and whether the values of the quantitative indicators are correlated with the qualification result.
This paper is descriptive and aims at showing what happened in order to provide insights and draw attention to potential problems that require further investigation. Although we try to suggest possible explanations whenever appropriate, it is understood that only manual examination of the applicants’ curricula and final reports may reveal whether the problems highlighted here are real issues. The ASN has been criticized by part of the Italian scientific community as a form of “career assessment by numbers” (using a term borrowed from Kelly and Jennions (2006)), due to its reliance on (ad-hoc) bibliometric indicators for individual evaluation. In this paper we try to avoid using numbers to explain what must be left to human judgment.
This paper is organized as follows. In Section 2 we provide the necessary background on the structure of the Italian university system and the National Scientific Qualification rules. In Section 3 we give a high level overview of the outcome of the ASN in terms of the number of applications and percentages of successful qualifications for each scientific area and discipline. Then, we turn our attention to the numerical indicators used to evaluate the applicants: the thresholds (medians) will be studied in Section 4, while the impact of the bibliometric indicators on the outcome of the qualification procedure will be analyzed in Section 5. Final discussion and concluding remarks are presented in Section 6.
2 The Italian National Scientific Qualification
2.1 Overview
Before 2010, there were three types of tenured research and teaching positions at Italian universities: assistant professor, associate professor and full professor. Law 240/2010 replaced the role of tenured assistant professor with two types of fixed term positions, called Type A and Type B researcher. Type A positions last for three years and can be extended once for two more years, while type B positions last for three years with no provision for further extension. Type A positions are supposed to be a path towards becoming tenured associate professor, since universities hiring type A researchers must allocate funding for promotion in advance.
| ID | Code | Area Name | N. of Sc. Disciplines |
| 01 | MCS | Mathematics and Computer Sciences | 7 |
| 02 | PHY | Physics | 6 |
| 03 | CHE | Chemistry | 8 |
| 04 | EAS | Earth Sciences | 4 |
| 05 | BIO | Biology | 13 |
| 06 | MED | Medical Sciences | 26 |
| 07 | AVM | Agricultural Sciences and Veterinary Medicine | 14 |
| 08 | CEA | Civil Engineering and Architecture | 12 |
| 09 | IIE | Industrial and Information Engineering | 20 |
| 10 | APL | Antiquities, Philology, Literary Studies, Art History | 19 |
| 11 | HPP | History, Philosophy, Pedagogy and Psychology | 17 |
| 12 | LAW | Law | 16 |
| 13 | ECS | Economics and Statistics | 15 |
| 14 | PSS | Political and Social Sciences | 7 |
| Total | 184 |
Each professor and researcher is bound to a specific field of study, called Scientific Discipline (SD). When the ASN started, scientific disciplines were organized in 14 scientific areas, each one comprising several macro-sectors that were further divided into SDs. The 14 scientific ares are listed in Table 1; for each area we show its numeric ID, a three-letter acronym, the name and number of SDs it contains. Overall, 184 SDs were defined (DM 159, 2012a, Annex A); for completeness, they are listed in B. The aim and scope of each discipline is given in (DM 159, 2012a, Annex B). Each SD is identified by a four-character code of the form AA/MC where AA is the ID of the area the discipline belongs to (01–14), M is a single letter denoting the macro-sector, and C is a digit identifying the discipline within the macro-sector. For example, 01/B1 denotes Computer Science, 09/H1 denotes Computer Engineering and 11/A1 denotes Medieval History.
Each university can create new positions for a given SD and role (associate or full professor), provided that certain administrative and financial requirements are met. Once the position is advertised, only those that have acquired the ASN for that specific SD and role can apply. In this paper we use the term ASN to denote both the qualification procedure used to grant qualification, and the qualification itself. It is important to observe that a qualification does not, by itself, guarantee any position, but merely allows the owner to apply for a professorship; each university handles the hiring process according to locally defined rules.
The ASN is supposed to be held once a year. For each SD, the Ministry of University and Research (MIUR) appoints a five-member examination committee which is in charge of evaluating all applications, both at the full and associate professor levels, Committee members are randomly selected from a list of eligible professors. To be eligible, one has to satisfy quantitative requirements similar to those used for assessing applicants (see below). Each committee is made of four full professors from Italian universities, and one professor from a foreign university or research institution. Therefore, 920 examiners were appointed; it is worth noticing that each of the 184 foreign professors was paid Eur 16,000 for two years (DM 159, 2012b), for a total cost of Eur 2,944,000.
Once acquired, a qualification lasts for six years; those who fail to get qualification can not apply again for two years. Although the scientific qualification is bound to a specific SD (e.g., computer science) and role (e.g., associate professor), it was possible to apply for multiple qualifications for different SDs and/or role. Indeed, there are many applicants who got multiple qualifications; one particularly successful researcher acquired 8 qualifications for both the full and associate professor levels, in 8 related scientific disciplines. There has also been the curious situations of one applicant who successfully qualified as full professor in discipline 06/H1–Obstetrics and gynecology, but was denied qualification as associate professor in the same discipline (by the same examination committee)! This was probably due to an error in the submitted application form for associate professor qualification, since a significant number of publications were missing.
2.2 Quantitative Indicators
Law 240/2010 made the provision that the ASN has to be granted based on the analytic evaluation of scientific publications using criteria and parameters defined in a separate decree. Those parameters were eventually described in the Ministerial Decree 76/2012 (DM 76, 2012) that introduced two flavors of quantitative indicators, called bibliometric and non-bibliometric indicators, respectively.
Bibliometric indicators (DM 76, 2012, Annex A) apply to scientific disciplines for which “sufficiently complete” citation databases exist. The three bibliometric indicators are the following:
-
Normalized number of journal papers;
-
Total normalized number of citations received;
-
Normalized -index.
These are used for all disciplines belonging to the nine scientific areas Mathematics and Computer Sciences (MCS), Physics (PHY), Chemistry (CHE), Earth Sciences (EAS), Biology (BIO), Medical Sciences (MED), Agricultural Sciences and Veterinary Medicine (AVM), Civil Engineering and Architecture (CEA) and Industrial and Information Engineering (IIE), with the exception of 08/C1–Design and technological planning of architecture, 08/D1–Architectural design, 08/E1–Drawing, 08/E2–Architectural restoration and history and 08/F1–Urban and landscape planning and design, but including the whole macro sector 11/E–Psychology. These disciplines are denoted as bibliometric disciplines.
Non-bibliometric indicators (DM 76, 2012, Annex B) apply to scientific disciplines (mostly, humanities and social sciences) for which citation-based indices can not be reliably computed due to the lack of suitable bibliometric databases. Non-bibliometric indicators have been defined for Antiquities, Philology, Literary Studies, Art History (APL), History, Philosophy, Pedagogy and Psychology (HPP), Law (LAW), Economics and Statistics (ECS) and Political and Social Sciences (PSS), with the exceptions above; these disciplines are referred to as non-bibliometric disciplines in the official MIUR documents. The three non-bibliometric indicators are:
-
Normalized number of published books;
-
Normalized number of journal papers and book chapters;
-
Normalized number of papers published on “top” journals.
It is important to remark that the terms “bibliometric” and “non-bibliometric” are used in the official MIUR documents. Unfortunately, such terminology is not consistent with that used by the scientometric community, since the so-called non-bibliometric indicators , and are indeed bibliometric, being based on paper counts. Given that the terms “bibliometric” and “non-bibliometric” became standard within the Italian research community, we will follow the MIUR “newspeak” according to the definitions above. However, to limit further confusion we will use the generic term quantitative indicators () to refer to both the bibliometric indicators and non-bibliometric ones .
Normalization of quantitative indicators is used to mitigate the bias against young applicants, since citations and paper counting metrics increase over time. Normalization is based on the concept of scientific age ANVUR (2013): an applicant that published her first paper in year has scientific age equal to:
| (1) |
Indicators , , and are normalized by multiplying the raw value by . Indicator (number of citations received) is normalized by dividing the raw value by the academic age. Finally, indicator (normalized -index) requires a more complex procedure. Given a paper , published in year , that at time has received citations, the normalized number of citations for is defined as:
| (2) |
Then, the normalized h-index is defined as the maximum integer such that papers of a given applicant received at least normalized citations each (Sidiropoulos et al., 2007).
The values of the quantitative indicators were computed for each applicant by National Agency for the Assessment of Universities and Research (ANVUR), a public entity that oversees the evaluation of universities and public research institutes, using data from Scopus and ISI Web of Science (WoS). The number of citations of each paper was computed as the maximum value reported by Scopus and WoS. Only publications produced during the ten years period 2002–2012 were considered.
2.3 Medians
For each quantitative (bibliometric and non-bibliometric) indicator ANVUR computed a threshold, defined in DM 76 (2012) as the median of the values assumed by the indicator for tenured associate and full professors. All professors were asked to voluntarily upload their lists of publications to a central database, so that the values of the appropriate quantitative indicators could be computed (ANVUR, 2012). Separate medians were computed for each discipline and for each role (full and associate professor). The thresholds were computed by ANVUR before the closing date for applicants. Candidates were then informed about the values of the medians and of their individual quantitative indicators; those who were no longer willing to pursue their application, i.e., because their quantitative indicators were below the medians, could withdraw from the ASN.
Special provisions were made to cope with SDs where the quantitative indicators exhibited a multi-modal distribution (ANVUR, 2012, Art. 16). This was handled by defining one or more sub-disciplines with different medians. However, this procedure could only be applied to SDs with no less than 100 full professors, and required ad-hoc interaction with the National University Council. 47 sub-disciplines where identified for full professor, and 47 for associate professor qualification (see the table in D).
According to the literal interpretation of (DM 76, 2012, Art. 6.1, 6.2), only applicants whose quantitative indicators exceed two or one medians (for bibliometric and non-bibliometric disciplines, respectively) could get the qualification. For example, suppose that the medians for a given bibliometric discipline are . An applicant whose quantitative indicators are exceeds the first and second median, and according to the interpretation above may obtain the qualification, provided that other qualitative aspects of his scientific profile are also evaluated positively. On the other hand, an applicant with indicators only exceeds the first median (the value of the third indicator is equal to the corresponding median, and therefore does not exceed it), so it is not eligible for qualification.
In other words, exceeding one or two medians was initially considered a necessary but not sufficient condition for qualification. This interpretation was later relaxed (Profumo, 2013), also because (DM 76, 2012, Art 6.5) partially conflicts with (DM 76, 2012, Art. 6.1, 6.2) by stating that examination committees can waive the requirement above, provided that their decision is motivated in the final report. In Section 5 we will investigate whether committees likely adopted the restrictive or the relaxed interpretation of the requirement above.
2.4 Discussion
Although a detailed discussion is outside the scope of this paper, we want to point out some methodological issues of the ASN.
-
1.
It is well known that quantitative indicators must be used with extreme care when evaluating individual researchers (Sahel, 2011; IEEE, 2013; Laloë and Mosseri, 2009; Institute de France, 2011). The Italian lawmaker appears to be aware at least of the most serious pitfalls and tried to address them, e.g., using multiple indicators instead of one, using normalization to take into account the scientific age of applicants, and making the provision that also the qualitative profile of applicants had to be taken into account. Some of those countermeasures introduce other problems (see below). Moreover, the law (DM 76, 2012) is ambiguous about the role of quantitative indicators, and this generated confusion among applicants and examination committees.
-
2.
The idea of using the medians of quantitative indicators of tenured professors as thresholds is a form of “grading by curves” that leads to bizarre consequences. By construction, half of the tenured professors do not exceed each median; this is true regardless of their quality: should they all be Nobel laureates, half of them would still be below each threshold. This ensures that a fraction of tenured professors will not meet the quantitative qualification requirements for their own role. The problem is not that some professors fail qualification for their current position (this may happen with different criteria as well), but that this happens by construction.
-
3.
The values of medians provided by ANVUR can not be validated, since they were computed using a list of publication that has not been made publicly available. Since ANVUR released a second set of medians to fix errors in their original computations, one may wonder whether the new values are indeed correct.
-
4.
The use of Scopus and WoS as the only sources of bibliometric information places considerable power on the hands of private companies. Some applicants did not have access to these databases (e.g., because they did not have an institutional subscription and were not able or willing to pay for one), and therefore could not verify the correctness of their data. In any case, Scopus and WoS were under no obligation to fix errors before the ASN deadline, or fix errors at all.
-
5.
Although normalization of quantitative indicators tries to address a valid concern, i.e., that paper-counting and citation-based metrics penalize younger applicants, its implementation in the ASN according to Eq. (1) creates the so called “paradox of academic twins”. Consider two applicants, Alice and Bob, who have only joint publications over the 8 years preceding the ASN. Alice has no other publications while Bob has one additional conference paper, published ten years before ASN, that received no citations. Normalization only applies to Alice, since her scientific age is less than ten years. Due to normalization, Alice indicators are higher than those of Bob, even though she has a strict subset of Bob’s publications. In general, the values of quantitative indicators can be increased by intentional or accidental omission of older publications.
3 General Overview
The ASN results were made available for three months after the initial publication at http://abilitazione.miur.it/. The data were provided as HTML pages and PDF documents that are appropriate for manual browsing but not for automatic processing. Therefore, we developed a crawler that extracted and formatted the relevant information in CSV (Comma Separated Values) format; all subsequent analyses have been performed using R (R Core Team, 2014).
The following data have been used in this paper:
-
1.
Applicant first and last name (string);
-
2.
Scientific discipline (and optional sub-discipline) applied to (string);
-
3.
Role applied to (integer, 1=full professor, 2=associate professor);
-
4.
Values of the three quantitative indicators;
-
5.
Result of the qualification procedure (boolean, true=qualified, false=not qualified);
The values of medians for bibliometric and non-bibliometric disciplines were taken from the official ANVUR documents (ANVUR, 2012a, b, c, d, e).
| Area | Full professor | Associate professor | Total | ||||||
|---|---|---|---|---|---|---|---|---|---|
| Applications | Qualified | Applications | Qualified | Applications | Qualified | ||||
| MCS | 911 | 356 | 0.391 | 1581 | 714 | 0.452 | 2492 | 1070 | 0.429 |
| PHY | 1451 | 760 | 0.524 | 2921 | 1676 | 0.574 | 4372 | 2436 | 0.557 |
| CHE | 695 | 387 | 0.557 | 1649 | 934 | 0.566 | 2344 | 1321 | 0.564 |
| EAS | 400 | 148 | 0.370 | 831 | 366 | 0.440 | 1231 | 514 | 0.418 |
| BIO | 1690 | 763 | 0.451 | 4554 | 1874 | 0.412 | 6244 | 2637 | 0.422 |
| MED | 3298 | 1377 | 0.418 | 6689 | 2669 | 0.399 | 9987 | 4046 | 0.405 |
| AVM | 650 | 373 | 0.574 | 1443 | 747 | 0.518 | 2093 | 1120 | 0.535 |
| CEA | 1027 | 371 | 0.361 | 2572 | 906 | 0.352 | 3599 | 1277 | 0.355 |
| IIE | 1573 | 691 | 0.439 | 2962 | 1256 | 0.424 | 4535 | 1947 | 0.429 |
| APL | 1718 | 796 | 0.463 | 4606 | 2082 | 0.452 | 6324 | 2878 | 0.455 |
| HPP | 1491 | 509 | 0.341 | 4418 | 1632 | 0.369 | 5909 | 2141 | 0.362 |
| LAW | 887 | 322 | 0.363 | 2150 | 736 | 0.342 | 3037 | 1058 | 0.348 |
| ECS | 1755 | 787 | 0.448 | 3098 | 1451 | 0.468 | 4853 | 2238 | 0.461 |
| PSS | 515 | 162 | 0.315 | 1614 | 497 | 0.308 | 2129 | 659 | 0.310 |
| Total | 18061 | 7802 | 0.432 | 41088 | 17540 | 0.427 | 59149 | 25342 | 0.428 |
Table 2 reports the number of submitted applications, the number of successful applications and the fraction of successful applications () for each area; an application is successful if it leads to qualification. Variables with the suffixes and refer to full and associate roles, respectively. Therefore, is the fraction of applicants for the full professor level that got qualification, and is the fraction of applicants for the associate professor level that got qualification.
Overall, 59,149 applications have been submitted333The actual number is 59,150, but no quantitative indicators were shown for one of the applicants, and therefore we dropped that entry from this analysis., 18,061 for full and 41,088 for associate professor qualification. 25,342 applications were successful (42.8%). As can be seen, the fraction of successful qualifications for the full and associate levels were almost identical. Note that the number of applications is higher than the number of applicants, since many individuals submitted multiple applications. We counted 39,583 unique pairs, but the number of individuals may be higher due to the presence of people with the same names.
Area MED received the highest number of applications (9,987), while area EAS received the lowest (1,231). The area with highest percentage of successful qualifications is CHE (56.4%), while the one with lowest percentage is PSS (31%). The percentage of successful qualifications for bibliometric disciplines is 44.6%, while the percentage of qualifications for non-bibliometric disciplines is 40.1%. The difference is quite small and does not denote any particular bias.
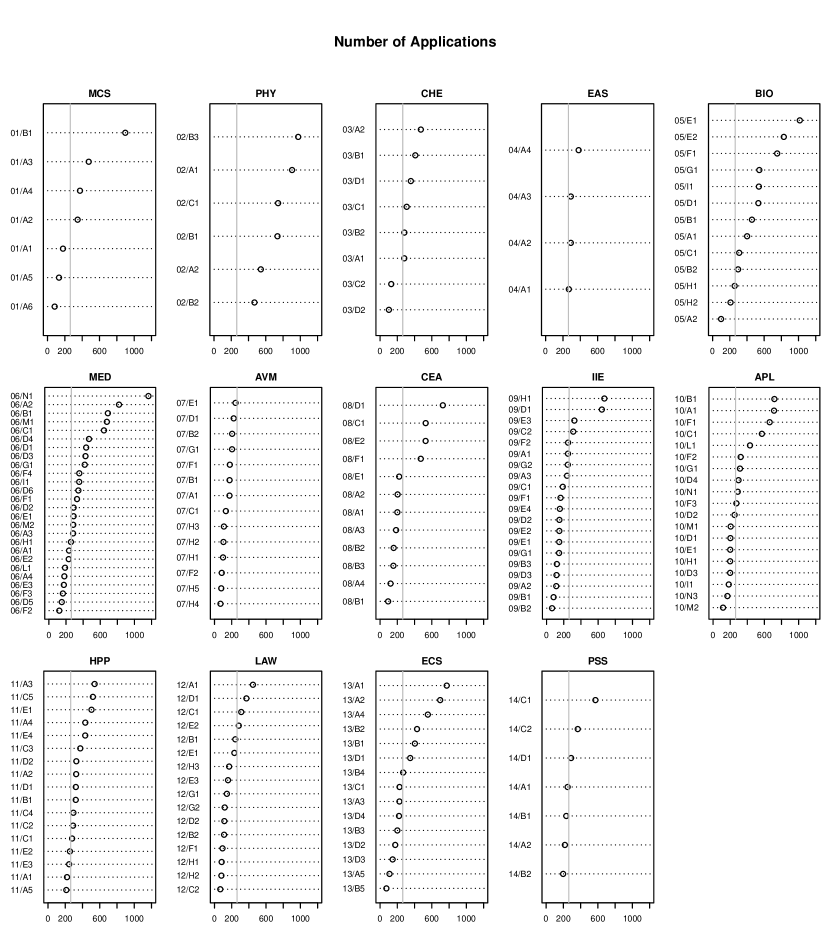
From Table 2 we observe large differences across areas, both in the number of applications and fraction of successful qualifications. To better investigate these differences we perform a more detailed analysis at the level of individual SDs. Figure 1 shows the number of applications () for each SDs (the raw data can be found in C). The median number of applications is 263; 75% of the SDs received less than 421.2 applications, while the remaining 25% received up to 1,164.
In this paper we use Tukey’s five number summary (Tukey, 1977) (minimum, first quartile, sample median, third quartile, maximum) to describe the shape of distributions, since quantile-based statistics are more robust than sample mean and standard deviation. The five-number summary for the number of applications is shown in Table 3.
| Min. | 1st Qu. | Median | 3rd Qu. | Max. |
|---|---|---|---|---|
| 64 | 175 | 263 | 421.2 | 1164 |
Considerable variability exists across different SDs: the minimum number of applications was submitted to 09/B2–Industrial mechanical plants (64 applications, 13 for full and 51 for associate professor level), while the maximum number of applications was submitted to 06/N1–Applied medical technologies (1164 applications, 365 for full and 799 for associate professor level). Figure 1 shows that all disciplines of area PHY received more applications than the median, while those of area AVM received less applications than the median.
This information, other than providing a very rough estimate of the number of researchers in each discipline, is also useful from a practical point of view. Every examination committee was given the same amount of time (two months) for processing all applications. If done properly, this involves the following activities (for each candidate): (i) assessing the CV; (ii) assessing the publications provided in full text; (iii) writing the final report. These activities require a significant amount of time, especially if the number of applications to process is large; as an example, the committee for discipline 06/N1–Applied medical technologies was appointed on December 27, 2012 and was supposed to process 1164 applications by February 25, 2013. Applicants to area MED were allowed to submit at most 20 publications in full text for full professor qualification, and 14 for associate professor qualification. Therefore, each committee member of SD 06/N1 was supposed to evaluate 1,164 CVs and about publications in two months. It is not surprising that MIUR had to grant multiple deadline extensions to committees that were in a similar situation444Decreto Direttoriale 47, 2012-01-09 http://abilitazione.miur.it/public/documenti/commissioni/Proroga_termini_090113.pdf, and this produced delays in the publication of final results. Future rounds of the ASN should take the workload of examination committees into account, and consider splitting overcrowded SDs across different committees. Extra care should be taken for ensuring that the evaluations are as much committee-independent as possible.

The number of applications for the full () and associate () levels are strongly correlated. We use Spearman’s rank order correlation coefficient to measure the strength of the correlation (Myers et al., 2010). Spearman’s is a non-parametric measure of association between two samples; values closer to 1 denote higher (positive) correlation. We prefer Spearman’s to the more commonly used Pearson’s product-moment correlation coefficient since the latter only measures linear correlation, while Spearman’s estimates how well the dependency of two variables can be described using a generic monotonic function. The correlation coefficient for the number of applications at the full versus associate professor level is , denoting significant positive correlation (see Figure 2); the 95% confidence interval (CI) for the correlation coefficient is .
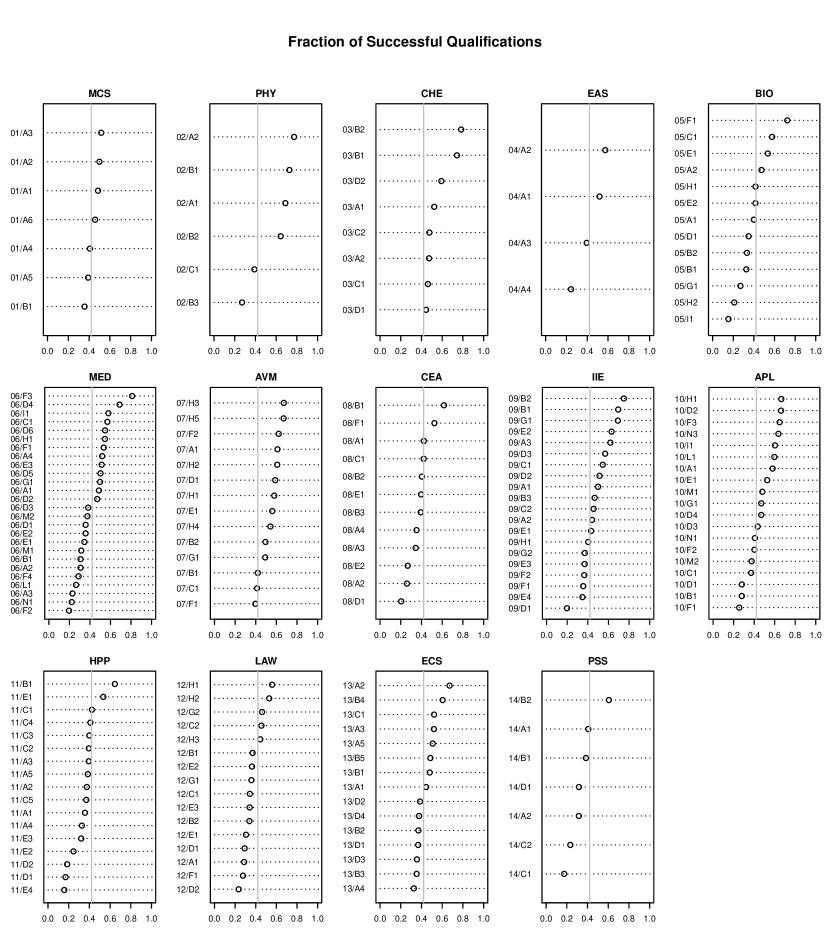
Figure 3 shows the distribution of the fraction of successful applications () for each SD. The median is 0.421, with inter-quartile range 0.182. The five-number summary is shown in Table 4.
| Min. | 1st Qu. | Median | 3rd Qu. | Max. |
| 0.154 | 0.353 | 0.421 | 0.535 | 0.811 |
The distribution of spans the interval , suggesting the presence of several outliers. Indeed, it is interesting to compare the five SDs with lowest fraction of successful qualification:
| 0.154 | 05/I1–Genetics and microbiology |
| 0.157 | 11/E4–Clinical and dynamic psychology |
| 0.170 | 11/D1–Educational theories and history of educational theories |
| 0.175 | 14/C1–General and political sociology, sociology of law |
| 0.185 | 11/D2–Methodologies of teaching, special education and educational research |
with the five SDs with highest fraction of successful qualification:
| 0.743 | 03/B1–Principles of chemistry and inorganic systems |
| 0.750 | 09/B2–Industrial mechanical plants |
| 0.773 | 02/A2–Theoretical physics of fundamental interactions |
| 0.784 | 03/B2–Chemical basis of technology applications |
| 0.811 | 06/F3–Otorhinolaryngology and audiology |
High variability also exists among disciplines of the same area. For example, the values of in area BIO ranges from 0.154 (05/I1–Genetics and microbiology) to 0.725 (05/F1–Experimental biology). Although statistical fluctuations could account for some of these differences, it is hard to believe that the candidates of one discipline are so much better (worse) than those of another. Each scientific community has its own practices for evaluating researchers, but these can still not justify the wide variations shown in figure 3. The identification of the root causes of those differences is subject of ongoing research.
There is significant positive correlation between the fraction of successful applications at the full and associate levels: with 95% CI . Therefore, whichever criteria have been used for evaluating applicants, they have been applied consistently to both roles.
4 Medians
In this section we examine the medians that were used as thresholds of the quantitative indicators of applicants. We address the following questions:
-
1.
How are medians distributed? (Section 4.1)
-
2.
Are the medians for full professor qualification correlated with those for associate professor qualification? (Section 4.2)
-
3.
Are the quantitative requirements for full professor qualification higher than those for associate professor qualification? (Section 4.3)
In the following, , , denote the medians for full professor qualification, and , , those for associate professor qualification (the SD they refer to will be irrelevant).
4.1 Distributions


Figure 4 shows the distributions of the values of medians for full and associate professor qualification using box plots (Tukey, 1977). Recall from Section 2 that medians for bibliometric disciplines refer to different types of indicators than those used for non-bibliometric disciplines. In particular, non-bibliometric indicators are based on paper-counting metrics, while bibliometric indicators (normalized number of citations received) and (normalized -index) are citation-based. This explains why medians for non-bibliometric disciplines (APL, HPP, LAW, ECS and PSS) are lower than those for bibliometric ones.
It is well known that impact metrics are not homogeneous across scientific disciplines due to different publication and citation patterns and practices (Hirsch, 2005). Therefore, the large variation of medians are originated from the different distributions of bibliometric indicators (Albarrán et al., 2011). MED is a prominent example, with values for , and that span an order of magnitude.
An interesting observation is that some of the medians are zero. Specifically, there are 30 disciplines where one median for full professor qualification is zero, and 6 disciplines where two medians for full professor qualification are zero. Moreover, there are 52 disciplines where one median for associate professor qualification is zero, and 3 where two medians for associate professor qualification are zero. Zero medians are only present in some non-bibliometric disciplines; medians for bibliometric indicators are all strictly positive.
Medians equal to zero are a strong hint that non-bibliometric indicators, as defined in the ASN, may be not meaningful for all disciplines they are applied to. To see why, remember that the medians are based on quantitative indicators computed on the publications submitted by tenured professors. Therefore, if a median is zero, then the corresponding indicator is zero for at least half of tenured professors. Such an indicator provides no or very little information regarding the research profile of applicants, and should therefore be revised.
4.2 Correlations between Medians
| Correlation of: | Bibliometric | Non-Bibliometric | ||
|---|---|---|---|---|
| 95% CI | 95% CI | |||
| vs | ||||
| vs | ||||
| vs | ||||
We expect that the medians for full professor qualification are positively correlated with those for associate professor qualification for the same discipline: if increases from one discipline to another, we expect that increases as well. To test this hypothesis, we compute the rank-order correlation coefficients between the -th medians for full and associate professor qualification for the same discipline (). We consider bibliometric and non-bibliometric disciplines separately, to see whether there are differences in the strength of the association.
Table 5 shows that the medians for associate and full professor qualification are indeed positively correlated for both bibliometric and non-bibliometric disciplines. The correlation is strong for bibliometric medians (); it is also high between (normalized number of books) and (normalized number of papers published on top journals). On the other hand, the correlation between and (normalized number of journal papers) for non-bibliometric disciplines is weaker ().
4.3 Pareto Dominance Analysis
It is reasonable to expect that the quantitative requirements for full professor qualification are higher than those for associate professor qualification for the same discipline, since a full professor must demonstrate a stronger research profile and higher impact than an associate professor. In the context of ASN this means that the three medians for full professor qualification should be “higher than” those for associate professor in the same discipline.
We can formalize this using the concept of Pareto dominance, defined as follows: the -dimensional real-valued vector Pareto-dominates (denoted with ) if the following conditions hold:
-
1.
Every element of is no lower than the corresponding element of : for each ; and
-
2.
There exists at least one index for which the -th element of is strictly higher than the corresponding element of : .
We say that the quantitative requirements for full professor qualification in some SD are higher than those for associate professor if and only if the medians Pareto-dominate for that discipline. Surprisingly, this is not always true for the medians defined for the ASN. First, there are several disciplines where one of the medians for full professor qualification is lower than the corresponding median for associate professor qualification, violating the first condition above. Specifically, there are 30 disciplines where , 30 disciplines where , and 8 where ; there are also disciplines where multiple violations occurs, see the entries labeled “O”, “OO”, “o” and “oo” in D. Finally, there are 15 SDs (10 bibliometric and 5 non-bibliometric) where the medians for associate professor qualification Pareto-dominate those for full professor qualification (entries labeled “*” in the same table). This has the paradoxical effect that applicants for a lower academic rank are required by the ASN to satisfy higher quantitative standards than applicants for a higher rank.
The situations above may have happened for several reasons. The most obvious explanation could be that older generations of scholars are less productive than younger researchers; however, this explanation seems refuted by a recent study (Abramo et al., 2011). Also, errors or omissions in the publication list that was used to compute the medians may have introduced distortions in the raw data (that is unfortunately not publicly available and therefore can not be audited). Finally, in some disciplines full professor may be unable to dedicate much time to research, due to other administrative tasks or higher teaching load than associate professors. Whatever the reason, the existence of Pareto violations suggests that the thresholds for qualification should be defined with a different, more robust mechanism.
5 Analysis of the Quantitative Indicators of Applicants
In this section we analyze the values of the quantitative indicators used in the evaluation of applicants. In the following we denote applicants whose indicators exceed two medians (one, for non-bibliometric disciplines) as “over-median”, and those who do not satisfy this requirement as “under-median”.
We address the following questions:
-
1.
Are the quantitative indicators pairwise correlated? (Section 5.1)
-
2.
Were over-median applicants more likely to get qualification than under-median ones? (Section 5.2)
-
3.
What are the minimum values of each quantitative indicator below which qualification is not granted? (Section 5.3)
-
4.
Do the ASN results preserve the Pareto dominance relation between applicants? (Section 5.4)
5.1 Correlation between Quantitative Indicators


We start our analysis by testing whether the values of different quantitative indicators among applicants for the same role are correlated. It seems reasonable to expect that applicants with higher values of one indicator have higher values of other indicators as well, therefore we expect positive correlation. To verify this hypothesis we compute the Spearman’s rank correlation coefficient between the -th and -th indicators, for each of the following subsets of applications:
-
1.
Applications for full professor qualification in bibliometric disciplines (, );
-
2.
Applications for associate professor qualification in bibliometric disciplines (, );
-
3.
Applications for full professor qualification in non-bibliometric disciplines (, );
-
4.
Applications for associate professor qualification in non-bibliometric disciplines qualification (, ).
The results are shown in the four scatter plot matrices (NIST, 2012) of Figure 5. Each matrix refers to one of the four possible combinations of (full, associate) qualification for (bibliometric, non-bibliometric) disciplines. Cell in the upper triangular part shows the scatter plot of (resp. ) versus (resp. ); every point represents one application. Cell in the lower triangular part shows the corresponding rank correlation coefficient and the -value of the null hypothesis of no correlation.
Figures 5(a) and 5(b) show that quantitative indicators for both full and associate professor applicants in bibliometric disciplines are strongly pairwise correlated. This confirms our expectation, and suggests that the indicators defined for bibliometric disciplines may indeed reflect different aspects of a common quantitative profile of each candidate. On the other hand, Figures 5(c) and 5(d) show that quantitative indicators for non-bibliometric disciplines are not pairwise correlated, and therefore it is not clear what they measure. This is another strong call for better understanding whether the indicators defined for the social sciences and humanities are a meaningful way for assessing researchers in those research areas.
5.2 Conditional Qualification Probabilities

Are over-median applicants more likely to get qualification than under-median ones? To answer this question we compute the fractions , of over- and under-median applicants that received qualification. These quantities can be seen as conditional qualification probabilities defined as:
| (3) | ||||
| (4) |
At the global level, 77.2% of the applications are over-median (80.8% of applications for full professor qualification, and 75.6% of those for associate professor qualification). 52.8% of over-median applicants got qualification (51.5% at the full professor level, 53.4% at the associate professor level), compared with 9.2% of under-median applicants (8.4% at the full professor level, and 9.4% at the associate professor level).
Figure 6 shows the values of and for each SD. The fractions of qualified under-median applicants are in general much lower than the fractions of qualified over-median applicants (in 69 disciplines no under-median applicant got qualification). There is a single exception, 13/A5–Econometrics, for which and . Of course, it is not possible to claim any causal relationship between exceeding medians and getting qualification. In fact, it is equally possible that (i) examination committees were somewhat biased towards granting qualification to over-median applicants (the ASN rules encourage this), or that (ii) over-median applicants have higher quantitative indicators because they are intrinsically “better”, and therefore more likely to qualify anyway.
| Min. | 1st Qu. | Median | 3rd Qu. | Max. |
| 0.195 | 0.419 | 0.509 | 0.684 | 0.997 |
| Min. | 1st Qu. | Median | 3rd Qu. | Max. |
|---|---|---|---|---|
| 0 | 0 | 0.041 | 0.123 | 0.667 |
Looking at the five-number summaries for (Table 6) and (Table 7) we observe that there are SDs with either very low or very high fractions of over-median applicants that got qualification. The median of is slightly more than , meaning that 50% of the examination committees denied qualification to more than half of over-median applicants. Therefore, exceeding the medians is loosely correlated with getting qualification in halt of the SDs.
| Fraction of qualified: | Full professor | Associate professor | ||||
|---|---|---|---|---|---|---|
| B | N | 95% CI | B | N | 95% CI | |
| over-median applicants | 0.568 | 0.440 | [0.11, 0.14] | 0.606 | 0.452 | [0.14, 0.17] |
| under-median applicants | 0.087 | 0.070 | [-0.01, 0.04] | 0.109 | 0.040 | [0.06, 0.08] |
To test whether there are differences across bibliometric and non-bibliometric disciplines and across roles, we compute the fraction of qualified over- and under-median applicants for each of the following disjoint sets:
-
1.
Applicants for full professor qualification on bibliometric disciplines;
-
2.
Applicants for associate professor qualification on bibliometric disciplines;
-
3.
Applicants for full professor qualification on non-bibliometric disciplines;
-
4.
Applicants for associate professor qualification on non-bibliometric disciplines.
The results are reported in Table 8. Within the four classes above we observe the same general pattern that we have seen above for individual disciplines: over-median applicants were on average more likely to get qualification than under-median ones. Additionally, over-median applicants were more likely to get qualification in bibliometric disciplines rather than non-bibliometric ones; the differences are non-negligible and statistically significant. The reason of these differences is yet to be identified.


Finally, we compute the strength of the association between the conditional qualification probabilities for full and associate professor qualification. Figures 7(a) and 7(c) show the correlation between the fraction of over-median qualified applicants for the full () and associate () levels, for bibliometric and non-bibliometric disciplines, respectively; Figures 7(b) and 7(d) show the correlation between and for bibliometric and non-bibliometric disciplines. Correlation is high for over-median applicants for bibliometric disciplines (), and still significant for non-bibliometric ones (). Positive correlation suggests that evaluation criteria have been applied consistently for both roles.
The qualification probabilities for under-median applicants are positively correlated between full and associate roles, although with lower strength both for bibliometric disciplines () and non-bibliometric ones (). This suggests that the decisions to grant or deny qualification to under-median applicants were taken on a case-by-case basis.
5.3 Minimum Values of the Indicators for Qualified Applicants
In this section we address the following question: are there minimum values for each quantitative indicator below which qualification has not been given? From the data on Table 8 we already know that there are qualified under-median applicants, so we expect that many of those minimum values are below the medians.


Each point in Figure 8 represents a SD; the coordinate is the value of one of the medians, while the coordinate is the minimum value of the corresponding indicator among all successfully qualified applicants. Points located below the dashed lines denote SDs where the minimum value among qualified applicants is lower than the median. Points above the lines denote SDs where the minimum value among qualified applicants is higher than the median.
Figure 8 shows the values of each indicator that the examination committees considered the “absolute minimum” for granting qualification, i.e., no applicant with a lower values got qualified.
| Role | |||
|---|---|---|---|
| Full Professor | |||
| Associate Professor |
We observe that, for most disciplines, the minimum values of the quantitative indicators of successful applicants are below the medians. However, there are disciplines where the minimum value of a quantitative indicator across qualified applicants is higher than the median. In Table 9 we report, for each indicator and role, the number of disciplines for which the minimum value of for qualified applicants is strictly higher than the corresponding median . We observe that this happened more frequently for full professor qualification, suggesting that examination committees enforced stronger quantitative requirements than those required by the ASN rules.
5.4 Pareto Dominance Analysis
The Pareto dominance relation introduced in Section 4.3 can be used to define a partial order among applicants. Let us consider two researchers, Alice and Bob, applying for the same role in the same SD. Suppose that the quantitative indicators for Alice are and those for Bob are . Then, Alice Pareto-dominates Bob since ; in other words Alice is quantitatively “no worse than” Bob with respect to all indicators, and strictly “better” in two of them. Thus, if Bob gets the qualification we expect that also Alice does.
If Bob gets the qualification but Alice does not, we have a violation of Pareto dominance. There could be many valid reasons for this to happen: for example, Alice could have applied to a SD unrelated to her research field, or she could have failed to meet the minimum qualitative requirements for the role applied for. Therefore, Pareto violations do not automatically indicate a problem, but nevertheless represent anomalies that require further investigation.
To study the frequency of Pareto violations in each discipline, we define a metric called Pareto violation ratio (PVR) as follows. Let be the set of applicants to a given SD and role. Let be two applicants in such that Pareto-dominates . Let and the vectors of the quantitative indicators of and , respectively. We have a Pareto violation if is not qualified but is; in all other cases there is no violation, as summarized in Table 10.
| Pareto-violation? | ||
|---|---|---|
| Qualified | Qualified | No |
| Qualified | Not qualified | No |
| Not qualified | Qualified | Yes |
| Not qualified | Not qualified | No |
We can therefore define PVR as:
| (5) |
where is the cardinality (number of elements) of set . By definition, , where if no qualified applicant is Pareto-dominated by a not qualified one, while if for every pairs of applicants where Pareto-dominates we have that is not qualified while is. Therefore, higher PVR values indicate anomalous situation that should be investigated.

Figure 9 shows the PVR values among full () and associate () professor qualification for each discipline. In most cases, the PVR for full professor applicants is higher than that for associate professor applicants (there are exactly 57 SDs where ). The values of PVR for the full and associate roles are positively correlated, although the strength of the correlation is higher for bibliometric disciplines () than non-bibliometric ones (). The five-number summaries indicate that the values of (Table 11) and (Table 12) are quite small: the maximum of is , while the maximum of is . However, the relative width of the interval from the third quartile to the maximum is large for both and , denoting the presence of several outliers.
| Min. | 1st Qu. | Median | 3rd Qu. | Max. |
|---|---|---|---|---|
| 0 | 0.123 | 0.203 | 0.29 | 0.61 |
| Min. | 1st Qu. | Median | 3rd Qu. | Max. |
|---|---|---|---|---|
| 0 | 0.092 | 0.15 | 0.211 | 0.542 |
6 Conclusions
In this paper we have illustrated the results of the first Italian National Scientific Qualification, that is required since 2010 to apply for a permanent position as associate or full professor at Italian universities. The scientific profile of applicants has been evaluated also using three quantitative, paper-counting and citation-based indicators. Qualification had to be preferably given to those applicants whose quantitative indicators exceeded some pre-computed thresholds; the thresholds were computed as the medians of the same indicators computed for tenured professors.
We have analyzed the results of the ASN at the global level and at the level of individual scientific disciplines. At the global level the ASN received 59,149 applications, 42.8% of which were successful; this percentage is quite modest, especially considering that the ASN does not grant professorship positions, but only allows qualified individuals to apply to future openings. Although no direct comparison with other countries is possible, it is instructive to observe that the success rate in the 2013 French recruitment campaign for professors and maîtres de conférences was 68.38% (9,183 qualifications out of 13,430 applicants (Ministère de l’Education Nationale, de l’Enseignement Supèrieur et de la Recherche, 2013, p. 34)). Looking at individual disciplines, the fraction of successful qualifications ranges from 15.4% to 81.1%. In 25% of the SDs the fraction of qualified applicants was less than 35.3%. It would be tempting to attribute the poor performance of ASN applicants to their low quality. Such an explanation would be unsatisfactory, since 77.2% of the applications come from over-median applicants, but only 52.8% of them got qualification.
Over-median applicants were, on average, more likely to get qualification than under-median ones. However, the distribution of the conditional qualification probabilities for over-median applicants spans a large range, with some disciplines granting qualification to a small fraction of over-median applicants, and others qualifying most of them. Half of the examination committees denied qualification to more than half of the applicants that satisfied the quantitative requirements for qualification. Therefore, exceeding the medians is poorly correlated with getting qualification in half of the SDs, suggesting that the role of the indicators should be reconsidered.
The analysis of the medians reveals some interesting facts. First, there are disciplines where the thresholds for associate professor qualification are higher than those for full professor qualification. This means that in those disciplines it is easier to pass the quantitative requirements for the higher academic rank, than it is to pass the requirements for the lower rank. The second observation is that there are medians equal to zero in several non-bibliometric disciplines. This implies that the corresponding indicators are zero for at least half of the tenured professors, making those indicators not very useful for assessing the scientific profile of applicants. Finally, medians for non-bibliometric disciplines are not pairwise correlated, as it would be reasonable to expect (and as it happens for bibliometric disciplines). These observations suggest possible issues either in the computation of the medians, or in the definition of inappropriate quantitative indicators.
The data we have examined in this paper show what happened, but do not provide sufficient information to explain why it happened. More insights might come from the analysis of the curricula of applicants and the final reports written by the examination committees. We are planning to use natural language processing and text analysis techniques to efficiently analyze the large body of unstructured text documents produced by the ASN, and we will report the outcomes of such analysis in a future work.
Another source of useful information is represented by the values of the three quantitative indicators of applicants. The availability of bibliometric information for a large population of researchers in all scientific fields represents a valuable dataset for studying how quantitative indicators behave across all scientific areas.
Appendix A Notation
| := | Medians | |
| := | Bibliometric indicators | |
| := | Non-bibliometric indicators | |
| := | Quantitative indicators (either bibliometric or non-bibliometric) | |
| := | Number of applications | |
| := | Fraction of qualified applicants | |
| := | Fraction of under-median applicants that got qualification | |
| := | Fraction of over-median applicants that got qualification | |
| := | Pareto Violation Ratio |
The suffix indicates that the variable refers to full professor applicants, while the suffix indicates that the variable refers to associate professor applicants.
Appendix B List of Scientific Disciplines
The list below enumerates all scientific areas (first indentation level), macro-sectors (second indentation level) and scientific disciplines, as they are defined when the ASN started (DM 159, 2012a, Annex A). We use here the English translation provided by the Italian National University Council (CUN)555https://www.cun.it/documentazione/academic-fields-and-disciplines-list/, accessed on 2014-08-19, since all names are officially defined in Italian only.
- 01
-
Mathematics and computer sciences
- 01/A
-
Mathematics
- 01/A1
-
Mathematical logic, mathematics education and history of mathematics
- 01/A2
-
Geometry and algebra
- 01/A3
-
Mathematical analysis, probability and statistics
- 01/A4
-
Mathematical physics
- 01/A5
-
Numerical analysis
- 01/A6
-
Operational research
- 01/B
-
Informatics
- 01/B1
-
Informatics
- 02
-
Physics
- 02/A
-
Physics of fundamental interactions
- 02/A1
-
Experimental physics of fundamental interactions
- 02/A2
-
Theoretical physics of fundamental interactions
- 02/B
-
Physics of matter
- 02/B1
-
Experimental physics of matter
- 02/B2
-
Theoretical physics of matter
- 02/B3
-
Applied physics
- 02/C
-
Astronomy, astrophysics, Earth and planetary physics
- 02/C1
-
Astronomy, astrophysics, Earth and planetary physics
- 03
-
Chemistry
- 03/A
-
Analytical and physical chemistry
- 03/A1
-
Analytical chemistry
- 03/A2
-
Models and methods for chemistry
- 03/B
-
Inorganic chemistry and applied technologies
- 03/B1
-
Principles of chemistry and inorganic systems
- 03/B2
-
Chemical basis of technology applications
- 03/C
-
Organic, industrial and applied chemistry
- 03/C1
-
Organic chemistry
- 03/C2
-
Industrial and applied chemistry
- 03/D
-
Medicinal and food chemistry and applied technologies
- 03/D1
-
Medicinal, toxicological and nutritional chemistry and applied technologies
- 03/D2
-
Drug technology, socioeconomics and regulations
- 04
-
Earth sciences
- 04/A
-
Earth sciences
- 04/A1
-
Geochemistry, mineralogy, petrology, volcanology, Earth resources and applications
- 04/A2
-
Structural geology, stratigraphy, sedimentology and paleontology
- 04/A3
-
Applied geology, physical geography and geomorphology
- 04/A4
-
Geophysics
- 05
-
Biology
- 05/A
-
Plant biology
- 05/A1
-
Botany
- 05/A2
-
Plant physiology
- 05/B
-
Animal biology and anthropology
- 05/B1
-
Zoology and anthropology
- 05/B2
-
Comparative anatomy and cytology
- 05/C
-
Ecology
- 05/C1
-
Ecology
- 05/D
-
Physiology
- 05/D1
-
Physiology
- 05/E
-
Experimental and clinical biochemistry and molecular biology
- 05/E1
-
General biochemistry and clinical biochemistry
- 05/E2
-
Molecular biology
- 05/F
-
Experimental biology
- 05/F1
-
Experimental biology
- 05/G
-
Experimental and clinical pharmacology
- 05/G1
-
Pharmacology, clinical pharmacology and pharmacognosy
- 05/H
-
Human anatomy and histology
- 05/H1
-
Human anatomy
- 05/H2
-
Histology
- 05/I
-
Genetics and microbiology
- 05/I1
-
Genetics and microbiology
- 06
-
Medicine
- 06/A
-
Pathology and laboratory medicine
- 06/A1
-
Medical genetics
- 06/A2
-
Experimental medicine, pathophysiology and clinical pathology
- 06/A3
-
Microbiology and clinical microbiology
- 06/A4
-
Pathology
- 06/B
-
General clinical medicine
- 06/B1
-
Internal medicine
- 06/C
-
General clinical surgery
- 06/C1
-
General surgery
- 06/D
-
Specialized clinical medicine
- 06/D1
-
Cardiovascular and respiratory diseases
- 06/D2
-
Endocrinology, nephrology, food and wellness sciences
- 06/D3
-
Blood diseases, oncology and rheumatology
- 06/D4
-
Skin, contagious and gastrointestinal diseases
- 06/D5
-
Psychiatry
- 06/D6
-
Neurology
- 06/E
-
Specialized clinical surgery
- 06/E1
-
Heart, thoracic and vascular surgery
- 06/E2
-
Plastic and paediatric surgery and urology
- 06/E3
-
Neurosurgery and maxillofacial surgery
- 06/F
-
Integrated clinical surgery
- 06/F1
-
Odontostomatologic diseases
- 06/F2
-
Eye diseases
- 06/F3
-
Otorhinolaryngology and audiology
- 06/F4
-
Musculoskeletal diseases and physical and rehabilitation medicine
- 06/G
-
Paediatrics
- 06/G1
-
Paediatrics and child neuropsychiatry
- 06/H
-
Gynaecology
- 06/H1
-
Obstetrics and gynecology
- 06/I
-
Radiology
- 06/I1
-
Diagnostic imaging, radiotherapy and neuroradiology
- 06/L
-
Anaesthesiology
- 06/L1
-
Anaesthesiology
- 06/M
-
Public health
- 06/M1
-
Hygiene, public health, nursing and medical statistics
- 06/M2
-
Forensic and occupational medicine
- 06/N
-
Applied medical technologies
- 06/N1
-
Applied medical technologies
- 07
-
Agricultural and veterinary sciences
- 07/A
-
Agricultural economics and appraisal
- 07/A1
-
Agricultural economics and appraisal
- 07/B
-
Agricultural and forest systems
- 07/B1
-
Agronomy and field, vegetable, ornamental cropping systems
- 07/B2
-
Arboriculture and forest systems
- 07/C
-
Agricultural, forest and biosytems engineering
- 07/C1
-
Agricultural, forest and biosystems engineering
- 07/D
-
Plant pathology and entomology
- 07/D1
-
Plant pathology and entomology
- 07/E
-
Agricultural chemistry and agricultural genetics
- 07/E1
-
Agricultural chemistry, agricultural genetics and pedology
- 07/F
-
Food technology and agricultural microbiology
- 07/F1
-
Food science and technology
- 07/F2
-
Agricultural microbiology
- 07/G
-
Animal science and technology
- 07/G1
-
Animal science and technology
- 07/H
-
Veterinary medicine
- 07/H1
-
Veterinary anatomy and physiology
- 07/H2
-
Veterinary pathology and inspection of foods of animal origin
- 07/H3
-
Infectious and parasitic animal diseases
- 07/H4
-
Clinical veterinary medicine and pharmacology
- 07/H5
-
Clinical veterinary surgery and obstetrics
- 08
-
Civil engineering and architecture
- 08/A
-
Landscape and infrastructural engineering
- 08/A1
-
Hydraulics, hydrology, hydraulic and marine constructions
- 08/A2
-
Sanitary and environmental engineering, hydrocarbons and underground fluids, safety and protection engineering
- 08/A3
-
Infrastructural and transportation engineering, real estate appraisal and investment valuation
- 08/A4
-
Geomatics
- 08/B
-
Structural and geotechnical engineering
- 08/B1
-
Geotechnics
- 08/B2
-
Structural mechanics
- 08/B3
-
Structural engineering
- 08/C
-
Design and technological planning of architecture
- 08/C1
-
Design and technological planning of architecture
- 08/D
-
Architectural design
- 08/D1
-
Architectural design
- 08/E
-
Drawing, architectural restoration and history
- 08/E1
-
Drawing
- 08/E2
-
Architectural restoration and history
- 08/F
-
Urban and landscape planning and design
- 08/F1
-
Urban and landscape planning and design
- 09
-
Industrial and information engineering
- 09/A
-
Mechanical and aerospace engineering and naval architecture
- 09/A1
-
Aeronautical and aerospace engineering and naval architecture
- 09/A2
-
Applied mechanics
- 09/A3
-
Industrial design, machine construction and metallurgy
- 09/B
-
Manufacturing, industrial and managenent engineering
- 09/B1
-
Manufacturing technology and systems
- 09/B2
-
Industrial mechanical plants
- 09/B3
-
Business and management engineering
- 09/C
-
Energy, thermomechanical and nuclear engineering
- 09/C1
-
Fluid machinery, energy systems and power generation
- 09/C2
-
Technical physics and nuclear engineering
- 09/D
-
Chemical and materials engineering
- 09/D1
-
Materials science and technology
- 09/D2
-
Systems, methods and technologies of chemical and process engineering
- 09/D3
-
Chemical plants and technologies
- 09/E
-
Electrical and electronic engineering and measurements
- 09/E1
-
Electrical technology
- 09/E2
-
Electrical energy engineering
- 09/E3
-
Electronics
- 09/E4
-
Measurements
- 09/F
-
Telecommunications engineering and electromagnetic fields
- 09/F1
-
Electromagnetic fields
- 09/F2
-
Telecommunications
- 09/G
-
Systems engineering and bioengineering
- 09/G1
-
Systems and control engineering
- 09/G2
-
Bioengineering
- 09/H
-
Computer engineering
- 09/H1
-
Information processing systems
- 10
-
Antiquities, philology, literary studies, art history
- 10/A
-
Archaeological sciences
- 10/A1
-
Archaeology
- 10/B
-
Art history
- 10/B1
-
Art history
- 10/C
-
Cinema, music, performing arts, television and media studies
- 10/C1
-
Cinema, music, performing arts, television and media studies
- 10/D
-
Sciences of antiquity
- 10/D1
-
Ancient history
- 10/D2
-
Greek language and literature
- 10/D3
-
Latin language and literature
- 10/D4
-
Classical and late antique philology
- 10/E
-
Medieval latin and romance philologies and literatures
- 10/E1
-
Medieval latin and romance philologies and literatures
- 10/F
-
Italian studies and comparative literatures
- 10/F1
-
Italian literature, literary criticism and comparative literature
- 10/F2
-
Contemporary Italian literature
- 10/F3
-
Italian linguistics and philology
- 10/G
-
Glottology and linguistics
- 10/G1
-
Glottology and linguistics
- 10/H
-
French studies
- 10/H1
-
French language, literature and culture
- 10/I
-
Spanish and Hispanic studies
- 10/I1
-
Spanish and Hispanic languages, literatures and cultures
- 10/L
-
English and Anglo-American studies
- 10/L1
-
English and Anglo-American languages, literatures and cultures
- 10/M
-
Germanic and Slavic languages, literatures and cultures
- 10/M1
-
Germanic languages, literatures and cultures
- 10/M2
-
Slavic studies
- 10/N
-
Eastern cultures
- 10/N1
-
Ancient Near Eastern, Middle Eastern and African cultures
- 10/N3
-
Central and East Asian cultures
- 11
-
History, philosophy, pedagogy and psychology
- 11/A
-
History
- 11/A1
-
Medieval history
- 11/A2
-
Modern history
- 11/A3
-
Contemporary history
- 11/A4
-
Science of books and documents, history of religions
- 11/A5
-
Demography, ethnography and anthropology
- 11/B
-
Geography
- 11/B1
-
Geography
- 11/C
-
Philosophy
- 11/C1
-
Theoretical philosophy
- 11/C2
-
Logic, history and philosophy of science
- 11/C3
-
Moral philosophy
- 11/C4
-
Aesthetics and philosophy of languages
- 11/C5
-
History of philosophy
- 11/D
-
Educational theories
- 11/D1
-
Educational theories and history of educational theories
- 11/D2
-
Methodologies of teaching, special education and educational research
- 11/E
-
Psychology
- 11/E1
-
General psychology, psychobiology and psychometrics
- 11/E2
-
Developmental and educational psychology
- 11/E3
-
Social psychology and work and organizational psychology
- 11/E4
-
Clinical and dynamic psychology
- 12
-
Law studies
- 12/A
-
Private law
- 12/A1
-
Private law
- 12/B
-
Business, navigation and air law and labour law
- 12/B1
-
Business, navigation and air law
- 12/B2
-
Labour law
- 12/C
-
Constitutional and ecclesiastical law
- 12/C1
-
Constitutional law
- 12/C2
-
Ecclesiastical law and canon law
- 12/D
-
Administrative and tax law
- 12/D1
-
Administrative law
- 12/D2
-
Tax law
- 12/E
-
International and European Union law, comparative, economics and markets law
- 12/E1
-
International and European Union law
- 12/E2
-
Comparative law
- 12/E3
-
Economics, financial and agri-food markets law and regulation
- 12/F
-
Civil procedural law
- 12/F1
-
Civil procedural law
- 12/G
-
Criminal law and criminal procedure
- 12/G1
-
Criminal law
- 12/G2
-
Criminal procedure
- 12/H
-
Roman law, history of medieval and modern law and philosophy of law
- 12/H1
-
Roman and ancient law
- 12/H2
-
History of medieval and modern law
- 12/H3
-
Philosophy of law
- 13
-
Economics and statistics
- 13/A
-
Economics
- 13/A1
-
Economics
- 13/A2
-
Economic policy
- 13/A3
-
Public economics
- 13/A4
-
Applied economics
- 13/A5
-
Econometrics
- 13/B
-
Business administration and Management
- 13/B1
-
Business administration and Management
- 13/B2
-
Management
- 13/B3
-
Organization studies
- 13/B4
-
Financial Markets and Institutions
- 13/B5
-
Commodity science
- 13/C
-
Economic history
- 13/C1
-
Economic history
- 13/D
-
Statistics and mathematical methods for decisions
- 13/D1
-
Statistics
- 13/D2
-
Economic statistics
- 13/D3
-
Demography and social statistics
- 13/D4
-
Mathematical methods of economics, finance and actuarial sciences
- 14
-
Political and social sciences
- 14/A
-
Political theory
- 14/A1
-
Political philosophy
- 14/A2
-
Political science
- 14/B
-
Political history
- 14/B1
-
History of political thought and institutions
- 14/B2
-
History of international relations and of non-European societies and institutions
- 14/C
-
Sociology
- 14/C1
-
General and political sociology, sociology of law
- 14/C2
-
Sociology of culture and communication
- 14/D
-
Applied sociology
- 14/D1
-
Sociology of economy and labour, sociology of land and environment
Appendix C Basic Statistics
Table LABEL:tab:basic-statistics shows basic statistics for each SDs: number of applicants, number and fraction of qualifications, fraction of qualified over- and under-median applicants (). Note that is undefined for a couple of disciplines where there are no under-median applicants for the full professor role. In these cases the reported value is “NaN”.
| Sc. Discipline | Full Professor | Associate Professor | ||||||||
|---|---|---|---|---|---|---|---|---|---|---|
| App. | Qualified | App. | Qualified | |||||||
| Area 1: Mathematics and computer sciences (MCS) | ||||||||||
| 01/A1 | 76 | 30 | 0.395 | 0.472 | 0.217 | 103 | 57 | 0.553 | 0.600 | 0.500 |
| 01/A2 | 126 | 51 | 0.405 | 0.610 | 0.023 | 222 | 123 | 0.554 | 0.745 | 0.164 |
| 01/A3 | 185 | 102 | 0.551 | 0.750 | 0.148 | 291 | 144 | 0.495 | 0.717 | 0.096 |
| 01/A4 | 144 | 62 | 0.431 | 0.455 | 0.304 | 231 | 91 | 0.394 | 0.446 | 0.232 |
| 01/A5 | 40 | 16 | 0.400 | 0.433 | 0.300 | 93 | 36 | 0.387 | 0.492 | 0.143 |
| 01/A6 | 34 | 15 | 0.441 | 0.517 | 0.000 | 49 | 23 | 0.469 | 0.769 | 0.130 |
| 01/B1 | 306 | 80 | 0.261 | 0.356 | 0.023 | 592 | 240 | 0.405 | 0.642 | 0.022 |
| Area 2: Physics (PHY) | ||||||||||
| 02/A1 | 356 | 212 | 0.596 | 0.651 | 0.375 | 549 | 412 | 0.750 | 0.842 | 0.362 |
| 02/A2 | 239 | 170 | 0.711 | 0.877 | 0.115 | 304 | 250 | 0.822 | 0.948 | 0.543 |
| 02/B1 | 230 | 160 | 0.696 | 0.796 | 0.327 | 506 | 376 | 0.743 | 0.904 | 0.321 |
| 02/B2 | 139 | 93 | 0.669 | 0.951 | 0.263 | 330 | 209 | 0.633 | 0.949 | 0.351 |
| 02/B3 | 280 | 70 | 0.250 | 0.276 | 0.145 | 696 | 194 | 0.279 | 0.330 | 0.170 |
| 02/C1 | 207 | 55 | 0.266 | 0.353 | 0.019 | 536 | 235 | 0.438 | 0.548 | 0.018 |
| Area 3: Chemistry (CHE) | ||||||||||
| 03/A1 | 57 | 29 | 0.509 | 0.703 | 0.150 | 224 | 118 | 0.527 | 0.713 | 0.149 |
| 03/A2 | 160 | 72 | 0.450 | 0.523 | 0.156 | 313 | 152 | 0.486 | 0.640 | 0.110 |
| 03/B1 | 143 | 119 | 0.832 | 0.991 | 0.148 | 266 | 185 | 0.695 | 1.000 | 0.120 |
| 03/B2 | 69 | 56 | 0.812 | 0.964 | 0.214 | 213 | 165 | 0.775 | 1.000 | 0.186 |
| 03/C1 | 104 | 46 | 0.442 | 0.548 | 0.000 | 205 | 97 | 0.473 | 0.681 | 0.071 |
| 03/C2 | 45 | 19 | 0.422 | 0.475 | 0.000 | 85 | 43 | 0.506 | 0.714 | 0.103 |
| 03/D1 | 93 | 32 | 0.344 | 0.449 | 0.042 | 264 | 127 | 0.481 | 0.646 | 0.140 |
| 03/D2 | 24 | 14 | 0.583 | 0.923 | 0.182 | 79 | 47 | 0.595 | 0.843 | 0.143 |
| Area 4: Earth sciences (EAS) | ||||||||||
| 04/A1 | 98 | 43 | 0.439 | 0.597 | 0.000 | 170 | 96 | 0.565 | 0.770 | 0.042 |
| 04/A2 | 96 | 43 | 0.448 | 0.489 | 0.000 | 195 | 124 | 0.636 | 0.780 | 0.156 |
| 04/A3 | 72 | 28 | 0.389 | 0.483 | 0.000 | 219 | 87 | 0.397 | 0.463 | 0.000 |
| 04/A4 | 134 | 34 | 0.254 | 0.282 | 0.059 | 247 | 59 | 0.239 | 0.337 | 0.048 |
| Area 5: Biology (BIO) | ||||||||||
| 05/A1 | 118 | 49 | 0.415 | 0.480 | 0.000 | 284 | 112 | 0.394 | 0.478 | 0.019 |
| 05/A2 | 35 | 17 | 0.486 | 0.548 | 0.000 | 64 | 30 | 0.469 | 0.667 | 0.000 |
| 05/B1 | 108 | 33 | 0.306 | 0.398 | 0.000 | 350 | 117 | 0.334 | 0.427 | 0.000 |
| 05/B2 | 87 | 30 | 0.345 | 0.435 | 0.000 | 210 | 69 | 0.329 | 0.425 | 0.020 |
| 05/C1 | 80 | 58 | 0.725 | 0.853 | 0.000 | 230 | 121 | 0.526 | 0.871 | 0.000 |
| 05/D1 | 151 | 56 | 0.371 | 0.455 | 0.146 | 382 | 130 | 0.340 | 0.411 | 0.140 |
| 05/E1 | 320 | 170 | 0.531 | 0.660 | 0.045 | 695 | 374 | 0.538 | 0.766 | 0.097 |
| 05/E2 | 170 | 78 | 0.459 | 0.761 | 0.134 | 659 | 267 | 0.405 | 0.694 | 0.092 |
| 05/F1 | 189 | 156 | 0.825 | 0.914 | 0.459 | 563 | 389 | 0.691 | 0.921 | 0.301 |
| 05/G1 | 139 | 38 | 0.273 | 0.396 | 0.000 | 405 | 109 | 0.269 | 0.405 | 0.000 |
| 05/H1 | 84 | 38 | 0.452 | 0.551 | 0.000 | 173 | 69 | 0.399 | 0.496 | 0.095 |
| 05/H2 | 64 | 16 | 0.250 | 0.302 | 0.000 | 145 | 28 | 0.193 | 0.292 | 0.000 |
| 05/I1 | 145 | 24 | 0.166 | 0.227 | 0.042 | 394 | 59 | 0.150 | 0.218 | 0.015 |
| Area 6: Medicine (MED) | ||||||||||
| 06/A1 | 57 | 29 | 0.509 | 0.722 | 0.143 | 179 | 86 | 0.480 | 0.813 | 0.136 |
| 06/A2 | 278 | 115 | 0.414 | 0.557 | 0.039 | 542 | 138 | 0.255 | 0.431 | 0.029 |
| 06/A3 | 90 | 18 | 0.200 | 0.281 | 0.000 | 193 | 47 | 0.244 | 0.367 | 0.000 |
| 06/A4 | 74 | 38 | 0.514 | 0.884 | 0.000 | 107 | 56 | 0.523 | 0.836 | 0.000 |
| 06/B1 | 241 | 73 | 0.303 | 0.514 | 0.000 | 449 | 140 | 0.312 | 0.496 | 0.000 |
| 06/C1 | 247 | 160 | 0.648 | 0.879 | 0.000 | 397 | 207 | 0.521 | 0.777 | 0.008 |
| 06/D1 | 125 | 33 | 0.264 | 0.418 | 0.000 | 311 | 123 | 0.395 | 0.641 | 0.000 |
| 06/D2 | 95 | 56 | 0.589 | 0.871 | 0.061 | 194 | 80 | 0.412 | 0.699 | 0.012 |
| 06/D3 | 122 | 37 | 0.303 | 0.600 | 0.016 | 306 | 127 | 0.415 | 0.632 | 0.044 |
| 06/D4 | 170 | 127 | 0.747 | 0.950 | 0.260 | 299 | 196 | 0.656 | 0.941 | 0.052 |
| 06/D5 | 45 | 22 | 0.489 | 0.611 | 0.000 | 106 | 54 | 0.509 | 0.783 | 0.000 |
| 06/D6 | 118 | 60 | 0.508 | 0.725 | 0.053 | 227 | 129 | 0.568 | 0.845 | 0.051 |
| 06/E1 | 96 | 28 | 0.292 | 0.426 | 0.057 | 193 | 72 | 0.373 | 0.508 | 0.119 |
| 06/E2 | 68 | 27 | 0.397 | 0.551 | 0.000 | 164 | 56 | 0.341 | 0.519 | 0.000 |
| 06/E3 | 59 | 23 | 0.390 | 0.444 | 0.214 | 116 | 67 | 0.578 | 0.815 | 0.029 |
| 06/F1 | 107 | 45 | 0.421 | 0.529 | 0.000 | 222 | 131 | 0.590 | 0.720 | 0.000 |
| 06/F2 | 41 | 10 | 0.244 | 0.385 | 0.000 | 81 | 14 | 0.173 | 0.269 | 0.000 |
| 06/F3 | 62 | 56 | 0.903 | 0.964 | 0.333 | 102 | 77 | 0.755 | 0.924 | 0.174 |
| 06/F4 | 138 | 41 | 0.297 | 0.373 | 0.000 | 218 | 62 | 0.284 | 0.354 | 0.000 |
| 06/G1 | 139 | 66 | 0.475 | 0.713 | 0.077 | 280 | 143 | 0.511 | 0.747 | 0.043 |
| 06/H1 | 84 | 40 | 0.476 | 0.909 | 0.000 | 174 | 101 | 0.580 | 0.856 | 0.000 |
| 06/I1 | 117 | 76 | 0.650 | 0.962 | 0.000 | 238 | 130 | 0.546 | 0.949 | 0.000 |
| 06/L1 | 64 | 11 | 0.172 | 0.306 | 0.000 | 125 | 39 | 0.312 | 0.487 | 0.000 |
| 06/M1 | 201 | 70 | 0.348 | 0.449 | 0.074 | 477 | 144 | 0.302 | 0.428 | 0.107 |
| 06/M2 | 95 | 31 | 0.326 | 0.470 | 0.000 | 190 | 76 | 0.400 | 0.526 | 0.105 |
| 06/N1 | 365 | 85 | 0.233 | 0.306 | 0.031 | 799 | 174 | 0.218 | 0.304 | 0.042 |
| Area 7: Agricultural sciences and veterinary medicine (AVM) | ||||||||||
| 07/A1 | 72 | 39 | 0.542 | 0.679 | 0.158 | 103 | 68 | 0.660 | 0.871 | 0.341 |
| 07/B1 | 51 | 33 | 0.647 | 0.767 | 0.000 | 125 | 41 | 0.328 | 0.390 | 0.000 |
| 07/B2 | 57 | 33 | 0.579 | 0.732 | 0.188 | 149 | 69 | 0.463 | 0.553 | 0.038 |
| 07/C1 | 47 | 24 | 0.511 | 0.571 | 0.000 | 86 | 31 | 0.360 | 0.484 | 0.000 |
| 07/D1 | 59 | 44 | 0.746 | 0.808 | 0.286 | 165 | 88 | 0.533 | 0.678 | 0.170 |
| 07/E1 | 76 | 36 | 0.474 | 0.654 | 0.083 | 170 | 102 | 0.600 | 0.702 | 0.326 |
| 07/F1 | 42 | 15 | 0.357 | 0.455 | 0.000 | 137 | 56 | 0.409 | 0.478 | 0.267 |
| 07/F2 | 25 | 14 | 0.560 | 0.778 | 0.000 | 60 | 39 | 0.650 | 0.791 | 0.294 |
| 07/G1 | 56 | 34 | 0.607 | 0.756 | 0.000 | 149 | 67 | 0.450 | 0.663 | 0.000 |
| 07/H1 | 41 | 27 | 0.659 | 1.000 | 0.000 | 59 | 31 | 0.525 | 0.939 | 0.000 |
| 07/H2 | 33 | 22 | 0.667 | 0.786 | 0.000 | 72 | 42 | 0.583 | 0.719 | 0.067 |
| 07/H3 | 33 | 21 | 0.636 | 0.840 | 0.000 | 77 | 53 | 0.688 | 0.897 | 0.053 |
| 07/H4 | 29 | 13 | 0.448 | 0.591 | 0.000 | 41 | 25 | 0.610 | 0.714 | 0.000 |
| 07/H5 | 29 | 18 | 0.621 | 0.643 | 0.000 | 50 | 35 | 0.700 | 0.854 | 0.000 |
| Area 8: Civil engineering and architecture (CEA) | ||||||||||
| 08/A1 | 63 | 22 | 0.349 | 0.367 | 0.000 | 138 | 63 | 0.457 | 0.521 | 0.000 |
| 08/A2 | 59 | 14 | 0.237 | 0.298 | 0.000 | 145 | 39 | 0.269 | 0.390 | 0.000 |
| 08/A3 | 69 | 24 | 0.348 | 0.385 | 0.235 | 117 | 40 | 0.342 | 0.493 | 0.125 |
| 08/A4 | 37 | 12 | 0.324 | 0.429 | 0.000 | 85 | 31 | 0.365 | 0.547 | 0.062 |
| 08/B1 | 34 | 20 | 0.588 | 0.692 | 0.250 | 60 | 38 | 0.633 | 0.762 | 0.333 |
| 08/B2 | 63 | 23 | 0.365 | 0.418 | 0.000 | 95 | 41 | 0.432 | 0.577 | 0.000 |
| 08/B3 | 60 | 25 | 0.417 | 0.481 | 0.000 | 95 | 36 | 0.379 | 0.493 | 0.000 |
| 08/C1 | 150 | 67 | 0.447 | 0.493 | 0.000 | 379 | 156 | 0.412 | 0.536 | 0.000 |
| 08/D1 | 180 | 37 | 0.206 | 0.240 | 0.000 | 548 | 112 | 0.204 | 0.252 | 0.000 |
| 08/E1 | 62 | 26 | 0.419 | 0.500 | 0.000 | 160 | 62 | 0.388 | 0.484 | 0.000 |
| 08/E2 | 134 | 44 | 0.328 | 0.355 | 0.077 | 394 | 97 | 0.246 | 0.293 | 0.029 |
| 08/F1 | 116 | 57 | 0.491 | 0.549 | 0.071 | 356 | 191 | 0.537 | 0.583 | 0.033 |
| Area 9: Industrial and information engineering (IIE) | ||||||||||
| 09/A1 | 87 | 48 | 0.552 | 0.672 | 0.217 | 163 | 77 | 0.472 | 0.679 | 0.020 |
| 09/A2 | 36 | 15 | 0.417 | 0.500 | 0.125 | 77 | 35 | 0.455 | 0.491 | 0.375 |
| 09/A3 | 80 | 45 | 0.562 | 0.589 | 0.286 | 159 | 103 | 0.648 | 0.787 | 0.353 |
| 09/B1 | 29 | 19 | 0.655 | 0.720 | 0.250 | 53 | 38 | 0.717 | 0.737 | 0.667 |
| 09/B2 | 13 | 7 | 0.538 | 0.636 | 0.000 | 51 | 41 | 0.804 | 0.862 | 0.727 |
| 09/B3 | 34 | 15 | 0.441 | 0.577 | 0.000 | 86 | 41 | 0.477 | 0.702 | 0.034 |
| 09/C1 | 64 | 44 | 0.688 | 0.679 | 0.750 | 125 | 59 | 0.472 | 0.525 | 0.378 |
| 09/C2 | 110 | 56 | 0.509 | 0.573 | 0.071 | 201 | 86 | 0.428 | 0.550 | 0.077 |
| 09/D1 | 181 | 33 | 0.182 | 0.224 | 0.000 | 463 | 95 | 0.205 | 0.266 | 0.000 |
| 09/D2 | 47 | 26 | 0.553 | 0.686 | 0.167 | 103 | 51 | 0.495 | 0.635 | 0.138 |
| 09/D3 | 49 | 29 | 0.592 | 0.725 | 0.000 | 67 | 37 | 0.552 | 0.756 | 0.136 |
| 09/E1 | 49 | 20 | 0.408 | 0.500 | 0.000 | 99 | 44 | 0.444 | 0.613 | 0.162 |
| 09/E2 | 66 | 48 | 0.727 | 0.828 | 0.000 | 83 | 46 | 0.554 | 0.737 | 0.154 |
| 09/E3 | 119 | 40 | 0.336 | 0.455 | 0.000 | 205 | 80 | 0.390 | 0.535 | 0.063 |
| 09/E4 | 61 | 24 | 0.393 | 0.436 | 0.000 | 94 | 30 | 0.319 | 0.391 | 0.167 |
| 09/F1 | 56 | 17 | 0.304 | 0.347 | 0.000 | 107 | 41 | 0.383 | 0.554 | 0.000 |
| 09/F2 | 98 | 36 | 0.367 | 0.424 | 0.000 | 153 | 56 | 0.366 | 0.539 | 0.020 |
| 09/G1 | 54 | 44 | 0.815 | 0.886 | 0.500 | 92 | 57 | 0.620 | 0.829 | 0.491 |
| 09/G2 | 80 | 29 | 0.362 | 0.453 | 0.000 | 168 | 63 | 0.375 | 0.562 | 0.063 |
| 09/H1 | 260 | 96 | 0.369 | 0.454 | 0.055 | 413 | 176 | 0.426 | 0.605 | 0.085 |
| Area 10: Antiquities, philology, literary studies, art history (APL) | ||||||||||
| 10/A1 | 160 | 90 | 0.562 | 0.621 | 0.000 | 553 | 324 | 0.586 | 0.669 | 0.000 |
| 10/B1 | 188 | 64 | 0.340 | 0.373 | 0.091 | 529 | 137 | 0.259 | 0.332 | 0.044 |
| 10/C1 | 142 | 62 | 0.437 | 0.513 | 0.111 | 429 | 150 | 0.350 | 0.446 | 0.057 |
| 10/D1 | 45 | 15 | 0.333 | 0.441 | 0.000 | 158 | 42 | 0.266 | 0.328 | 0.056 |
| 10/D2 | 67 | 46 | 0.687 | 0.714 | 0.250 | 185 | 121 | 0.654 | 0.708 | 0.000 |
| 10/D3 | 63 | 33 | 0.524 | 0.525 | 0.500 | 137 | 54 | 0.394 | 0.417 | 0.100 |
| 10/D4 | 92 | 52 | 0.565 | 0.584 | 0.000 | 206 | 88 | 0.427 | 0.466 | 0.000 |
| 10/E1 | 52 | 29 | 0.558 | 0.583 | 0.250 | 149 | 77 | 0.517 | 0.557 | 0.222 |
| 10/F1 | 186 | 54 | 0.290 | 0.319 | 0.050 | 476 | 115 | 0.242 | 0.285 | 0.025 |
| 10/F2 | 86 | 35 | 0.407 | 0.422 | 0.000 | 237 | 95 | 0.401 | 0.459 | 0.000 |
| 10/F3 | 79 | 41 | 0.519 | 0.577 | 0.000 | 194 | 136 | 0.701 | 0.743 | 0.000 |
| 10/G1 | 100 | 42 | 0.420 | 0.427 | 0.250 | 215 | 106 | 0.493 | 0.538 | 0.050 |
| 10/H1 | 42 | 29 | 0.690 | 0.690 | NaN | 158 | 104 | 0.658 | 0.757 | 0.045 |
| 10/I1 | 43 | 22 | 0.512 | 0.524 | 0.000 | 141 | 89 | 0.631 | 0.705 | 0.158 |
| 10/L1 | 127 | 79 | 0.622 | 0.676 | 0.250 | 305 | 179 | 0.587 | 0.637 | 0.156 |
| 10/M1 | 78 | 40 | 0.513 | 0.520 | 0.333 | 128 | 59 | 0.461 | 0.487 | 0.111 |
| 10/M2 | 44 | 15 | 0.341 | 0.389 | 0.125 | 73 | 29 | 0.397 | 0.460 | 0.000 |
| 10/N1 | 75 | 17 | 0.227 | 0.254 | 0.000 | 214 | 101 | 0.472 | 0.555 | 0.000 |
| 10/N3 | 49 | 31 | 0.633 | 0.646 | 0.000 | 119 | 76 | 0.639 | 0.680 | 0.421 |
| Area 11: History, philosophy, pedagogy and psychology (HPP) | ||||||||||
| 11/A1 | 49 | 19 | 0.388 | 0.452 | 0.000 | 172 | 60 | 0.349 | 0.420 | 0.000 |
| 11/A2 | 90 | 30 | 0.333 | 0.370 | 0.000 | 237 | 93 | 0.392 | 0.448 | 0.083 |
| 11/A3 | 116 | 40 | 0.345 | 0.374 | 0.000 | 425 | 173 | 0.407 | 0.441 | 0.000 |
| 11/A4 | 111 | 50 | 0.450 | 0.527 | 0.056 | 322 | 92 | 0.286 | 0.316 | 0.029 |
| 11/A5 | 55 | 23 | 0.418 | 0.449 | 0.167 | 158 | 59 | 0.373 | 0.457 | 0.000 |
| 11/B1 | 88 | 55 | 0.625 | 0.643 | 0.250 | 234 | 153 | 0.654 | 0.695 | 0.238 |
| 11/C1 | 63 | 29 | 0.460 | 0.529 | 0.167 | 217 | 90 | 0.415 | 0.457 | 0.000 |
| 11/C2 | 85 | 32 | 0.376 | 0.395 | 0.000 | 206 | 83 | 0.403 | 0.425 | 0.077 |
| 11/C3 | 89 | 32 | 0.360 | 0.378 | 0.267 | 286 | 118 | 0.413 | 0.460 | 0.059 |
| 11/C4 | 69 | 21 | 0.304 | 0.305 | 0.300 | 226 | 100 | 0.442 | 0.474 | 0.059 |
| 11/C5 | 122 | 49 | 0.402 | 0.432 | 0.091 | 399 | 144 | 0.361 | 0.398 | 0.000 |
| 11/D1 | 88 | 11 | 0.125 | 0.141 | 0.000 | 235 | 44 | 0.187 | 0.216 | 0.000 |
| 11/D2 | 92 | 15 | 0.163 | 0.205 | 0.000 | 237 | 46 | 0.194 | 0.238 | 0.000 |
| 11/E1 | 128 | 54 | 0.422 | 0.523 | 0.200 | 377 | 216 | 0.573 | 0.703 | 0.204 |
| 11/E2 | 65 | 17 | 0.262 | 0.362 | 0.000 | 190 | 46 | 0.242 | 0.316 | 0.070 |
| 11/E3 | 68 | 17 | 0.250 | 0.472 | 0.000 | 178 | 62 | 0.348 | 0.596 | 0.000 |
| 11/E4 | 113 | 15 | 0.133 | 0.209 | 0.022 | 319 | 53 | 0.166 | 0.217 | 0.043 |
| Area 12: Law (LAW) | ||||||||||
| 12/A1 | 136 | 45 | 0.331 | 0.354 | 0.000 | 312 | 84 | 0.269 | 0.311 | 0.022 |
| 12/B1 | 57 | 32 | 0.561 | 0.615 | 0.000 | 186 | 58 | 0.312 | 0.352 | 0.000 |
| 12/B2 | 34 | 13 | 0.382 | 0.433 | 0.000 | 78 | 25 | 0.321 | 0.352 | 0.000 |
| 12/C1 | 88 | 33 | 0.375 | 0.434 | 0.000 | 224 | 74 | 0.330 | 0.379 | 0.000 |
| 12/C2 | 20 | 9 | 0.450 | 0.529 | 0.000 | 48 | 22 | 0.458 | 0.525 | 0.125 |
| 12/D1 | 116 | 34 | 0.293 | 0.321 | 0.000 | 256 | 75 | 0.293 | 0.312 | 0.000 |
| 12/D2 | 31 | 11 | 0.355 | 0.440 | 0.000 | 84 | 16 | 0.190 | 0.229 | 0.000 |
| 12/E1 | 68 | 27 | 0.397 | 0.429 | 0.000 | 164 | 44 | 0.268 | 0.301 | 0.000 |
| 12/E2 | 97 | 25 | 0.258 | 0.272 | 0.000 | 186 | 78 | 0.419 | 0.453 | 0.000 |
| 12/E3 | 60 | 21 | 0.350 | 0.362 | 0.000 | 98 | 33 | 0.337 | 0.413 | 0.087 |
| 12/F1 | 29 | 8 | 0.276 | 0.320 | 0.000 | 65 | 18 | 0.277 | 0.316 | 0.000 |
| 12/G1 | 31 | 11 | 0.355 | 0.407 | 0.000 | 114 | 41 | 0.360 | 0.376 | 0.000 |
| 12/G2 | 32 | 13 | 0.406 | 0.433 | 0.000 | 87 | 42 | 0.483 | 0.539 | 0.091 |
| 12/H1 | 26 | 11 | 0.423 | 0.478 | 0.000 | 58 | 36 | 0.621 | 0.632 | 0.000 |
| 12/H2 | 26 | 11 | 0.423 | 0.450 | 0.333 | 55 | 32 | 0.582 | 0.612 | 0.333 |
| 12/H3 | 36 | 18 | 0.500 | 0.545 | 0.000 | 135 | 58 | 0.430 | 0.460 | 0.000 |
| Area 13: Economics and statistics (ECS) | ||||||||||
| 13/A1 | 310 | 136 | 0.439 | 0.458 | 0.000 | 463 | 208 | 0.449 | 0.479 | 0.146 |
| 13/A2 | 280 | 185 | 0.661 | 0.693 | 0.000 | 417 | 283 | 0.679 | 0.723 | 0.037 |
| 13/A3 | 85 | 49 | 0.576 | 0.583 | 0.000 | 140 | 68 | 0.486 | 0.508 | 0.125 |
| 13/A4 | 193 | 57 | 0.295 | 0.315 | 0.000 | 361 | 124 | 0.343 | 0.375 | 0.000 |
| 13/A5 | 41 | 23 | 0.561 | 0.531 | 0.667 | 69 | 33 | 0.478 | 0.479 | 0.476 |
| 13/B1 | 114 | 49 | 0.430 | 0.467 | 0.000 | 290 | 145 | 0.500 | 0.564 | 0.000 |
| 13/B2 | 141 | 47 | 0.333 | 0.348 | 0.000 | 288 | 112 | 0.389 | 0.444 | 0.000 |
| 13/B3 | 58 | 16 | 0.276 | 0.302 | 0.000 | 143 | 55 | 0.385 | 0.441 | 0.120 |
| 13/B4 | 99 | 59 | 0.596 | 0.608 | 0.000 | 169 | 103 | 0.609 | 0.669 | 0.000 |
| 13/B5 | 27 | 13 | 0.481 | 0.520 | 0.000 | 47 | 23 | 0.489 | 0.548 | 0.000 |
| 13/C1 | 81 | 40 | 0.494 | 0.533 | 0.000 | 145 | 78 | 0.538 | 0.609 | 0.000 |
| 13/D1 | 114 | 27 | 0.237 | 0.245 | 0.000 | 236 | 102 | 0.432 | 0.462 | 0.000 |
| 13/D2 | 63 | 27 | 0.429 | 0.429 | NaN | 113 | 41 | 0.363 | 0.390 | 0.000 |
| 13/D3 | 49 | 22 | 0.449 | 0.458 | 0.000 | 97 | 30 | 0.309 | 0.345 | 0.000 |
| 13/D4 | 100 | 37 | 0.370 | 0.381 | 0.000 | 120 | 46 | 0.383 | 0.407 | 0.000 |
| Area 14: Political and sociel sciences (PSS) | ||||||||||
| 14/A1 | 50 | 19 | 0.380 | 0.413 | 0.000 | 200 | 83 | 0.415 | 0.500 | 0.000 |
| 14/A2 | 65 | 14 | 0.215 | 0.237 | 0.000 | 153 | 55 | 0.359 | 0.404 | 0.000 |
| 14/B1 | 57 | 27 | 0.474 | 0.510 | 0.167 | 177 | 63 | 0.356 | 0.399 | 0.000 |
| 14/B2 | 42 | 21 | 0.500 | 0.526 | 0.250 | 156 | 99 | 0.635 | 0.664 | 0.200 |
| 14/C1 | 148 | 29 | 0.196 | 0.209 | 0.000 | 424 | 71 | 0.167 | 0.193 | 0.000 |
| 14/C2 | 84 | 31 | 0.369 | 0.413 | 0.000 | 283 | 55 | 0.194 | 0.247 | 0.000 |
| 14/D1 | 69 | 21 | 0.304 | 0.350 | 0.000 | 221 | 71 | 0.321 | 0.384 | 0.000 |
Appendix D Medians
Table LABEL:tab:medians contains the values of the medians for full () and associate professor qualification (). In some cases, SDs contain sub-disciplines with a specific code (SSD) and different medians. Sub-disciplines may have been defined for one role only, hence some values are missing. “B” denotes bibliometric disciplines, “NB” denotes non-bibliometric ones. The tag in the last column is to be interpreted as follows: “O” or “OO” means that one or two medians for full professor qualifications are zero; “o” or “oo” means that one or two medians for associate professor qualification are zero; “*” means that medians for associate professor Pareto-dominate those for full professor qualification.
| Sc. Discipline | SSD | Bibliometric? | Full professor | Associate professor | |||||
|---|---|---|---|---|---|---|---|---|---|
| 01/A1 | B | 4.00 | 1.37 | 2.00 | 5.00 | 1.74 | 2.00 | * | |
| 01/A1 | MAT/04 | B | 2.50 | 0.71 | 2.00 | ||||
| 01/A2 | B | 9.00 | 3.23 | 3.00 | 8.00 | 1.65 | 2.00 | ||
| 01/A3 | B | 14.00 | 8.00 | 5.00 | 10.00 | 4.34 | 4.00 | ||
| 01/A4 | B | 15.00 | 8.78 | 5.00 | 13.00 | 5.95 | 4.00 | ||
| 01/A5 | B | 15.50 | 15.72 | 7.00 | 14.00 | 6.06 | 4.00 | ||
| 01/A6 | B | 17.00 | 12.83 | 6.50 | 17.00 | 9.35 | 6.00 | ||
| 01/B1 | B | 12.00 | 14.80 | 6.00 | 10.00 | 9.15 | 5.00 | ||
| 02/A1 | B | 78.00 | 105.03 | 22.00 | 59.50 | 104.08 | 18.00 | ||
| 02/A1 | FIS/01 | B | 55.00 | 67.06 | 14.00 | 44.00 | 42.59 | 11.00 | |
| 02/A2 | B | 24.50 | 47.41 | 11.00 | 23.00 | 34.09 | 10.00 | ||
| 02/B1 | B | 54.00 | 46.72 | 12.00 | 38.00 | 32.09 | 9.00 | ||
| 02/B2 | B | 47.50 | 75.94 | 14.00 | 37.50 | 40.08 | 11.00 | ||
| 02/B2 | FIS/02 | B | 37.50 | 40.08 | 8.00 | ||||
| 02/B2 | FIS/08 | B | 12.00 | 3.02 | 3.00 | 4.50 | 0.33 | 1.50 | |
| 02/B3 | B | 43.50 | 34.63 | 10.00 | 27.00 | 22.47 | 8.00 | ||
| 02/C1 | B | 49.00 | 86.08 | 18.00 | 32.00 | 35.83 | 10.00 | ||
| 02/C1 | FIS/06 | B | 27.50 | 22.01 | 9.00 | 17.00 | 14.00 | 6.00 | |
| 03/A1 | B | 41.00 | 53.81 | 12.00 | 26.00 | 29.47 | 9.00 | ||
| 03/A1 | CHIM/12 | B | 26.00 | 18.29 | 9.00 | ||||
| 03/A2 | B | 42.50 | 46.01 | 11.00 | 34.50 | 34.27 | 10.00 | ||
| 03/B1 | B | 49.50 | 62.38 | 13.00 | 31.00 | 47.05 | 11.00 | ||
| 03/B2 | B | 42.00 | 59.89 | 12.00 | 24.50 | 31.70 | 9.00 | ||
| 03/C1 | B | 41.50 | 55.45 | 12.00 | 33.00 | 42.47 | 10.00 | ||
| 03/C2 | B | 37.00 | 50.01 | 12.00 | 35.00 | 38.77 | 11.00 | ||
| 03/D1 | B | 44.00 | 42.85 | 12.00 | 28.00 | 28.00 | 9.00 | ||
| 03/D2 | B | 43.00 | 48.60 | 12.00 | 24.00 | 35.30 | 10.00 | ||
| 04/A1 | B | 25.00 | 29.94 | 10.00 | 19.00 | 14.29 | 7.00 | ||
| 04/A1 | GEO/06 | B | 25.00 | 29.94 | 9.00 | ||||
| 04/A1 | GEO/09 | B | 25.00 | 7.26 | 7.00 | 19.00 | 8.53 | 6.00 | |
| 04/A2 | B | 17.00 | 15.31 | 8.00 | 13.00 | 8.74 | 6.00 | ||
| 04/A2 | GEO/02 | B | 17.00 | 15.31 | 7.00 | ||||
| 04/A3 | B | 9.00 | 3.06 | 4.00 | 6.00 | 2.00 | 3.00 | ||
| 04/A4 | B | 19.00 | 14.18 | 6.00 | 17.00 | 13.66 | 6.00 | ||
| 04/A4 | GEO/11 | B | 11.50 | 6.61 | 5.00 | 17.00 | 6.33 | 4.50 | |
| 05/A1 | B | 20.00 | 13.25 | 7.00 | 12.00 | 8.74 | 6.00 | ||
| 05/A1 | BIO/02 | B | 6.50 | 13.25 | 4.00 | 12.00 | 2.43 | 3.00 | |
| 05/A2 | B | 20.00 | 35.47 | 10.00 | 14.00 | 24.45 | 8.50 | ||
| 05/B1 | B | 28.50 | 18.64 | 8.00 | 16.00 | 8.20 | 5.50 | ||
| 05/B1 | BIO/08 | B | 18.00 | 18.64 | 5.50 | ||||
| 05/B2 | B | 26.00 | 22.96 | 9.00 | 18.50 | 16.66 | 7.00 | ||
| 05/C1 | B | 26.00 | 18.63 | 9.00 | 21.50 | 15.77 | 8.00 | ||
| 05/D1 | B | 25.00 | 44.88 | 12.00 | 19.00 | 26.47 | 9.00 | ||
| 05/E1 | B | 32.00 | 42.61 | 11.00 | 21.00 | 32.04 | 10.00 | ||
| 05/E2 | B | 37.00 | 80.32 | 15.00 | 17.00 | 40.64 | 11.00 | ||
| 05/F1 | B | 29.00 | 40.65 | 12.00 | 22.00 | 33.41 | 10.00 | ||
| 05/G1 | B | 41.50 | 75.58 | 15.00 | 24.50 | 38.34 | 11.00 | ||
| 05/G1 | BIO/15 | B | 30.00 | 32.06 | 10.50 | 24.50 | 15.94 | 8.00 | |
| 05/H1 | B | 31.50 | 35.54 | 10.00 | 23.00 | 26.61 | 8.00 | ||
| 05/H2 | B | 28.00 | 42.35 | 12.00 | 23.00 | 38.26 | 11.00 | ||
| 05/I1 | B | 28.00 | 47.16 | 13.00 | 19.00 | 28.41 | 9.00 | ||
| 06/A1 | B | 62.50 | 113.33 | 17.50 | 30.50 | 66.18 | 13.00 | ||
| 06/A2 | B | 32.50 | 67.32 | 14.00 | 25.00 | 53.07 | 12.00 | ||
| 06/A2 | MED/02 | B | 8.00 | 1.00 | 3.00 | 25.00 | 1.66 | 2.50 | |
| 06/A3 | B | 31.00 | 38.40 | 12.00 | 25.00 | 29.75 | 9.00 | ||
| 06/A4 | B | 59.00 | 88.18 | 15.00 | 41.00 | 37.60 | 12.00 | ||
| 06/B1 | B | 63.00 | 86.83 | 17.00 | 33.50 | 49.62 | 12.00 | ||
| 06/C1 | B | 25.00 | 13.36 | 7.00 | 15.00 | 8.33 | 6.00 | ||
| 06/D1 | B | 62.50 | 87.69 | 16.00 | 35.00 | 41.99 | 11.00 | ||
| 06/D2 | B | 69.00 | 106.36 | 18.00 | 39.00 | 52.19 | 12.00 | ||
| 06/D2 | MED/14 | B | 69.00 | 44.95 | 18.00 | ||||
| 06/D2 | MED/49 | B | 29.50 | 80.12 | 13.00 | ||||
| 06/D3 | B | 89.00 | 155.14 | 22.00 | 44.50 | 63.04 | 14.00 | ||
| 06/D3 | MED/16 | B | 44.50 | 43.24 | 12.50 | ||||
| 06/D4 | B | 67.00 | 66.03 | 15.00 | 37.00 | 35.19 | 11.00 | ||
| 06/D4 | MED/35 | B | 67.00 | 38.26 | 10.50 | ||||
| 06/D5 | B | 45.00 | 37.75 | 12.50 | 27.50 | 29.88 | 8.50 | ||
| 06/D6 | B | 78.00 | 82.76 | 16.00 | 43.00 | 60.70 | 13.00 | ||
| 06/E1 | B | 36.50 | 21.51 | 9.00 | 22.00 | 10.88 | 7.00 | ||
| 06/E2 | B | 42.83 | 16.85 | 7.50 | 26.00 | 12.15 | 6.00 | ||
| 06/E2 | MED/19 | B | 42.83 | 6.85 | 6.50 | 26.00 | 7.33 | 6.00 | |
| 06/E3 | B | 36.00 | 22.72 | 8.00 | 21.50 | 11.25 | 6.00 | ||
| 06/E3 | MED/29 | B | 36.00 | 8.55 | 6.00 | ||||
| 06/F1 | B | 21.00 | 8.16 | 6.00 | 10.00 | 2.78 | 4.00 | ||
| 06/F2 | B | 28.00 | 20.42 | 9.00 | 16.50 | 11.51 | 6.50 | ||
| 06/F3 | B | 28.00 | 13.96 | 7.00 | 16.00 | 7.36 | 5.00 | ||
| 06/F3 | MED/32 | B | 28.00 | 2.60 | 4.00 | ||||
| 06/F4 | B | 17.75 | 9.42 | 6.00 | 14.50 | 3.55 | 4.00 | ||
| 06/G1 | B | 62.00 | 52.84 | 14.00 | 28.00 | 31.03 | 10.50 | ||
| 06/H1 | B | 57.00 | 50.80 | 14.00 | 23.00 | 20.75 | 8.00 | ||
| 06/I1 | B | 44.50 | 33.07 | 10.00 | 27.00 | 24.33 | 9.00 | ||
| 06/L1 | B | 31.00 | 25.57 | 10.00 | 18.00 | 14.06 | 7.00 | ||
| 06/M1 | B | 26.00 | 19.95 | 8.50 | 20.50 | 13.10 | 7.00 | ||
| 06/M1 | MED/45 | B | 20.50 | 13.10 | 3.00 | ||||
| 06/M2 | B | 16.00 | 6.84 | 6.00 | 8.37 | 4.62 | 4.00 | ||
| 06/M2 | MED/43 | B | 16.00 | 6.84 | 4.00 | ||||
| 06/N1 | B | 29.00 | 35.25 | 11.00 | 21.50 | 19.84 | 8.00 | ||
| 07/A1 | B | 2.00 | 0.05 | 1.00 | 2.50 | 0.34 | 1.00 | * | |
| 07/B1 | B | 13.00 | 5.68 | 4.00 | 12.00 | 3.38 | 3.50 | ||
| 07/B2 | B | 15.00 | 9.64 | 6.00 | 8.00 | 3.48 | 4.00 | ||
| 07/B2 | AGR/06 | B | 4.50 | 0.69 | 2.00 | ||||
| 07/C1 | B | 6.00 | 1.61 | 3.00 | 7.00 | 2.91 | 3.00 | * | |
| 07/C1 | AGR/09 | B | 7.00 | 2.91 | 2.50 | ||||
| 07/C1 | AGR/10 | B | 6.00 | 1.61 | 2.00 | 7.00 | 2.91 | 2.00 | * |
| 07/D1 | B | 15.00 | 5.75 | 6.00 | 12.00 | 4.40 | 5.00 | ||
| 07/D1 | AGR/11 | B | 12.00 | 4.40 | 3.00 | ||||
| 07/E1 | B | 26.50 | 20.51 | 8.00 | 17.00 | 14.09 | 7.00 | ||
| 07/E1 | AGR/14 | B | 26.50 | 7.66 | 5.00 | 17.00 | 4.39 | 4.00 | |
| 07/F1 | B | 25.00 | 19.13 | 8.00 | 20.00 | 15.89 | 8.00 | ||
| 07/F2 | B | 31.00 | 33.00 | 11.00 | 24.00 | 21.63 | 9.00 | ||
| 07/G1 | B | 23.00 | 10.36 | 6.00 | 17.00 | 5.73 | 5.00 | ||
| 07/G1 | AGR/18 | B | 17.00 | 5.73 | 4.00 | ||||
| 07/H1 | B | 26.50 | 14.38 | 7.00 | 19.50 | 9.18 | 5.00 | ||
| 07/H2 | B | 22.00 | 8.77 | 5.50 | 20.00 | 7.64 | 5.00 | ||
| 07/H3 | B | 34.50 | 18.82 | 8.00 | 22.50 | 13.58 | 7.00 | ||
| 07/H4 | B | 16.00 | 7.28 | 5.00 | 17.00 | 6.47 | 5.00 | ||
| 07/H5 | B | 11.00 | 2.10 | 3.00 | 10.00 | 3.52 | 4.00 | ||
| 07/H5 | VET/09 | B | 11.00 | 2.10 | 2.00 | ||||
| 08/A1 | B | 9.00 | 4.25 | 4.00 | 7.50 | 3.53 | 3.50 | ||
| 08/A2 | B | 9.00 | 5.10 | 4.00 | 10.00 | 3.02 | 4.00 | ||
| 08/A2 | ING-IND/28 | B | 3.00 | 0.15 | 2.00 | ||||
| 08/A2 | ING-IND/29 | B | 6.00 | 3.02 | 4.00 | ||||
| 08/A3 | B | 3.00 | 0.36 | 1.50 | 4.00 | 1.04 | 2.00 | * | |
| 08/A3 | ICAR/04 | B | 4.00 | 1.04 | 1.00 | ||||
| 08/A4 | B | 5.00 | 1.30 | 2.00 | 3.00 | 0.82 | 2.00 | ||
| 08/B1 | B | 5.00 | 4.09 | 4.00 | 5.00 | 2.54 | 3.00 | ||
| 08/B2 | B | 12.50 | 8.96 | 5.50 | 11.00 | 6.14 | 5.00 | ||
| 08/B3 | B | 9.00 | 4.40 | 4.00 | 8.00 | 3.18 | 4.00 | ||
| 08/C1 | NB | 2.00 | 19.00 | 0.00 | 2.00 | 16.00 | 0.00 | Oo | |
| 08/D1 | NB | 2.00 | 19.00 | 0.00 | 2.00 | 12.00 | 0.00 | Oo | |
| 08/D1 | ICAR/15 | NB | 0.50 | 12.00 | 0.00 | o | |||
| 08/E1 | NB | 1.00 | 25.00 | 0.00 | 2.00 | 15.00 | 0.00 | Oo | |
| 08/E2 | NB | 1.50 | 21.00 | 0.00 | 1.00 | 16.00 | 0.00 | Oo | |
| 08/F1 | NB | 2.00 | 23.00 | 0.00 | 1.00 | 14.00 | 0.00 | Oo | |
| 08/F1 | ICAR/20 | NB | 1.00 | 23.00 | 0.00 | O | |||
| 09/A1 | B | 10.00 | 6.25 | 5.00 | 10.00 | 3.09 | 3.00 | ||
| 09/A1 | ING-IND/02 | B | 1.50 | 0.39 | 1.00 | 3.37 | 0.73 | 1.50 | * |
| 09/A1 | ING-IND/03 | B | 10.00 | 1.39 | 2.00 | ||||
| 09/A2 | B | 9.00 | 5.47 | 5.00 | 7.00 | 5.72 | 4.00 | ||
| 09/A3 | B | 12.00 | 5.58 | 4.00 | 13.50 | 6.29 | 4.50 | * | |
| 09/A3 | ING-IND/15 | B | 7.00 | 1.78 | 3.00 | 8.00 | 2.10 | 3.00 | * |
| 09/B1 | B | 14.00 | 7.31 | 5.00 | 13.00 | 7.38 | 5.00 | ||
| 09/B2 | B | 9.00 | 3.78 | 5.00 | 9.00 | 4.44 | 4.00 | ||
| 09/B3 | B | 7.00 | 7.00 | 5.00 | 8.00 | 4.60 | 4.00 | ||
| 09/C1 | B | 6.00 | 2.21 | 3.00 | 8.00 | 3.70 | 4.00 | * | |
| 09/C2 | B | 8.00 | 3.82 | 4.00 | 11.00 | 3.09 | 4.00 | ||
| 09/C2 | ING-IND/11 | B | 4.00 | 1.62 | 3.00 | ||||
| 09/D1 | B | 29.00 | 27.12 | 9.00 | 20.50 | 19.13 | 7.50 | ||
| 09/D1 | ING-IND/21 | B | 9.50 | 7.79 | 5.50 | ||||
| 09/D2 | B | 34.00 | 27.91 | 9.00 | 18.00 | 18.53 | 8.00 | ||
| 09/D2 | ING-IND/26 | B | 18.00 | 18.53 | 7.00 | ||||
| 09/D3 | B | 30.50 | 30.25 | 10.00 | 20.00 | 26.00 | 9.00 | ||
| 09/E1 | B | 18.00 | 13.95 | 6.00 | 18.00 | 11.88 | 6.00 | ||
| 09/E2 | B | 8.00 | 10.00 | 6.00 | 9.00 | 8.36 | 5.00 | ||
| 09/E2 | ING-IND/33 | B | 8.00 | 10.00 | 5.00 | ||||
| 09/E3 | B | 26.00 | 23.58 | 8.00 | 23.00 | 17.11 | 7.00 | ||
| 09/E4 | B | 13.00 | 12.55 | 6.00 | 18.00 | 14.15 | 6.00 | * | |
| 09/E4 | ING-IND/12 | B | 13.00 | 4.91 | 4.00 | 13.00 | 4.09 | 4.00 | |
| 09/F1 | B | 33.00 | 21.14 | 8.00 | 23.00 | 17.14 | 8.00 | ||
| 09/F2 | B | 21.00 | 20.56 | 7.00 | 21.00 | 19.78 | 7.00 | ||
| 09/G1 | B | 18.00 | 21.02 | 8.00 | 18.00 | 20.00 | 8.00 | ||
| 09/G2 | B | 36.00 | 42.58 | 12.00 | 30.00 | 31.39 | 8.00 | ||
| 09/H1 | B | 13.00 | 13.48 | 6.00 | 10.00 | 10.67 | 6.00 | ||
| 10/A1 | NB | 1.00 | 23.00 | 3.00 | 1.00 | 17.00 | 1.00 | ||
| 10/A1 | L-ANT/01 | NB | 0.00 | 17.00 | 1.00 | o | |||
| 10/A1 | L-ANT/09 | NB | 0.50 | 23.00 | 3.00 | ||||
| 10/A1 | L-FIL-LET/01 | NB | 0.00 | 17.00 | 1.00 | o | |||
| 10/B1 | NB | 1.00 | 24.00 | 0.00 | 2.00 | 17.00 | 0.00 | Oo | |
| 10/C1 | NB | 2.00 | 19.00 | 1.00 | 2.00 | 16.00 | 1.00 | ||
| 10/C1 | L-ART/07 | NB | 2.00 | 16.00 | 0.00 | o | |||
| 10/C1 | L-ART/08 | NB | 2.00 | 13.00 | 0.00 | o | |||
| 10/D1 | NB | 1.00 | 19.00 | 3.00 | 1.00 | 14.00 | 2.00 | ||
| 10/D2 | NB | 1.00 | 18.00 | 3.00 | 1.00 | 12.00 | 1.00 | ||
| 10/D2 | L-FIL-LET/07 | NB | 0.00 | 9.00 | 1.00 | o | |||
| 10/D2 | L-LIN/20 | NB | 1.00 | 12.00 | 0.00 | o | |||
| 10/D3 | NB | 1.00 | 14.00 | 3.00 | 1.00 | 7.00 | 1.00 | ||
| 10/D4 | NB | 1.00 | 15.50 | 2.00 | 1.00 | 10.00 | 1.00 | ||
| 10/D4 | L-ANT/05 | NB | 0.00 | 10.00 | 1.00 | o | |||
| 10/D4 | L-FIL-LET/06 | NB | 1.00 | 15.50 | 0.00 | 1.00 | 10.00 | 0.00 | Oo |
| 10/E1 | NB | 2.00 | 14.00 | 3.00 | 1.00 | 14.00 | 2.00 | ||
| 10/F1 | NB | 2.00 | 18.00 | 2.00 | 2.00 | 15.00 | 2.00 | ||
| 10/F2 | NB | 2.00 | 16.00 | 2.00 | 2.00 | 16.50 | 1.00 | ||
| 10/F3 | NB | 2.00 | 19.50 | 2.00 | 2.00 | 14.50 | 1.00 | ||
| 10/F3 | L-FIL-LET/13 | NB | 1.00 | 19.50 | 2.00 | 1.50 | 14.50 | 1.00 | |
| 10/G1 | NB | 1.00 | 20.00 | 0.00 | 1.00 | 18.00 | 0.00 | Oo | |
| 10/H1 | NB | 1.00 | 15.00 | 1.00 | 2.00 | 10.50 | 0.00 | o | |
| 10/H1 | L-LIN/04 | NB | 1.00 | 15.00 | 0.00 | O | |||
| 10/I1 | NB | 2.00 | 19.50 | 1.00 | 2.00 | 14.00 | 0.00 | o | |
| 10/I1 | L-LIN/07 | NB | 1.00 | 14.00 | 0.00 | o | |||
| 10/L1 | NB | 1.00 | 15.00 | 1.00 | 1.00 | 12.00 | 1.00 | ||
| 10/M1 | NB | 1.00 | 15.00 | 1.00 | 1.00 | 12.00 | 0.00 | o | |
| 10/M1 | L-FIL-LET/15 | NB | 0.00 | 15.00 | 0.00 | OO | |||
| 10/M2 | NB | 2.00 | 15.50 | 2.00 | 1.00 | 18.00 | 1.00 | ||
| 10/N1 | NB | 2.00 | 15.00 | 2.00 | 1.50 | 16.50 | 2.00 | ||
| 10/N1 | L-OR/01 | NB | 1.50 | 15.00 | 2.00 | ||||
| 10/N1 | L-OR/04 | NB | 1.00 | 15.00 | 2.00 | ||||
| 10/N1 | L-OR/10 | NB | 2.00 | 11.50 | 1.50 | ||||
| 10/N1 | L-OR/12 | NB | 2.00 | 15.00 | 0.00 | 1.50 | 7.00 | 0.00 | Oo |
| 10/N3 | NB | 1.00 | 10.00 | 1.00 | 2.00 | 10.00 | 0.00 | o | |
| 10/N3 | L-OR/21 | NB | 1.00 | 10.00 | 0.50 | ||||
| 10/N3 | L-OR/22 | NB | 0.00 | 9.00 | 0.00 | OO | |||
| 11/A1 | NB | 2.00 | 19.00 | 1.00 | 2.00 | 17.50 | 0.00 | o | |
| 11/A2 | NB | 2.00 | 18.00 | 0.00 | 2.00 | 12.00 | 0.00 | Oo | |
| 11/A3 | NB | 2.00 | 16.00 | 0.00 | 1.71 | 11.50 | 0.00 | Oo | |
| 11/A4 | NB | 2.00 | 18.00 | 0.00 | 1.00 | 12.00 | 0.00 | Oo | |
| 11/A4 | M-STO/09 | NB | 1.00 | 18.00 | 0.00 | O | |||
| 11/A5 | NB | 2.00 | 17.00 | 1.00 | 2.00 | 12.50 | 1.00 | ||
| 11/B1 | NB | 1.00 | 14.00 | 0.00 | 1.00 | 12.00 | 0.00 | Oo | |
| 11/C1 | NB | 4.00 | 21.50 | 1.00 | 2.50 | 13.50 | 0.00 | o | |
| 11/C2 | NB | 1.11 | 18.00 | 1.00 | 2.00 | 10.00 | 1.00 | ||
| 11/C3 | NB | 3.00 | 21.50 | 1.00 | 2.00 | 14.00 | 0.00 | o | |
| 11/C4 | NB | 3.00 | 23.00 | 1.00 | 2.00 | 19.00 | 0.50 | ||
| 11/C4 | M-FIL/05 | NB | 2.00 | 23.00 | 1.00 | ||||
| 11/C5 | NB | 2.00 | 21.00 | 1.00 | 2.00 | 13.50 | 0.00 | o | |
| 11/D1 | NB | 3.00 | 22.00 | 1.00 | 3.00 | 13.00 | 0.00 | o | |
| 11/D2 | NB | 4.00 | 22.50 | 2.00 | 3.00 | 13.00 | 0.00 | o | |
| 11/E1 | B | 23.00 | 19.33 | 9.00 | 14.00 | 11.84 | 6.00 | ||
| 11/E1 | M-PSI/03 | B | 23.00 | 7.89 | 9.00 | 4.50 | 11.84 | 3.00 | |
| 11/E2 | B | 7.00 | 2.47 | 3.00 | 4.00 | 1.35 | 2.00 | ||
| 11/E3 | B | 5.00 | 1.45 | 3.00 | 4.50 | 1.50 | 2.50 | ||
| 11/E4 | B | 11.00 | 3.09 | 4.00 | 5.00 | 1.32 | 2.00 | ||
| 11/E4 | M-PSI/07 | B | 11.00 | 3.09 | 2.50 | 3.00 | 1.32 | 2.00 | |
| 12/A1 | NB | 1.00 | 12.00 | 2.00 | 2.00 | 8.00 | 1.00 | ||
| 12/B1 | NB | 1.00 | 15.00 | 6.00 | 1.00 | 8.00 | 3.00 | ||
| 12/B2 | NB | 1.00 | 21.00 | 9.00 | 1.00 | 12.50 | 5.00 | ||
| 12/C1 | NB | 2.00 | 21.00 | 4.00 | 1.05 | 15.00 | 3.00 | ||
| 12/C2 | NB | 2.00 | 19.00 | 6.00 | 2.00 | 8.00 | 5.00 | ||
| 12/D1 | NB | 1.00 | 17.00 | 3.00 | 1.00 | 9.00 | 1.00 | ||
| 12/D1 | IUS/09 | NB | 1.00 | 8.00 | 0.00 | O | |||
| 12/D2 | NB | 1.00 | 22.00 | 7.00 | 1.00 | 15.00 | 6.00 | ||
| 12/E1 | NB | 1.00 | 19.00 | 4.00 | 1.00 | 12.00 | 3.00 | ||
| 12/E2 | NB | 1.00 | 17.00 | 3.00 | 2.00 | 11.50 | 2.00 | ||
| 12/E3 | NB | 1.00 | 15.00 | 5.00 | 2.00 | 14.00 | 4.00 | ||
| 12/F1 | NB | 1.25 | 23.75 | 13.00 | 1.00 | 17.00 | 7.00 | ||
| 12/G1 | NB | 2.00 | 17.00 | 6.00 | 1.00 | 11.50 | 2.00 | ||
| 12/G2 | NB | 1.00 | 20.00 | 7.00 | 2.00 | 11.00 | 4.00 | ||
| 12/H1 | NB | 2.00 | 13.00 | 2.50 | 1.00 | 6.00 | 1.00 | ||
| 12/H2 | NB | 2.00 | 16.00 | 2.00 | 2.00 | 7.00 | 1.00 | ||
| 12/H3 | NB | 3.00 | 17.00 | 2.00 | 2.00 | 12.00 | 1.00 | ||
| 13/A1 | NB | 0.00 | 12.11 | 1.50 | 0.00 | 11.00 | 2.00 | Oo | |
| 13/A2 | NB | 1.00 | 13.00 | 0.50 | 0.00 | 13.16 | 1.00 | o | |
| 13/A3 | NB | 0.00 | 13.00 | 0.00 | 0.00 | 14.50 | 1.00 | OOo* | |
| 13/A4 | NB | 1.00 | 16.00 | 0.00 | 1.00 | 18.00 | 0.00 | Oo* | |
| 13/A5 | NB | 0.00 | 16.00 | 6.00 | 0.00 | 14.00 | 5.00 | Oo | |
| 13/B1 | NB | 3.00 | 9.00 | 0.00 | 3.00 | 10.00 | 0.00 | Oo* | |
| 13/B2 | NB | 2.00 | 15.00 | 0.00 | 2.00 | 14.00 | 0.00 | Oo | |
| 13/B3 | NB | 1.00 | 14.00 | 0.00 | 1.50 | 11.55 | 0.00 | Oo | |
| 13/B4 | NB | 1.00 | 9.00 | 0.00 | 1.00 | 8.00 | 0.00 | Oo | |
| 13/B4 | SECS-P/09 | NB | 1.00 | 5.00 | 0.00 | o | |||
| 13/B5 | NB | 0.00 | 21.00 | 0.00 | 1.00 | 17.00 | 0.00 | OOo | |
| 13/C1 | NB | 1.00 | 15.00 | 0.00 | 1.00 | 14.50 | 0.00 | Oo | |
| 13/C1 | SECS-P/04 | NB | 0.50 | 15.00 | 0.00 | 0.00 | 14.50 | 0.00 | Ooo |
| 13/D1 | NB | 0.00 | 17.00 | 1.00 | 0.00 | 15.00 | 1.00 | Oo | |
| 13/D1 | SECS-S/02 | NB | 0.00 | 11.00 | 1.00 | o | |||
| 13/D2 | NB | 0.00 | 11.00 | 0.00 | 0.00 | 15.00 | 0.00 | OOoo* | |
| 13/D3 | NB | 0.00 | 16.00 | 0.00 | 0.00 | 21.50 | 0.00 | OOoo* | |
| 13/D4 | NB | 0.00 | 12.00 | 2.00 | 0.00 | 10.00 | 1.00 | Oo | |
| 14/A1 | NB | 2.00 | 17.00 | 1.00 | 2.00 | 13.50 | 0.00 | o | |
| 14/A2 | NB | 2.00 | 15.50 | 2.00 | 1.05 | 14.00 | 1.00 | ||
| 14/B1 | NB | 2.00 | 15.00 | 0.00 | 2.00 | 10.00 | 0.00 | Oo | |
| 14/B1 | SPS/03 | NB | 0.50 | 10.00 | 0.00 | o | |||
| 14/B2 | NB | 2.00 | 11.00 | 1.00 | 1.00 | 13.00 | 1.00 | ||
| 14/B2 | SPS/05 | NB | 2.00 | 11.00 | 0.00 | 1.00 | 13.00 | 0.00 | Oo |
| 14/B2 | SPS/06 | NB | 1.00 | 13.00 | 0.00 | o | |||
| 14/C1 | NB | 2.00 | 17.00 | 1.00 | 2.00 | 11.00 | 1.00 | ||
| 14/C2 | NB | 3.00 | 17.00 | 1.00 | 2.85 | 15.00 | 1.00 | ||
| 14/D1 | NB | 2.00 | 16.00 | 2.00 | 2.00 | 12.00 | 2.00 | ||
References
- Law dec. 30, n. 240 (2010) Law dec. 30, n. 240, Rules concerning the organization of universities, academic personnel and recruitment procedures, and empowering the government to promote quality and efficiency of the university system (Norme in materia di organizzazione delle università, di personale accademico e reclutamento, nonche’ delega al Governo per incentivare la qualità e l’efficienza del sistema universitario), Gazzetta Ufficiale n. 10 – Suppl. Ordinario n. 11, jan 14, 2010. URL: http://www.camera.it/parlam/leggi/10240l.htm, accessed on 2014/11/13.
- Kelly and Jennions (2006) C. D. Kelly, M. D. Jennions, The h index and career assessment by numbers, Trends in Ecology & Evolution 21 (2006) 167–170.
- DM 159 (2012a) DM 159, Redefinition of scientific disciplines (Rideterminazione dei settori concorsuali), Ministerial Decree 159, June 12, 2012a. URL: http://attiministeriali.miur.it/anno-2012/giugno/dm-12062012.aspx, accessed on 2014-11-15.
- DM 159 (2012b) DM 159, Payment for foreign members of the national scientific qualification commitee (Compenso da corrispondere ai componenti in servizio all’estero della commissione nazionale prevista per il conseguimento dell’abilitazione scientifica nazionale), Ministerial Decree 159, January 4, 2012b. URL: http://attiministeriali.miur.it/anno-2012/gennaio/di-04012012.aspx, accessed on 2014-11-29.
- DM 76 (2012) DM 76, Criteria and parameters for evaluation of applicants for the national scientific qualification (Regolamento recante criteri e parametri per la valutazione dei candidati ai fini dell’attribuzione dell’Abilitazione Scientifica Nazionale), Ministerial Decree 76, June 7, 2012. URL: http://attiministeriali.miur.it/anno-2012/giugno/dm-07062012.aspx, accessed on 2014-11-15.
- ANVUR (2013) ANVUR, National scientific qualification – normalization of indicators by academic age (Abilitazione scientifica nazionale -– la normalizzazione degli indicatori per l’età accademica), 2013. URL: http://www.anvur.org/attachments/article/253/normalizzazione_indicatori_0.pdf.
- Sidiropoulos et al. (2007) A. Sidiropoulos, D. Katsaros, Y. Manolopoulos, Generalized hirsch h-index for disclosing latent facts in citation networks, Scientometrics 72 (2007) 253–280.
- ANVUR (2012) ANVUR, Computation of indicators to be used for selection of committee members and for evaluation of applications to national scientific qualification (Modalità di calcolo degli indicatori da utilizzare ai fini della selezione degli aspiranti commissari e della valutazione dei candidati per l’abilitazione scientifica nazionale), Delibera n. 50, 2012. URL: http://www.anvur.org/attachments/article/252/Delibera50_12.pdf, accessed on 2014-08-20.
- Profumo (2013) F. Profumo, Newsletter of the ministry of education, university and research concerning some aspects of the new discipline for granting the national scientific qualification introduced by law 240 on dec. 30, 2010 (Nota Circolare del Ministero dell’Istruzione, dell’Università e della Ricerca su alcuni aspetti della nuova disciplina per il conseguimento dell’abilitazione scientifica nazionale introdotta dalla legge 30 dicembre 2010, n. 240), January 11, 2013.
- Sahel (2011) J.-A. Sahel, Quality versus quantity: Assessing individual research performance, Science Translational Medicine 3 (2011) 84cm13.
- IEEE (2013) IEEE, Appropriate use of bibliometric indicators for the assessment of journals, research proposals, and individuals, Adopted by the IEEE Board of Directors 9 September 2013, 2013. URL: https://www.ieee.org/publications_standards/publications/rights/ieee_bibliometric_statement_sept_2013.pdf.
- Laloë and Mosseri (2009) F. Laloë, R. Mosseri, Bibliometric evaluation of individual researchers: not even right… not even wrong!, Europhysics News 40 (2009) 26–29.
- Institute de France (2011) Institute de France, On the proper use of bibliometrics to evaluate individual researchers, Report presented on 17 January 2011 to the Minister of Higher Education and Research, 2011. URL: http://www.academie-sciences.fr/activite/rapport/avis170111gb.pdf.
- R Core Team (2014) R Core Team, R: A Language and Environment for Statistical Computing, R Foundation for Statistical Computing, Vienna, Austria, 2014. URL: http://www.R-project.org.
- ANVUR (2012a) ANVUR, Table 2: medians for full professor applicants, bibliometric disciplines (Tabella 2 Mediane candidati professore ordinario Settori bibliometrici), 2012a. URL: http://www.anvur.org/attachments/article/253/Tabella_2_mediane_candidati_abilitazione_PO_BIB.pdf, accessed on 2014-08-20.
- ANVUR (2012b) ANVUR, Table 3: medians for associate professor applicants, bibliometric disciplines (Tabella 3 Mediane candidati professore associato Settori bibliometrici), 2012b. URL: http://www.anvur.org/attachments/article/253/Tabella_3_mediane_candidati_abilitazione_PA_BIB.pdf, accessed on 2014-08-20.
- ANVUR (2012c) ANVUR, Table 2: medians for full professor applicants, non-bibliometric disciplines (Tabella 2 Mediane candidati professore ordinario Settori non bibliometrici), 2012c. URL: http://www.anvur.org/attachments/article/253/Tabella_2_mediane_candidati_abilitazione_PO_NON%20BIB.pdf, accessed on 2014-08-20.
- ANVUR (2012d) ANVUR, Table 3: medians for associate professor applicants, non-bibliometric disciplines (Tabella 3 Mediane candidati professore associato Settori non bibliometrici), 2012d. URL: http://www.anvur.org/attachments/article/253/Tabella_3_mediane_candidati_abilitazione_PA_NON%20BIB.pdf, accessed on 2014-08-20.
- ANVUR (2012e) ANVUR, Medians for the indicator “number of papers on class-A journals” for scientific disciplines of area 12 – LAW (Valori mediani dell’indicatore “numero di articoli su riviste appartenenti alla classe A” per i settori concorsuali dell’area 12 – Scienze giuridiche), 2012e. URL: http://www.anvur.org/attachments/article/253/medianeclassea_area12.pdf.
- Tukey (1977) J. W. Tukey, Exploratory Data Analysis, Addison-Wesley series in behavioral science, Addison-Wesley Publishing Company, 1977.
- Myers et al. (2010) J. Myers, A. Well, R. Lorch, Research Design and Statistical Analysis, 3rd edition, Routledge, 2010.
- Hirsch (2005) J. E. Hirsch, An index to quantify an individual’s scientific research output, Proceedings of the National Academy of Sciences of the United States of America 102 (2005) 16569–16572.
- Albarrán et al. (2011) P. Albarrán, J. A. Crespo, I. Ortuño, J. Ruiz-Castillo, The skewness of science in 219 sub-fields and a number of aggregates, Scientometrics 88 (2011) 385–397.
- Abramo et al. (2011) G. Abramo, C. A. D’Angelo, F. Di Costa, Research productivity: Are higher academic ranks more productive than lower ones?, Scientometrics 88 (2011) 915–928.
- NIST (2012) NIST, NIST/SEMATECH e-handbook of statistical methods, Online, April 2012. URL: http://www.itl.nist.gov/div898/handbook/, accessed on 2014-11-11.
- Ministère de l’Education Nationale, de l’Enseignement Supèrieur et de la Recherche (2013) Ministère de l’Education Nationale, de l’Enseignement Supèrieur et de la Recherche, Campagne de recrutement et d’affectation des maîtres de conférences et des professeurs des universités, session 2013, 2013. URL: http://cache.media.enseignementsup-recherche.gouv.fr/file/statistiques/00/6/bilrec13_327006.pdf, accessed on 2014-11-28.