Linear magnetoresistance caused by mobility fluctuations in the -doped Cd3As2
Abstract
Cd3As2 is a candidate three-dimensional Dirac semi-metal which has exceedingly high mobility and non-saturating linear magnetoresistance that may be relevant for future practical applications. We report magnetotransport and tunnel diode oscillation measurements on Cd3As2, in magnetic fields up to 65 T and temperatures between 1.5 K to 300 K. We find the non-saturating linear magnetoresistance persist up to 65 T and it is likely caused by disorder effects as it scales with the high mobility, rather than directly linked to Fermi surface changes even when approaching the quantum limit. From the observed quantum oscillations, we determine the bulk three-dimensional Fermi surface having signatures of Dirac behaviour with non-trivial Berry’s phase shift, very light effective quasiparticle masses and clear deviations from the band-structure predictions. In very high fields we also detect signatures of large Zeeman spin-splitting ().
pacs:
75.47.-m, 71.18.+y, 74.25.JbA three-dimensional (3D) Dirac semi-metal is a three-dimensional analogue of graphene, where the valence and conduction bands touch at discrete points in reciprocal space with a linear dispersion. These special points are protected from gap formation by crystal symmetry and such a topologically non-trivial band structure may harbour unusual electronic states. A Dirac semi-metal may be tuned to attain a Weyl semi-metal phase through breaking of inversion or time reversal symmetry Wang et al. (2013). Alternatively, if the symmetry protection from gapping is removed a three dimensional topological insulator could be stabilized on the surface Wang et al. (2013). 3D Dirac semi-metals are rare and an opportunity to realize such a state in Cd3As2 has generated a lot of interest. Surface probes, such as ARPES and STM Borisenko et al. (2014); Madhab et al. (2013); Liu et al. (2014); Sangjun et al. (2014), found that the linear dispersion extends up to high energy 200-500 meV, strongly dependent on the cleavage directions Yi et al. (2014). Furthermore, the large non-saturating linear magnetoresistance (MR) found in Cd3As2 Feng et al. (2014); Liang et al. (2014) in high mobilities samples was assigned to the lifting of protection against backscattering caused by possible field-induced Fermi surface changes Feng et al. (2014); Liang et al. (2014).
In this paper we report a magnetotransport study in high magnetic fields up to 65 T of -doped Cd3As2 beyond the quantum limit that reveal no discernable Fermi surface change except those caused by the large Zeeman splitting. We observe Shubnikov-de Haas (SdH) quantum oscillations that allow us to characterize the three-dimensional Fermi surface and its relevant parameters. The observed linear MR in ultra-high magnetic fields and the values of the linear magnetoresistance are closely linked to the mobility field scale. This suggests that the unconventional, non-saturating, large and linear magneto-resistance in our electron-doped crystals of Cd3As2 is likely to originate from mobility fluctuations caused by As vacancies. We also discuss the deviations of experiments from the standard density functional theory (DFT) calculations.
Methods Crystals of Cd3As2 were grown both by solid state reaction and solution growth from Cd-rich melt due to it very narrow growth window Ali et al. (2014); Canfield and Fisk (1992). X-ray diffraction show that our single crystals of Cd3As2 crystallize in the tetragonal symmetry group with lattice parameters =12.6595(6) Å and =25.4557(10) Å, cleaving preferentially in the (112) plane, in agreement with previous studies Ali et al. (2014) [see Supplementary Material (SM)]. Band structure calculations were performed with Wien2K including the spin-orbit coupling Blaha et al. (2001) using the structural details from Ref.Ali et al. (2014). We have performed magnetotransport measurements in the standard Hall and resistivity configuration using a low frequency lock-in technique by changing the direction of the magnetic field, , to extract the symmetric () and the anti-symmetric () component of the resistivity tensor, respectively. The transverse magnetoresistance () was measured for different orientations, being the angle between and the normal to the (122) plane. Measurements were conducted on three different batches (, and ), mostly on crystals from batch (, , etc.) having the lowest carrier concentration. Measurements were performed at low temperatures (1.5 K) in steady fields up to 18 T in Oxford and in pulsed fields up to 65 T at the LNCMI, Toulouse. We also measured skin depth in pulsed fields using a tunnel diode oscillator technique (TDO) by recording the change in frequency of an LC tank circuit with the sample wound in a copper coil, reported data being corrected for the magnetoresponse of the empty coil.
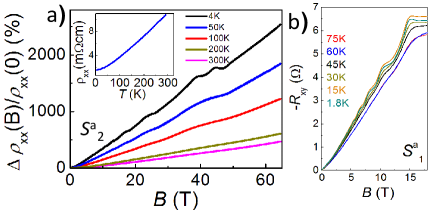
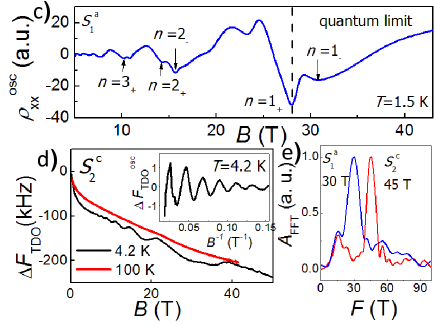
Fig. 1a) shows the magnetoresistance, (B)/(0) as a function of magnetic field up to 65 T for sample at fixed temperatures between 4 K and 300 K. The MR is linear and unusually large, and shows a strong temperature dependence. Both the resistance and the magnetoresistance change by a factor of 5 from 300 K to 4 K [inset of Fig. 1a]) and the link between these two quantities will be discussed in detail later. Fig. 1b) show the Hall component, up to 18 T for up to 75 K (raw data also in SM). Quantum oscillations are discernible, on a highly linear background, from as low as 3 T with a characteristic frequency varying for different samples between 30 to 50 T, shown in Fig.1c-e) and listed in Table 1. Spin-splitting effects are evident in very high magnetic fields approaching the quantum limit (=1) in Fig.1c. The field dependence of resonant frequency from TDO measurements for sample is shown in Fig. 1d) together with subtracted quantum oscillations. This frequency variation, , tracks the change in impedance of the coil and is a measure of the skin depth of the sample, .
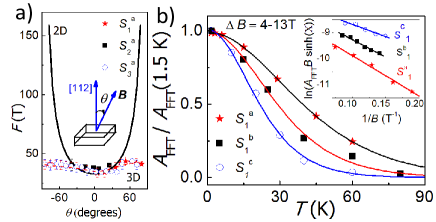
Quantum oscillations The quantum oscillations in conductivity are given by , where is the Berry’s phase and is the SdH frequency of the oscillations, corresponding to an extremal area of the Fermi surface perpendicular to the magnetic field, . Fig. 2a) shows the angular dependence of SdH frequencies by rotating away from the (112) plane for different samples. The SdH frequencies show very little variation as a function of the orientation in magnetic field, from 31 T to 45 T for sample (see also Table 1). This behaviour is expected for a three-dimensional elliptical Fermi surface with vector, extracted from Osanger relationship , and varying between Å-1. This values give a very small carrier concentration of cm-3, consistent with that from Hall measurements =cm-3 [extracted from in Fig.1b], assuming two elliptical pockets as shown in Table 1. A Lifshitz transition as a function of doping occurs from two small elliptical Fermi surfaces centered at the Dirac node (Å-1 away from ) Liu et al. (2014) to a larger merged elliptical Fermi surface centered now at (see SM). Band structure calculations suggest that this transition should occur very close to the Fermi level ( meV), whereas in the surface experiments is not seen up to 300 meV Sangjun et al. (2014); Liu et al. (2014) (see inset Fig.2c and SM). This is a rather surprising discrepancy between the band structure and experiments and it will required further understanding.
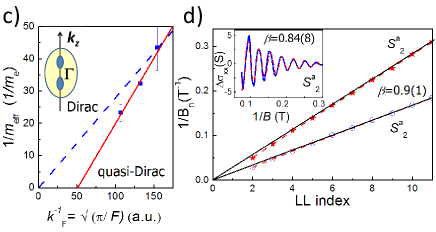
The temperature dependence of the amplitude of the quantum oscillations up to 90 K can be used to extract the values of the effective cyclotron mass , using the standard Lifshitz-Kosevich formalism Shoenberg (1984), , which also holds for the Dirac spectrum Sharapov et al. (2004), as shown in Fig. 2b). For parabolic bands, one would expect to be constant as a function of doping, while for Dirac bands . The measured effective mass extracted for our samples from different batches vary from 0.023 to 0.043 , increasing with and the corresponding carrier concentration, , as listed in Table 1. This suggests a deviation from a parabolic band dispersion whereas the high mobility values found in Cd3As2 points usually towards a linear dispersion. Having samples with different concentrations, one could attempt to extract the Fermi velocity, , directly from the slope of versus , shown in Fig. 2c, which gives a finite intercept suggesting a departure from a perfect Dirac behaviour [possibly linked to band structure effects that show hole-like bending towards (see SM)]. The estimation of is similar to those extracted from ARPES, m/s Borisenko et al. (2014); Liu et al. (2014), with deviations caused by orbitally-averaged effects (see also Table 1). We have also extracted the values of -factor from the spin-split oscillations visible at high fields [see Fig. 1c)], corresponding to the spin-up and spin-down Landau levels () that cross the Fermi level and give a large value of , consistent with previous reports Singh and Wallace (1983); Wallace (1979).
The Berry’s phase, , can take values of for parabolic dispersion and for a Dirac point Taskin and Ando (2011). To extract the Berry’s phase, we use the conductivity, , by measuring both and simultaneously (see SM) and inverting the resistivity tensor, as shown in the inset of Fig.2d). The direct fit of gives a value of , in agreement with previous reports, as shown in Table 1. Another method to extract is given by the linear intercept of an index plot of the conductivity minima versus inverse magnetic field; in the low-field region (from =4) that gives [solid line in Fig.2d]), whereas in high magnetic fields the position of the minima are affected by the spin-splitting and a non-linear fan diagram analysis detailed in Ref.Taskin and Ando (2011); Wright and McKenzie (2013) gives [dashed line in Fig.2d)].
Scattering The field dependence of the amplitude of quantum oscillations at fixed temperatures [inset Fig.2b)] gives access to the Dingle temperature, which is a measure of the field dependent damping of the quantum oscillations due to impurity scattering. For sample the quantum scattering time given by /(), corresponds to a quantum mobility of cm2/Vs and mean free path of nm. These values are in good agreement to some of the reports for single crystals and thin films, as shown in Table 1. Another way to estimate the mobility is to apply a simple Drude model to the Hall and resistivity data. Using the carrier concentration estimated from the Hall effect cm-3 and cm for sample (shown in SM), the classical mobility from is =80,000 cm2/Vs, a factor up to 13 larger than the mobility from quantum oscillations, . This difference in the two mobilities is common as they measure different scattering processes. The SdH estimated mobility is affected by all processes that cause the Landau level broadening, i.e quantum scattering time, , measures how long a carrier stays in a momentum eigenstate whereas the classical Drude mobility is only affected by scattering processes that deviate the current path, i.e the classical scattering time (transport time) is a measure of how long a particle moves along the applied electric field gradient. Thus, the quantum mobility is susceptible to small angle and large angle scattering, while the transport (classical) mobility is susceptible only to large angle scattering. The ratio / is a measure of the relative importance of small angle scattering; Table 1 suggests that small angle scattering dominates in all our samples, in particular for lower doping .
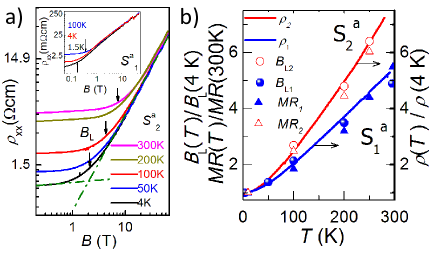
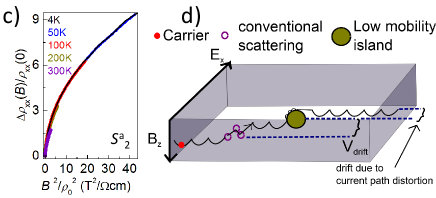
Linear magnetoresistance Now we discuss the origin of the unconventional linear MR in a transverse magnetic field for two crystals of Cd3As2 (shown initially in Fig.1a)) plotted in Fig.3a) on a log-log scale to emphasize the low field behaviour. We observe that the linear MR behaviour is established above a crossover field, . Interestingly, we find that and the relative change in magnetoresistance, (B)/(0), vary with temperature in the same ratio as the mobility, and, consequently, the resistivity ratio ()[see Fig.3b)]. Furthermore, we find that all MR curves collapse onto a single curve in a Kohler’s plot for temperatures below 200 K, suggesting that a single relevant scattering process is dominant in Cd3As2, as shown in Fig.3c). Small deviations at higher temperatures are caused by the onset of phonon scattering, consistent with the Debye temperature of 200 K Bartkowski et al. (1989).
| T | T | 1018 cm-3 | 1018 cm-3 | 106 m/s | K | nm | m2/Vs | m2/Vs | |||||
| 31(4) | 45(4) | 1.0(2) | 1.8(2) | 0.023(4) | 1.54(4) | 15.4(8) | 122(8) | 0.60(1) | 8.0(5) | 13.3(4) | 16(4) | 0.83(8) | |
| 42(4) | 52(4) | 1.5(2) | 2.5(2) | 0.031(3) | 1.33(4) | 14.4(8) | 112(8) | 0.47(1) | 3.4(3) | 7.1(4) | 15(3) | 1.08(6) | |
| 67(4) | 74(4) | 3.1(2) | 3.8(2) | 0.043(4) | 1.21(4) | 9.8(8) | 150(8) | 0.51(1) | 2.9(3) | 5.7(4) | - | 0.84(4) | |
| Lit. | 20-90 | 20-90 | 0.1-8 | 2-20 | 0.03-0.08 | 0.4-12 | 11-17 | - | 0.1- | 1- | 1- | 2-100 | - |
| Refs. | Rosenman (1969); Feng et al. (2014) | Rosenman (1969) | Feng et al. (2014); Liang et al. (2014) | Feng et al. (2014); Liang et al. (2014) | Rosenman (1969); Feng et al. (2014) | Rosenman (1969); Borisenko et al. (2014) | Blom et al. (1980) | - | Feng et al. (2014); Liang et al. (2014) | Liang et al. (2014) | Liang et al. (2014) | Sangjun et al. (2014); Singh and Wallace (1983); Wallace (1979) | - |
The conventional MR shows a quadratic dependence at low fields and saturation for Fermi surfaces with closed orbits in high fields, such that ; in our samples the crossover field can be estimated as 1 T. Linear MR has been predicted by Abrikosov Abrikosov (1998) to occur in the quantum limit, only beyond the Landau level. However, in our crystals the value of is much lower than the position of the level around 32 T.
Another explanation for the presence of linear MR has its origin in classical disorder models. For example, linear MR was realized for highly disordered Parish and Littlewood (2003); Hu et al. (2007), or weakly disordered-high mobility samples Herring (1960), thin films and quantum Hall systems Simon and Halperin (1994). The linear MR arises because the local current density acquires spatial fluctuations in both magnitude and direction, as a result of the heterogeneity or microstructure caused by non-homogeneous carrier and mobility distribution [see Fig.3d]. There are a series of experimental realization of linear MR in disordered systems, such as Ag2±δSe and Ag2±δTe Hu and Rosenbaum (2008), two-dimensional systems (epitaxial graphite) Aamir et al. (2012); Friedman et al. (2010), In(As/Sb)Kozlova et al. (2012), LaSb2 Bud’ko et al. (1998), LaAgSb2 Wang and Petrovic (2012).
Monte Carlo simulations for a system with a few islands of enhanced scattering embedded in a medium of high mobility Kozlova et al. (2012), suggest that MR is linked to the generation of an effective drift velocity perpendicular to cycloid motion in applied electric field caused by multiple small angle scattering of charge carriers by the islands (see Fig. 3d). For such a mechanism the mobility is determined by the island separation and depending on the value of , the linear MR emerging from this process will be associated with , which tracks the island separation if and tracks if . Thus, the absolute value of the linear MR and would vary like (linked to values) [Fig.3b]. This scaling is consistent with the classical disordered model originating from fluctuating mobilities for the observed linear MR in Cd3As2,
Lastly, we comment on the possible source of disorder in Cd3As2. STM measurements found disordered patches with a typical size of 10 nm and separated by distances of 50 nm, attributed to As vacancy clusters Sangjun et al. (2014), likely to appear during the growth in a Cd-rich environment with a small width formation for Cd3As2 Ali et al. (2014). Assuming a disorder density comparable to the carrier concentration, , and a dielectric constant of =16 (see Ref.Brian (2014)), one can estimate the classical mobility as being 30000 cm2/Vs for Cd3As2, which is similar to our measured classical mobilities, . The lower quantum mobility, corresponds to small angle scattering when carriers travel over the mean free path, nm, which is similar to the distribution of As vacancy clusters imaged by STM Sangjun et al. (2014) [see Fig.3d)]. Furthermore, a mobility ratio points towards As vacancies as being the small angle scatterers in Cd3As2 Das Sarma and Stern (1985). Concerning the possible changes of the Fermi surface induced by magnetic field in in Cd3As2 our data that access the quantum limit [for Sample in Fig.1c)] we find no evidence of additional frequencies (only spin-splitting due to the large factors) or changes in scattering (Dingle term) up to 65 T.
In conclusion, we have used ultra high magnetic fields to characterize the Fermi surface of Cd3As2 and to understand the origin of its linear magnetoresistance. The Fermi surface of Cd3As2 has an elliptical shape with a non-trivial Berry’s phase. We find that the linear MR enhancement scales with mobility in Cd3As2 and likely originates from fluctuating mobilities regions that caused inhomogeneous current paths. Close to the quantum limit we find no evidence for Fermi surface reconstruction except the observed spin-splitting effects caused by the large factors. The robust sample dependent linear MR suggest a possible avenue for tuning sample quality and further enhancing its MR for useful practical devices.
We acknowledge fruitful discussions with John Chalker, Steve Simon, Zohar Ringel and Gabor Halasz and useful comments given by David Macdougal and S. L. Bud’ko. This work was mainly supported by EPSRC (EP/L001772/1, EP/I004475/1, EP/I017836/1). Part of the work was performed at the LNCMI, member of the European Magnetic Field Laboratory (EMFL). AIC acknowledges an EPSRC Career Acceleration Fellowship (EP/I004475/1). Work done at Ames Lab was supported by the U.S. Department of Energy, Office of Basic Energy Science, Division of Materials Sciences and Engineering. Ames Laboratory is operated for the U.S. Department of Energy by Iowa State University under Contract No. DE-AC02- 07CH11358. Y.C. acknowledges the support from the EPSRC (UK) grant EP/K04074X/1 and a DARPA (US) MESO project (no. N66001-11-1-4105).
References
- Wang et al. (2013) Z. Wang, H. Weng, Q. Wu, X. Dai, and Z. Fang, Phys. Rev. B 88, 125427 (2013).
- Borisenko et al. (2014) S. Borisenko, Q. Gibson, D. Evtushinsky, V. Zabolotnyy, B. Büchner, and R. J. Cava, Phys. Rev. Lett. 113, 027603 (2014).
- Madhab et al. (2013) N. Madhab, X. SuYang, R. Sankar, N. Alidoust, G. Bian, C. Liu, I. Belopolski, T.-R. Chang, H.-T. Jeng, H. Lin, et al., arXiv:1309.7892 (2013).
- Liu et al. (2014) Z. K. Liu, J. Jiang, B. Zhou, Z. J. Wang, Y. Zhang, H. M. Weng, D. Prabhakaran, S.-K. Mo, H. Peng, P. Dudin, et al., Nat. Mater. 13, 677 (2014).
- Sangjun et al. (2014) J. Sangjun, Z. Brian, G. Andras, F. Benjamin, K. Itamar, P. Andrew, G. Quinn, C. Robert, V. Ashvin, and Y. Ali, Nature Materials (2014).
- Yi et al. (2014) H. Yi, Z. Wang, C. Chen, Y. Shi, Y. Feng, A. Liang, Z. Xie, S. He, J. He, Y. Peng, et al., Sci. Rep. 4 (2014).
- Feng et al. (2014) J. Feng, Y. Pang, D. Wu, Z. Wang, H. Weng, J. Li, X. Dai, Z. Fang, Y. Shi, and L. Lu, arXiv:1405.6611 (2014).
- Liang et al. (2014) T. Liang, G. Quinn, N. Ali Mazhar, M. Liu, R. J. Cava, and N. P. Ong, arXiv:1404.7794 (2014).
- Ali et al. (2014) M. N. Ali, Q. Gibson, S. Jeon, B. B. Zhou, A. Yazdani, and R. J. Cava, Inorganic Chemistry 53, 4062 (2014).
- Canfield and Fisk (1992) P. C. Canfield and Z. Fisk, Phil. Mag. B 65, 1117 (1992).
- Blaha et al. (2001) P. Blaha, K. Schwarz, G. Madsen, D. Kvasnicka, and J. Luitz, WIEN2k, An Augmented Plane Wave + Local Orbitals Program for Calculating Crystal Properties (2001).
- Shoenberg (1984) D. Shoenberg, Magnetic Oscillations in Metals (Cambridge University Press, Cambridge, England, 1984).
- Sharapov et al. (2004) S. G. Sharapov, V. P. Gusynin, and H. Beck, Phys. Rev. B 69, 075104 (2004).
- Singh and Wallace (1983) M. Singh and P. Wallace, Solid State Communications 45, 9 (1983), ISSN 0038-1098.
- Wallace (1979) P. R. Wallace, physica status solidi (b) 92, 49 (1979), ISSN 1521-3951.
- Taskin and Ando (2011) A. A. Taskin and Y. Ando, Phys. Rev. B 84, 035301 (2011).
- Wright and McKenzie (2013) A. R. Wright and R. H. McKenzie, Phys. Rev. B 87, 085411 (2013).
- Bartkowski et al. (1989) K. Bartkowski, G. Pompe, and E. Hegenbarth, physica status solidi (a) 111, K165 (1989), ISSN 1521-396X.
- Rosenman (1969) I. Rosenman, J. Phys. Chem. Sol. 30, 1385 (1969), ISSN 0022-3697.
- Blom et al. (1980) F. Blom, J. Cremers, J. Neve, and M. Gelten, Solid State Communications 33, 69 (1980), ISSN 0038-1098.
- Abrikosov (1998) A. A. Abrikosov, Phys. Rev. B 58, 2788 (1998).
- Parish and Littlewood (2003) M. Parish and P. Littlewood, Nature 426 (2003).
- Hu et al. (2007) J. Hu, M. M. Parish, and T. F. Rosenbaum, Phys. Rev. B 75, 214203 (2007).
- Herring (1960) C. Herring, J. Appl. Physics 31, 1939 (1960).
- Simon and Halperin (1994) S. H. Simon and B. I. Halperin, Phys. Rev. Lett. 73, 3278 (1994).
- Hu and Rosenbaum (2008) J. Hu and T. F. Rosenbaum, Nature Materials 7, 697 (2008).
- Aamir et al. (2012) M. A. Aamir, S. Goswami, M. Baenninger, V. Tripathi, M. Pepper, I. Farrer, D. A. Ritchie, and A. Ghosh, Phys. Rev. B 86, 081203 (2012).
- Friedman et al. (2010) A. L. Friedman, J. L. Tedesco, P. M. Campbell, J. C. Culbertson, E. Aifer, F. K. Perkins, R. L. Myers-Ward, J. K. Hite, C. R. Eddy, G. G. Jernigan, et al., Nano Letters 10, 3962 (2010).
- Kozlova et al. (2012) N. Kozlova, N. Mori, O. Makarovsky, L. Eaves, Q. Zhuang, A. Krier, and A. Patan, Nature Communications 3 (2012).
- Bud’ko et al. (1998) S. L. Bud’ko, P. C. Canfield, C. H. Mielke, and A. H. Lacerda, Phys. Rev. B 57, 13624 (1998).
- Wang and Petrovic (2012) K. Wang and C. Petrovic, Phys. Rev. B 86, 155213 (2012).
- Brian (2014) S. Brian, arXiv:1406.2318 (2014).
- Das Sarma and Stern (1985) S. Das Sarma and F. Stern, Phys. Rev. B 32, 8442 (1985).