High-lying OH absorption, [C ii] deficits, and extreme ratios in galaxies
Abstract
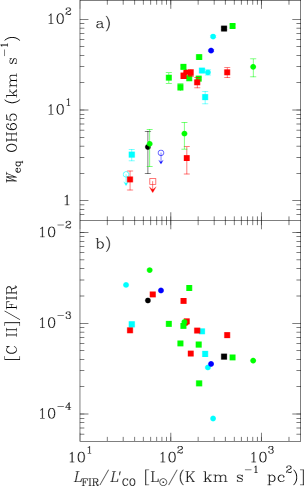
Herschel/PACS observations of 29 local (Ultra-)Luminous Infrared Galaxies, including both starburst and AGN-dominated sources as diagnosed in the mid-infrared/optical, show that the equivalent width of the absorbing OH 65 m line () with lower level energy K, is anticorrelated with the [C ii]158 m line to far-infrared luminosity ratio, and correlated with the far-infrared luminosity per unit gas mass and with the 60-to-100 m far-infrared color. While all sources are in the active L⊙/M⊙ mode as derived from previous CO line studies, the OH65 absorption shows a bimodal distribution with a discontinuity at L⊙/M⊙. In the most buried sources, OH65 probes material partially responsible for the silicate m absorption. Combined with observations of the OH 71 m doublet ( K), radiative transfer models characterized by the equivalent dust temperature, , and the continuum optical depth at 100 m, , indicate that strong [C ii]158 m deficits are associated with far-IR thick (, cm-2), warm ( K) structures where the OH 65 m absorption is produced, most likely in circumnuclear disks/tori/cocoons. With their high ratios and columns, the presence of these structures is expected to give rise to strong [C ii] deficits. probes the fraction of infrared luminosity arising from these compact/warm environments, which is % in sources with high . Sources with high have surface densities of both and higher than inferred from the half-light (CO or UV/optical) radius, tracing coherent structures that represent the most buried/active stage of (circum)nuclear starburst-AGN co-evolution.
Subject headings:
galaxies: ISM — galaxies: evolution — infrared: galaxies — line: formation1. Introduction
From the first spectroscopic observations of (ultra)luminous infrared galaxies ((U)LIRGs) in the far-infrared (far-IR) domain with the Infrared Space Observatory (ISO), evidence was found that the strength of fine-structure lines (from both ions and atoms) in emission are generally anticorrelated with the depth and excitation of the molecular lines observed in absorption (Fischer et al., 1999). The most commonly observed line, the fine-structure [C ii]157.7 m transition (hereafter [C ii]), tends to exhibit a strong deficit with respect to the far-IR luminosity in ULIRGs relative to less luminous systems (Luhman et al., 1998, 2003). In normal galaxies, the [C ii]/FIR luminosity ratio remains nearly constant (%), while it decreases in galaxies with warmer far-IR colors (Malhotra et al., 2001; Díaz-Santos et al., 2013). On the other hand, studies of individual templates (Arp 220 and Mrk 231) indicated that high far-IR radiation densities associated with the nuclear regions of galaxies with [C ii] deficits, are required to account for the observed high-lying molecular absorption (González-Alfonso et al., 2004, 2008, hereafter G-A08).
The launch of the Herschel Space Observatory (Pilbratt et al., 2010) has dramatically improved the sensitivity of these measurements. Observations with the PACS spectrometer (Poglitsch et al., 2010) soon revealed that the observed deficit of [C ii] relative to the far-IR emission applies to all far-IR fine-structure lines (Fischer et al., 2010; Farrah et al., 2013; Graciá-Carpio et al., 2011, hereafter G-C11). G-C11 also showed that the deficits are better correlated with than with , while PACS observations of three (U)LIRGs with strong line deficits, NGC 4418, Arp 220, and Mrk 231, showed deep absorption in high-lying molecular lines (González-Alfonso et al., 2012, 2014a, hereafter G-A12 and G-A14). NGC 4418 is a case in point, as it shows the highest [C ii] deficit, a moderate L⊙ but a high L⊙/M⊙ (G-C11), and the highest-lying H2O absorption among all galaxies with full FIR spectra (G-A12).
To explore the connection between intense far-IR fields and both the highly excited molecular gas and the [C ii] deficit, we investigate the relationship between the OH transition at m (hereafter OH65) with K, and the [C ii] line, , the m silicate absorption, and the far-IR colors, also using measurements of the OH transition at m (hereafter OH71, K) in galaxies for which it is available. OH is a versatile molecule with high abundances in active regions including photodissociated regions (PDRs), cosmic-ray dominated regions (CRDRs), and X-ray dominated regions (XDRs) (e.g. Goicoechea & Cernicharo, 2002; Goicoechea et al., 2011; Meijerink et al., 2011; González-Alfonso et al., 2013), and traces powerful galactic-scale molecular outflows in some sources (Fischer et al., 2010; Sturm et al., 2011; Spoon et al., 2013; Veilleux et al., 2013, hereafter V13; G-A14) mostly associated with large AGN luminosity fractions and luminosities. In extragalactic sources, the OH65 doublet (when detected) is absorption-dominated, indicating that the excitation of the lower level is governed by radiative (rather than collisional) processes111 Collisional excitation of followed by OH65 absorption is not dominant owing to the high Einstein coefficient of the 84 m () transition; efficient OH65 absorption involves a high radiation density such that it will also dominate the excitation of under reasonable physical condictions.. The OH65 pumping thus involves successive absorptions in the 119, 84, and finally in the 65 m doublet with high Einstein coefficients (, , and s-1, see the energy level diagram of OH in G-A14), thus ensuring an excellent probe of strong far-IR fields.
2. Observations
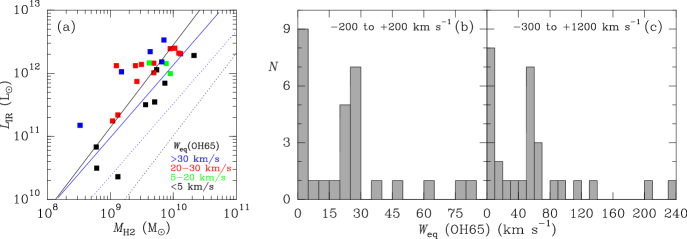
We have used Herschel/PACS observations of the OH65 transition in local () galaxies, included in the Herschel guaranteed time key program SHINING (PI: E. Sturm) and in three OT programs (PIs: E. González-Alfonso; J. Fischer, S. Hailey-Dunsheath). Table 1 lists the sample galaxies and their properties. With a total of 29 galaxies, the sample is biased towards ULIRGs (including 17 out of the 18 most luminous sources in the IRAS Revised Bright Galaxy Sample; Sanders et al., 2003), but also contains less luminous systems including Seyferts and Hii galaxies. The OH71 doublet was observed in a subsample of 15 sources. The locations of the targets in the plane, shown in Fig. 1a, indicate that all except NGC 4945 (with L⊙) belong to the high mode ( L⊙/M⊙) as compared with normal/disk galaxies (Daddi et al., 2010; Genzel et al., 2010).
The data were reduced using the standard PACS reduction and calibration pipeline included in HIPE and , recalibrating the data with a reference telescope spectrum obtained from observations of Neptune (G-C11). A few spectra were also reduced using HIPE . There are moderate calibration differences (typically % and in a few sources up to %) in both line and continuum flux densities between HIPE and , but the continuum-normalized spectra used to measure the OH equivalent widths were found essentially identical in the different versions. Likewise, the PACS-based ratios presented below ([C ii]/FIR and ) are not sensitive to global calibration issues.
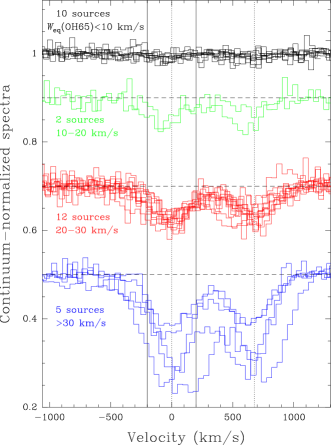
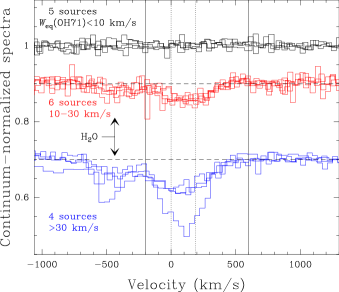
The OH65 spectra, displayed in Fig. 2, are dominated by absorption at central velocities, but some sources show detection of blue wings (e.g. Mrk 231, G-A14). Redshifted reemission by the blue component of the doublet from outflowing gas on the far side of the nucleus has the effect of decreasing the relative strength of the red component of the doublet (see asymmetrical doublets in Fig. 2). We measured the equivalent width () of the OH doublet between and km s-1 around the blue component of the doublet, and between and km s-1, covering essentially the whole doublet (Table 2 and Fig. 2). This work is focussed on the structures traced by the excited OH at central velocities, so hereafter we primarily study in the and km s-1 velocity range while the outflowing gas component will be treated in a separate study. The OH71 spectra, shown in Fig. 3, also indicate peak absorption at central velocities.
Most sources in the sample are unresolved with the PACS spatial resolution, and thus measured from the central PACS spaxel applies to the whole galaxy. For resolved sources (M82, Arp 299a, NGC 1068, NGC 253, and NGC 4945), was measured from the 25-spaxel combined spectra, covering a field of view (FoV) of . Likewise, , the flux of the [C ii] line, the FIR, and the flux densities at 60 and 100 m ( and ) were all integrated over the total PACS FoV. Even for the extended sources, the PACS and agree to within % with the 60 and 100 m IRAS flux densities (Sanders et al., 2003; Surace et al., 2004), indicating that PACS recovers the bulk of the galaxy far-IR continuum emission and the represent global values. The IRAS 25 m flux densities () are then also used in our analysis. All PACS-measured [C ii] line fluxes agree with the ISO-LWS values or upper limits (Brauher et al., 2008) within 40%, and most of them within 25%. Most values of were estimated from the spatially-integrated CO(1-0) luminosities from previous studies (Table 1) by using a conversion factor decreasing with (G-C11). Since the sources in our sample are warm, was mostly applied (Table 1); only UGC 5101, NGC 7469, and especially NGC 4945 have significantly higher .
| Galaxy | RCO | |||||||||
|---|---|---|---|---|---|---|---|---|---|---|
| name | (Mpc) | ( L⊙) | ( Ll) | (M⊙/Ll) | ( M⊙) | ( L⊙/M⊙) | ||||
| (1) | (2) | (3) | (4) | (5) | (6) | (7) | (8) | (9) | (10) | (11) |
| IRAS 07251-0248 | Sp | |||||||||
| IRAS 09022-3615 | GC | |||||||||
| M 82 | We05aaCO (1-0) flux within the central kpc2, which reduces to half within the inner kpc2. | |||||||||
| IRAS 13120-5453 | ||||||||||
| NGC 253 | Ho97bbCorrected for our adopted distance. | |||||||||
| NGC 1068 | Sc83ccAdopting Jy/K for FCRAO (Papadopoulos et al., 2012) and correcting for extended emission. | |||||||||
| IRAS F05189-2524 | Pa12 | |||||||||
| IRAS F08572+3915 | So97ddCO (1-0) fluxes corrected for Jy/K, IRAM-30m telescope. | |||||||||
| UGC 5101 | So97ddCO (1-0) fluxes corrected for Jy/K, IRAM-30m telescope. | |||||||||
| IRAS F10565+2448 | So97ddCO (1-0) fluxes corrected for Jy/K, IRAM-30m telescope. | |||||||||
| Arp 299a | Ca99 | |||||||||
| IRAS F11506-3851 | Mi90eeAdopting Jy/K for SEST. | |||||||||
| IRAS F12112+0305 | Ch09 | |||||||||
| NGC 4418 | Pa12 | |||||||||
| Mrk 231 | So97ddCO (1-0) fluxes corrected for Jy/K, IRAM-30m telescope. | |||||||||
| NGC 4945 | He94ffCorrected for extended emission, a CO (1-0) flux of Jy km s-1 is estimated. | |||||||||
| Mrk 273 | So97ddCO (1-0) fluxes corrected for Jy/K, IRAM-30m telescope. | |||||||||
| IRAS F14348-1447 | Ch09 | |||||||||
| IRAS F14378-3651 | Mi90eeAdopting Jy/K for SEST. | |||||||||
| Zw 049.057 | Pa12 | |||||||||
| IRAS F15250+3609 | Ch09 | |||||||||
| Arp 220 | So97ddCO (1-0) fluxes corrected for Jy/K, IRAM-30m telescope. | |||||||||
| NGC 6240 | So97ddCO (1-0) fluxes corrected for Jy/K, IRAM-30m telescope. | |||||||||
| IRAS F17207-0014 | Pa12 | |||||||||
| IRAS F19297-0406 | So97ddCO (1-0) fluxes corrected for Jy/K, IRAM-30m telescope. | |||||||||
| IRAS F20551-4250 | Mi90eeAdopting Jy/K for SEST. | |||||||||
| IRAS F22491-1808 | Ch09 | |||||||||
| NGC 7469 | Pa12 | |||||||||
| IRAS F23365+3604 | So97ddCO (1-0) fluxes corrected for Jy/K, IRAM-30m telescope. |
Note. — (1) Galaxy name; (2) Distance to the galaxy; adopting a flat Universe with km s-1 Mpc-1 and . For some nearby galaxies alternative distances are used; (3) IR luminosity ( m), estimated using the fluxes in the four IRAS bands (Sanders et al., 2003; Surace et al., 2004); (4) CO (1-0) luminosity from previous studies (col 12), L; (5) Conversion factor, , increases with decreasing ; (6) H2 mass; (7) Far-IR luminosity ( m) to H2 mass ratio; (8) Apparent optical depth of the silicate absorption at 9.7 m (Spoon et al., 2007); (9) Continuum -to- m flux density ratio; (10) Continuum -to- m flux density ratio; (11) Reference for . Sp: Spoon, unpublished data taken with the IRAM 30m telescope; GC: Graciá-Carpio, unpublished CO(2-1) data taken with APEX, and assuming ; We05: Weiß et al. (2005); Ho97: Houghton et al. (1997); Sc83: Scoville et al. (1983); Pa12: Papadopoulos et al. (2012); So97: Solomon et al. (1997); Ca99: Casoli et al. (1999); Mi90: Mirabel et al. (1990); Ch09: Chung et al. (2009); He94: Henkel et al. (1994).
3. Results
shows a bimodal distribution (Fig. 1b-c and Fig. 2) with peaks at and km s-1 and a long tail extending up to 85 km s-1. A Pearson -test comparing the observed distribution for central velocities in Fig. 1b with a flat distribution gives a value , which remains low () when the full doublet is considered (Fig. 1c). While most ULIRGs are strong in OH65, some of them (IRAS 09022-3615, UGC 5101, IRAS F10565+2448) are weak and, conversely, there are three sources with moderate luminosities that are strong in OH65 (NGC 4418, Zw 049.057, and IRAS F11506-3851). Nevertheless, sources with high OH65 absorption have, on average, higher infrared luminosities for fixed (Fig. 1a). Among galaxies with low km s-1, some still have clear detections of OH65 (IRAS F10565+2448, UGC 5101, IRAS 09022-3615, NGC 4945, NGC 253), but no trace of OH65 absorption is found in others (M 82, NGC 1068, NGC 7469). OH71 is detected in the 10 sources with km s-1 (Fig. 3, Table 2) and is undetected in the remaining five sources where OH65 is weak or undetected.
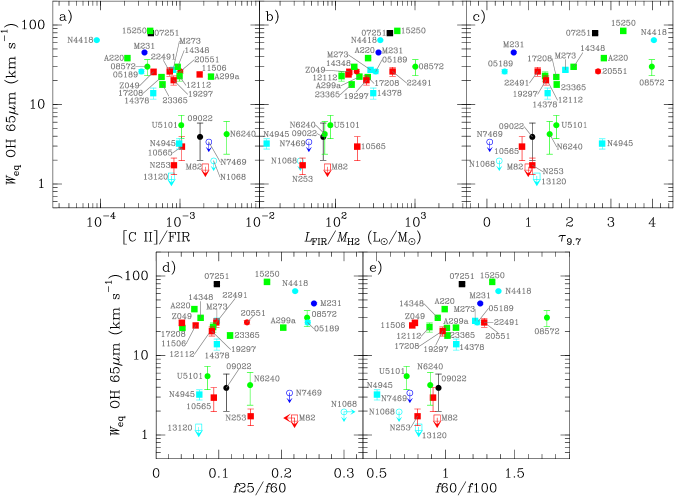
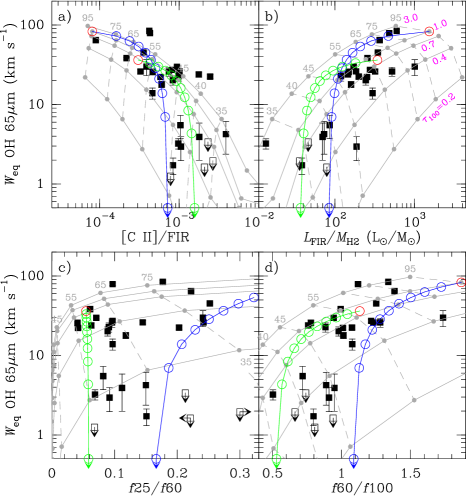
Figure 4a shows that and [C ii]/FIR are anticorrelated, with data points mainly concentrated in the upper-left and lower-right quadrants. The [C ii]/FIR value that separates the two regimes, , is similar to that found by Luhman et al. (2003) for the onset of the [C ii] deficit. Within the limitations of our sample, the data in Fig. 4a show that galaxies with a strong [C ii] deficit have relatively deep OH65 absorption. Around the critical value of [C ii]/FIR, however, there are galaxies with high and low OH65 absorption. The objects with high and also high [C ii]/FIR are Arp 299 and IRAS 11506-3851, the former having a complex structure with multiple nuclei222The FoV was centered in the Arp 299 nucleus (IC 694, Aalto et al., 1997) where the peak OH65 absorption is found, but includes extended [C ii] and CO emitting regions. and the latter showing the coldest color among sources with km s-1. On the other hand, IRAS 13120-5453, NGC 253, IRAS 10565+2448, NGC 4945, and UGC 5101 are examples of galaxies at or close to the onset of the [C ii] deficit that lack high OH65 absorption.
Since and [C ii]/FIR are anticorrelated (G-C11), a positive correlation between the former and is anticipated, and this is seen in Fig. 4b. A discontinuity in OH65 absorption is found at L⊙/M⊙, similar to the one that separates mergers from normal galaxies in the [C ii]/FIR- plane (G-C11).333We note that M 82, with a global L⊙/M⊙, has a CO(1-0) luminosity of half the total value within the PACS FoV (Weiß et al., 2005, see also Table 1), and hence L⊙/M⊙ in this region. Nevertheless, inhomogeneities are also expected in unresolved sources (§4.2 below), and thus we use the global values of in Fig. 4b. It is worth noting that is the most uncertain value in Fig. 4; however, Fig. 5 shows that the correlation remains when using the CO (1-0) luminosity directly, and that [C ii]/FIR shows a marked anticorrelation with .
Figure 4c relates and the apparent optical depth of the 9.7 m silicate feature (Spoon et al., 2007). With the exception of the nearly edge-on galaxy NGC 4945, sources with weak km s-1 have moderate , suggesting that a significant fraction of the silicate absorption in the most obscured () objects is produced by the material responsible for the OH65 absorption. This is consistent with the finding by Goulding et al. (2012) that the dominant contribution to the silicate feature in Compton-thick AGNs is dust located in the host galaxy, which we identify in part with the OH65 structure444We consider the OH65 region to be part of the host even though it is circumnuclear (see footnote 7), because it is much larger than the pc-scale tori surrounding Compton-thick AGNs. In Arp 220 and NGC 4418, where the [O i] 63 m line is observed primarily in absorption, a significant fraction of the Si absorption is likely produced in extended regions (G-A12).. The trends seen in Figs. 4a and c are also consistent with the observed anti-correlation between [C ii]/FIR and the strength of the 9.7 m silicate feature (Díaz-Santos et al., 2013). With increasing silicate obscuration, the low-lying OH 119 m doublet shows increasing absorption relative to emission, suggesting obscuration of the OH re-emission behind a far-IR optically thick (circum)nuclear region (Spoon et al., 2013, V13); the data suggest that this is also accompanied by high OH excitation as measured by the high-lying OH65 doublet. High OH65 absorption, however, does not guarantee deep silicate absorption, as seen for a number of sources including the Seyferts Mrk 231 and IRAS F05189-2524.
Figure 4d-e shows no apparent correlation between and , but shows a positive correlation with the far-IR color. In light of the anti-correlation between and [C ii]/FIR (Fig. 4a), this is consistent with the decline observed in [C ii]/FIR with warmer far-IR colors (Malhotra et al., 2001; Luhman et al., 2003; Díaz-Santos et al., 2013). While is associated with the structure traced by the OH65 absorption, there is a vertical overlap of sources showing strong and weak OH65 absorption within the bin. Finally, no relationship is found between and either the optical spectral type or the fractional contribution of the AGN to the bolometric luminosity as diagnosed from (method 6 in Veilleux et al., 2009, hereafter V09).
| Galaxy | [C ii]/FIR | OBSID | OBSID | OBSID | |||
|---|---|---|---|---|---|---|---|
| name | (km s-1) | (km s-1) | (km s-1) | () | OH65 | OH71 | [C ii]158 m |
| (1) | (2) | (3) | (4) | (5) | (6) | (7) | (8) |
| IRAS 07251-0248 | |||||||
| IRAS 09022-3615 | |||||||
| M 82 | |||||||
| IRAS 13120-5453 | |||||||
| NGC 253 | |||||||
| NGC 1068 | |||||||
| IRAS F05189-2524 | |||||||
| IRAS F08572+3915 | |||||||
| UGC 5101 | |||||||
| IRAS F10565+2448 | |||||||
| Arp 299a | |||||||
| IRAS F11506-3851 | |||||||
| IRAS F12112+0305 | |||||||
| NGC 4418 | |||||||
| Mrk 231 | |||||||
| NGC 4945 | |||||||
| Mrk 273 | |||||||
| IRAS F14348-1447 | |||||||
| IRAS F14378-3651 | |||||||
| Zw 049.057 | |||||||
| IRAS F15250+3609 | |||||||
| Arp 220 | |||||||
| NGC 6240 | |||||||
| IRAS F17207-0014 | |||||||
| IRAS F19297-0406 | |||||||
| IRAS F20551-4250 | |||||||
| IRAS F22491-1808 | |||||||
| NGC 7469 | |||||||
| IRAS F23365+3604 |
Note. — (1) Galaxy name; (2) Equivalent width of OH65 between and km s-1 around the blue component of the doublet, covering the central velocity component; (3) Equivalent width of OH65 between and km s-1, around the blue component of the doublet, covering the whole doublet; (4) Equivalent width of OH71 between and km s-1, covering the whole doublet. Numbers in parenthesis indicate uncertainties and upper limits are . These values are calculated as , where is the RMS noise of the continuum-normalized spectrum and and are the velocity coverage and number of channels over which is measured; (5) [C ii] to FIR ( m, following Helou et al., 1988) flux ratio; (6) Identification number for the OH65 observations; (7) Identification number for the OH71 observations; (8) Identification number for the [C ii] 158 m observations.
4. Radiative transfer models
To characterize the overall physical conditions derived from the present observations, and to interpret the trends shown in Fig. 4, phenomenological radiative transfer models have been generated (G-A14 and references therein). The model sources are spherical and assume uniform physical conditions, parameterized by the dust temperature (), the continuum optical depth at 100 m (), the gas temperature and density ( and ), the OH and C+ column densities ( and ), and the velocity dispersion ().
4.1. Single-component models
Initially, we naively assume that the OH65 absorption and [C ii] emission arise from the same region and that the covering factor of the continuum by the excited OH is unity; these assumptions represent only a first approach to the interpretation of the observations but still enable us to extract some general conclusions. To decrease the number of free parameters, we approximate some of them according to previous chemical or radiative transfer models: The gas column density () is directly related to by adopting a standard gas-to-dust ratio by mass of 100 and a dust mass opacity coefficient at 100 m of cm2 g-1: (González-Alfonso et al., 2014b). is fixed by assuming an OH abundance relative to H of (G-A12, G-A14). We assume that the [C ii] emission is dominated by PDRs (Farrah et al., 2013) and is estimated on the basis of previous models (e.g. Abel et al., 2009; Kaufman et al., 1999, G-C11). For a single PDR, cm-2 is typically inferred for high incident far-UV radiation intensity , and K characterizes the warm dust in PDRs (Hollenbach et al., 1991). We set for K to approximately account for these results and calculate based on . We adopt cm-3 and K, i.e. high density conditions appropriate for the circumnuclear regions of (U)LIRGs, ensuring that the [C ii] transition is thermalized and emits at nearly the maximum emission per C+ ion (Tielens & Hollenbach, 1985). The OH65 transition is pumped through absorption of far-IR photons and it is thus not sensitive to and (G-A08). km s-1 in all models, describing the velocity dispersion along a characteristic line of sight. This has no effect in case of optically thin lines. As we show below, however, high columns and thus many overlapping (shadowing) regions characterize the environments where the OH65 absorption is produced, most likely forming a medium bound to the total potential of the galaxy center (Downes et al., 1993; Solomon et al., 1997). High is thus used to simulate the velocity dispersion due to random cloud-cloud motions, non-rigid rotation, and high-scale turbulence.
The above prescription leaves only two free parameters, and , the properties of the far-IR emission from which the observables , [C ii]/FIR, , , and are calculated. Figure 6 overlays the single-component model results (gray symbols and lines) and the data. Dashed gray lines connect model results for fixed , and solid gray lines connect model results for given . While the [C ii] deficit is only a function of (dashed lines are nearly vertical in Fig. 6a), is sensitive to both and . Since our adopted OH and C+ abundances are probably upper limits, Fig. 6a indicates that moderately high K and high column densities ( or ) are the lower limits that characterize objects with km s-1. This is consistent with model results in Fig. 6b, where the values for these sources are reproduced with similar physical conditions.
For low , increases supralinearly with (Fig. 6) as a result of both the increasing strength of the radiation field that pumps the lower level of the transition, and the increasing OH column. However, the OH65 absorption saturates when the far-IR continuum approaches the optically thick regime (), as the far-IR field also saturates and only the externalmost shells of the source contribute to the absorption. The location of the data points in Fig. 6a-b suggests that this optically thick regime for both the continuum and the OH65 transition applies to the majority of sources with km s-1. In contrast, sources like the prototypical starbursts M 82 and NGC 253, the HII galaxy UGC 5101, and the AGNs NGC 1068 and NGC 6240 have not developed these optically thick, prominent far-IR emitting structures555The Compton-thick AGNs NGC 1068 and NGC 6240 (e.g. Burlon et al., 2011) are weak in OH65, probably because the X-ray absorber in these sources is too compact and hot to contribute significantly to the far-IR emission., though some of them may contain an embryo666In the deeply buried, edge-on starburst+AGN NGC 4945 (e.g. Spoon et al., 2000), there is most likely an optically thick far-IR emitting region, but either it is too cold to generate strong OH65 or the continuum emission from that component is highly diluted..
The deficit in [C ii] is produced because the cooling line cannot track the increase of (e.g. Kaufman et al., 1999). The region where carbon is ionized, and thus the total number of emitting C+ ions, is restricted to regardless of , but the increase of increases the FIR continuum -thus lowering [C ii]/FIR. Nevertheless, the presence of a [C ii] deficit is not critically sensitive to the physical details of the PDRs and can be mostly understood in terms of the global : a strong upper limit on the [C ii] emission is given by (G-A08)
| (1) |
which assumes optically thin [C ii] emission with K and up to of all carbon ionized (for solar metallicities), which is high for molecular regions. In the optically thick regime, line saturation and extinction effects maintain a low [C ii]/FIR even in case of high . Equation (1) directly links the [C ii]/FIR ratio with , and shows that strong [C ii] deficits are unavoidable in galaxies with high , i.e. those that are also strong in OH65 (Figs. 6a-b).
The single component models, however, cannot account for the observed with the and inferred from the other panels of Fig. 6. Indeed, the main consequence of assuming coexistent OH65 absorption and [C ii] emission, i.e. modeling only one OH transition with a fixed covering factor of unity, is the underestimation of and (e.g. see multitransition, composite models for NGC 4418, Arp 220, and Mrk 231 in G-A12 and G-A14). Extended and optically thin regions of (U)LIRGs are emitters of both [C ii] and 65 m continuum (Díaz-Santos et al., 2014), and will dilute both the circumnuclear OH65 absorption and the [C ii] deficit.
4.2. The OH71/OH65 ratio and Composite models
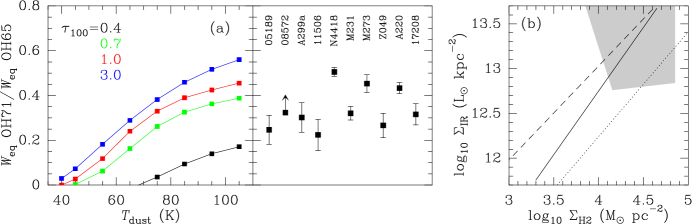
The ratio of the OH71 to the OH65 doublet absorption enables a better estimate of and , independent of the covering factor of the continuum by the excited OH. The modeled ratio of the total doublet equivalent widths, , is plotted as a function of (for ) in Fig. 7a, and compared with the measured ratios. The observed minimum ratio indicates K, significantly higher than inferred in §4.1. This lower limit is still very conservative for hot subcomponents in some sources, where higher-lying transitions of OH (at 53.0 and 56 m) and H2O indicate K (G-A12; G-A14; Falstad et al., in preparation). In addition, unless the dust is very warm, the measured ratios in Fig. 7a favor , equivalent to cm-2.
To account for the trends in Fig. 4 together with the high inferred from in many of the sources, we relax the assumptions in §4.1 and use composite models. It is assumed here that the bulk of the sources can be described by an optically thick very warm component () that accounts for the OH65 absorption, and a colder, optically thin (presumably more extended) component () that accounts for the bulk of the [C ii] emission but gives negligible OH65 absorption. The physical conditions are: : two models with and K are considered (hereafter and , respectively); in both, a nominal is used. : this is itself a model composed of two optically thin dust components with and K, consistent with the -range derived by Farrah et al. (2013) and with results independent of for values . The mix of these two components is governed by , i.e. the fraction of the optically thin IR luminosity arising from the warm 65 K component, which is fixed to and for and , respectively. The values of and for are chosen to bracket the observed and colors for sources that have weak -but measurable- OH65 absorption. We adopt here a typical cm-3 to simulate the [C ii] emission (e.g. Malhotra et al., 2001; Parkin et al., 2013). The mix of and is described by the only free parameter , the fraction of the total IR luminosity arising from the component.
Results for these models are shown in Fig. 6; blue/green curves and circles correspond to models , respectively. The circles on these curves represent a sequence of models where is varied from 0 to 1 in intervals of , with indicated with a red circle. According to this approach, the source position within the different observational planes is interpreted in terms of the overall energetic relevance of the optically thick, very warm structure (). For sources with km s-1, %, while sources with km s-1 are characterized by % for , respectively. In the latter objects, a fraction of the optically thin emission is expected to be reemission by dust heated by the optically thick component (Soifer et al., 1999; González-Alfonso et al., 2004), and thus most likely dominates the output of these galaxies. The modeled curves are consistent with the steep increase of with decreasing [C ii]/FIR below , and with increasing above L⊙/Msun. The [C ii] emission is still underpredicted in some sources, which may suggest significant contributions by (diffuse) ionized gas.
5. Conclusions
Absorption in high-lying transitions of molecules with high dipolar moment and level spacing (i.e. mostly light hydrides), represented by OH65 and OH71, has been shown here to be strong in most local ULIRGs (%) and in several LIRGs. Despite the high columns inferred in galaxies with high , their low [C ii]/FIR and low suggest that both are associated with a “deficit” in relative to the far-IR continuum emission, accompanied by additional effects such as significant optical depth in the [C ii] line and high excitation of CO. High columns and but low are indicative of high radiation densities and small volumes, with the high columns of gas and dust confined to small regions777The effective size of the OH65 source can be determined by comparing the absolute (an upper limit of which is the observed luminosity) with its calculated value, , where stands for the projected surface and is the continuum optical depth at frequency along the corresponding line of sight. For reference, the effective radius is pc for L⊙ (), K, and , which is a lower limit to the physical size in some galaxies owing to clumpiness. The diagnostics in Fig. 4 and model results in Fig. 6 are nevertheless independent of sizes and adopted distances. around the bright, buried illuminating source(s) (nearly) dominating the galaxy output. The relationship between the model parameterization used here and that in terms of the dominant exciting source (AGN or starburst), volume and column densities, and ionization parameter (Abel et al., 2009; Fischer et al., 2014, G-C11), as well as the origin of the deficit in fine-structure lines other than [C ii], will be explored in future work.
The inferred column densities associated with km s-1, cm-2, are higher than those derived from the silicate strength at m. Models by Sirocky et al. (2008) indicate that the observed can be explained with ( cm-2). Since the OH65 regions/structure will block all the inner mid-IR emission passing through it, the observed mid-IR emission and associated silicate absorption are biased toward relatively unabsorbed mid-IR emitting regions. Likewise, several sources in the sample show mid-IR AGN signatures as [Ne v] emission (IRAS 05189-2524 and Mrk 273; Armus et al., 2007, V09) or an optical Broad Line Region (e.g. Mrk 231), and our direct view of this emission indicates tiny absorbing columns in comparison with those inferred from OH65. If the OH65 absorption is generated in a circumnuclear disk/torus/cocoon, either the combination of scale height/inclination, and/or clumpiness are required to account for the apparent decrease of extinction with decreasing wavelength. In sources with high contrast in mid-to-far infrared extinction, either extreme clumpiness or important inclination effects are necessarily involved. In other sources, extinction of the mid-IR emission by the OH65 structure is consistent with their low ratio. Though these structures are variably clumpy, the OH65 bimodality (Fig. 1b-c) suggests that they are coherent and quickly formed, and provide an effective way to obscure the signposts of AGNs at shorter wavelengths in some sources.
In the direction of the warm, optically thick regions/structure where the OH65 absorption is produced, the surface density of both and H2 mass are significantly higher than the average values previously estimated for the areas within the half-light radius (from CO or optical/UV). The grey parallelogram in Fig. 7b indicates the location of the component for the ten sources where both OH65 and OH71 are detected: M⊙ pc-2 () and L⊙ kpc-2 ( K). The latter high fluxes are consistent with previous estimates using sizes derived from radio emission and strengthen the role of radiation pressure support (Scoville, 2004; Thompson et al., 2005, see their Fig. 3). For starburst-dominated sources and using a Chabrier (2003) IMF, the corresponding SFRs are M⊙ yr-1 kpc-2. For hot subcomponents in some sources like the component of NGC 4418, L⊙ kpc-2 and ( cm-2) on spatial scales of pc (G-A12, Sakamoto et al., 2013; Costagliola et al., 2013; Varenius et al., 2014).
The solid, dashed, and dotted black lines in Fig. 7b are extrapolations of the fits found in previous studies for subsamples of (U)LIRGs/mergers/SMGs. A pure SF scenario involves the shadowing of (for ) star-forming regions, each with mag and , on spatial scales of pc; on spatial scales of a few parsecs, there is apparently no analog star-forming region close to the Galactic center.888In Sgr B2(M), the peak of one of the most active and optically thick molecular cloud complexes in the Milky Way, km s-1 as measured with ISO/FP (Polehampton et al., 2007), consistent with its moderate effective K, L⊙ kpc-2, and L⊙/M⊙ for a gas-to-dust ratio by mass of 100 (Etxaluze et al., 2013). OH65 is not detected towards Sgr A∗ and its circumnuclear disk (Goicoechea et al., 2013), and is detected in emission towards the Orion bar PDR indicating collisional excitation in warm and dense gas (Goicoechea et al., 2011). The implied gas consumption timescales are Myr for K, comparable to those estimated for extreme sources exhibiting powerful OH outflows driven by buried AGNs (Sturm et al., 2011). On the other hand, 21 sources in our sample were analyzed in the OH 119 m transition by V13, and 12 (9 with km s-1) were found to have km s-1 (the velocity below which 84% of the absorption takes place), most likely indicative of significant AGN feedback. The OH65-(U)LIRG phase may thus represent the starburst-AGN co-evolution phase in its shortlived most buried/active stage.
References
- Aalto et al. (1997) Aalto, S., Radford, S. J. E., Scoville, N. Z., & Sargent, A. I. 1997, ApJ, 475, L107
- Abel et al. (2009) Abel, N. P., Dudley, C., Fischer, J., Satyapal, S., & van Hoof, P. A. M. 2009, ApJ, 701, 1147
- Armus et al. (2007) Armus, L., Charmandaris, V., Bernard-Salas, J., et al. 2007, ApJ, 656, 148
- Brauher et al. (2008) Brauher, J. R., Dale, D. A., & Helou, G. 2008, ApJS, 178, 280
- Burlon et al. (2011) Burlon, D., Ajello, M., Greiner, J., Comastri, A., Merloni, A., & Gehrels, N. ApJ, 728, 58
- Casoli et al. (1999) Casoli, F., Willaime, M.-C., Viallefond, F., & Gerin, M. 1999, A&A, 346, 663
- Chabrier (2003) Chabrier, G. 2003, ApJ, 586, L133
- Chung et al. (2009) Chung, A., Narayanan, G., Yun, M. S., Heyer, M., & Erickson, N. R. 2009, AJ, 138, 858
- Costagliola et al. (2013) Costagliola, F., Aalto, S., Sakamoto, K., Martín, S., Beswick, R., Muller, S., & Klöckner, H.-R. 2013, A&A, 556, A66
- Daddi et al. (2010) Daddi, E., Elbaz, D., Walter, F., et al. 2010, ApJ, 714, L118
- Díaz-Santos et al. (2013) Díaz-Santos, T., Armus, L., Charmandaris, V., et al. 2013, ApJ, 774, 68
- Díaz-Santos et al. (2014) Díaz-Santos, T., Armus, L., Charmandaris, V., et al. 2014, ApJ, in press (arXiv:1405.3983)
- Downes et al. (1993) Downes, D., Solomon, P. M., & Radford, S. J. E. 1993, ApJ, 414, L13
- Etxaluze et al. (2013) Etxaluze, M., Goicoechea, J. R., Cernicharo, J., Polehampton, E. T., Noriega-Crespo, A., Molinari, S., Swinyard, B. M., Wu, R., & Bally, J. 2013, A&A, 556, A137
- Farrah et al. (2013) Farrah, D.; Lebouteiller, V.; Spoon, H. W. W., et al. 2013, ApJ, 776, 38
- Fischer et al. (1999) Fischer, J., Luhman, M. L., Satyapal, S., et al. 1999, Ap&SS, 266, 91
- Fischer et al. (2010) Fischer, J., Sturm, E., González-Alfonso, et al. 2010, A&A, 518, L41
- Fischer et al. (2014) Fischer, J., Abel, N. P., González-Alfonso, E., Dudley, C. C., Satyapal, S., & van Hoof, P. A. M. 2014, ApJ, in press (arXiv:1409.2521)
- García-Marín et al. (2006) García-Marín, M., Colina, L., Arribas, S., Alonso-Herrero, A., & Mediavilla, E. 2006, ApJ, 650, 850
- García-Burillo et al. (2012) García-Burillo, S., Usero, A., Alonso-Herrero, A., Graciá-Carpio, J., Pereira-Santaella, M., Colina, L., Planesas, P., & Arribas, S. 2012, A&A, 539, A8
- Genzel et al. (2010) Genzel, R., Tacconi, L. J., Graciá-Carpio, J. et al. 2010, MNRAS, 407, 2091
- Goicoechea & Cernicharo (2002) Goicoechea, J. R. & Cernicharo, J. 2002, ApJ, 576, L77
- Goicoechea et al. (2011) Goicoechea, J. R., Joblin, C., Contursi, A., Berné, O., Cernicharo, J., Gerin, M., Le Bourlot, J., Bergin, E. A., Bell, T. A., & Röllig, M. 2011, A&A, 530, L16
- Goicoechea et al. (2013) Goicoechea, J. R., Etxaluze, M., Cernicharo, J., et al. 2013, ApJ, 769, L13
- González-Alfonso et al. (2004) González-Alfonso, E., Smith, H. A., Fischer, J., & Cernicharo, J. 2004, ApJ, 613, 247
- González-Alfonso et al. (2008) González-Alfonso, E., Smith, H. A., Ashby, M. L. N., Fischer, J., Spinoglio, L., & Grundy, T. W. 2008, ApJ, 675, 303 (G-A08)
- González-Alfonso et al. (2012) González-Alfonso, E., Fischer, J., Graciá-Carpio, J., et al. 2012, A&A, 541, A4 (G-A12)
- González-Alfonso et al. (2013) González-Alfonso, E., Fischer, J., Bruderer, S., et al. 2013, A&A, 550, A25
- González-Alfonso et al. (2014a) González-Alfonso, E., Fischer, J., Graciá-Carpio, J., et al. 2014, A&A, 561, A27 (G-A14)
- González-Alfonso et al. (2014b) González-Alfonso, E., Fischer, J., Aalto, S., & Falstad, N. 2014, A&A, 567, A91
- Goulding et al. (2012) Goulding, A. D., Alexander, D. M., Bauer, F. E., Forman, W. R., Hickox, R. C., Jones, C., Mullaney, J. R., & Trichas, M. 2012, ApJ, 755, 5
- Graciá-Carpio et al. (2011) Graciá-Carpio, J., Sturm, E., Hailey-Dunsheath, S., et al. 2011, ApJ, 728, L7 (G-C11)
- Helou et al. (1988) Helou, G., Khan, I. R., Malek, L., & Boehmer, L. 1988, ApJS, 68, 151
- Henkel et al. (1994) Henkel, C., Whiteoak, J. B., & Mauersberger, R. 1994, A&A, 284, 17
- Hollenbach et al. (1991) Hollenbach, D. J., Takahashi, T., & Tielens, A. G. G. M. 1991, ApJ, 377, 192
- Houghton et al. (1997) Houghton, S., Whiteoak, J. B., Koribalski, B., Booth, R., Wiklind, T., & Wielebinski, R. 1997, A&A, 335, 923
- Kaufman et al. (1999) Kaufman, M. J., Wolfire, M. G., Hollenbach, D. J., & Luhman, M. L. 1999, ApJ, 527, 795
- Kim et al. (1998) Kim, D.-C., Veilleux, S., & Sanders, D. B. 1998, ApJ, 508, 627
- Luhman et al. (1998) Luhman, M. L., Satyapal, S., Fischer, J., Wolfire, M. G., Cox, P., Lord, S. D., Smith, H. A., Stacey, G. J., & Unger, S. J. 1998, ApJ, 504, L11
- Luhman et al. (2003) Luhman, M. L., Satyapal, S., Fischer, J., Wolfire, M. G., Sturm, E., Dudley, C. C., Lutz, D., & Genzel, R. 2003, ApJ, 594, 758
- Malhotra et al. (2001) Malhotra, S., Kaufman, M. J., Hollenbach, D., et al. 2001, ApJ, 561, 766
- Meijerink et al. (2011) Meijerink, R., Spaans, M., Loenen, A. F., & van der Werf, P. P. 2011, A&A, 525, A119
- Mirabel et al. (1990) Mirabel, I. F., Booth, R. S., Johansson, L. E. B., Garay, G., & Sanders, D. B. 1990, A&A, 236, 327
- Narayanan et al. (2005) Narayanan, D., Groppi, C. E.; Kulesa, C. A., & Walker, C. K. 2005, ApJ, 630, 269
- Papadopoulos et al. (2012) Papadopoulos, P. P., van der Werf, P. P., Xilouris, E. M., Isaak, K. G., Gao, Y., & Mühle, S. 2012, MNRAS, 426, 2601
- Parkin et al. (2013) Parkin, T. J., Wilson, C. D., Schirm, M. R. P., et al. 2013, ApJ, 776, 65
- Pilbratt et al. (2010) Pilbratt, G. L.; Riedinger, J. R.; Passvogel, T., et al. 2010, A&A, 518, L1
- Poglitsch et al. (2010) Poglitsch, A., Waelkens, C., Geis, N., et al. 2010, A&A, 518, L2
- Polehampton et al. (2007) Polehampton, E. T., Baluteau, J.-P., Swinyard, B. M., Goicoechea, J. R., Brown, J. M., White, G. J., Cernicharo, J., & Grundy, T. W. 2007, MNRAS, 377, 1122
- Rupke et al. (2005) Rupke, D. S., Veilleux, S, & Sanders, D. B. 2005, ApJS, 160, 87
- Sakamoto et al. (2013) Sakamoto, K., Aalto, S., Costagliola, F., Martín, S., Ohyama, Y., Wiedner, M. C.; Wilner, D. J. 2013, ApJ, 764, 42
- Sanders et al. (2003) Sanders, D. B., Mazzarella, J. M., Kim, D.-C., Surace, J. A., & Soifer, B. T. 2003, AJ, 126, 1607
- Scoville et al. (1983) Scoville, N. Z., Young, J. S., & Lucy, L. B. 1983, ApJ, 270, 443
- Scoville (2004) Scoville, N. Z. 2004, in The Neutral ISM in Starburst Galaxies, ed. S. Aalto, S. Hüttemeister, & A. Pedlar, ASP Conf. Ser., 320, 253
- Sirocky et al. (2008) Sirocky, M. M., Levenson, N. A., Elitzur, M., Spoon, H. W. W., & Armus, L. 2008, ApJ, 678, 729
- Soifer et al. (1999) Soifer, B. T., Neugebauer, G., Matthews, K., Becklin, E. E., Ressler, M., Werner, M. W., Weinberger, A. J., & Egami, E. 1999, ApJ, 513, 207
- Solomon et al. (1997) Solomon, P. M., Downes, D., Radford, S. J. E., & Barrett, J. W. 1997, ApJ, 478, 144
- Spoon et al. (2000) Spoon, H. W. W., Koornneef, J., Moorwood, A. F. M., Lutz, D., & Tielens, A. G. G. M. 2000, A&A, 357, 898
- Spoon et al. (2007) Spoon, H. W. W., Marshall, J. A., Houck, J. R., Elitzur, M., Hao, L., Armus, L., Brandl, B. R., & Charmandaris, V. 2007, ApJ, 654, L49
- Spoon et al. (2013) Spoon, H. W. W., Farrah, D., Lebouteiller, V., et al. 2013, ApJ, 775, 127
- Sturm et al. (2011) Sturm, E., González-Alfonso, E., Veilleux, S., et al. 2011, ApJ, 733, L16
- Surace et al. (2004) Surace, J. A., Sanders, D. B., & Mazzarella, J. M. 2004, AJ, 127, 3235
- Thompson et al. (2005) Thompson, T. A., Quataert, E., & Murray, N. 2005, ApJ, 630, 167
- Tielens & Hollenbach (1985) Tielens, A. G. G. M. & Hollenbach, D. 1985, ApJ, 291, 722
- Varenius et al. (2014) Varenius, E., Conway, J. E., Martí-Vidal, I., Aalto, S., Beswick, R., Costagliola, F., & Klöckner, H.-R. 2014, A&A, 566, A15
- Veilleux et al. (1995) Veilleux, S., Kim, D.-C., Sanders, D. B., Mazzarella, J. M., & Soifer, B. T. 1995, ApJS, 98, 171
- Veilleux et al. (1999) Veilleux, S., Kim, D.-C., & Sanders, D. B. 1999, ApJ, 522, 113
- Veilleux et al. (2009) Veilleux, S., Rupke, D. S. N., Kim, D.-C., et al. 2009, ApJS, 182, 628 (V09)
- Veilleux et al. (2013) Veilleux, S., Meléndez, M.; Sturm, E., et al. 2013, ApJ, 776, 27 (V13)
- Véron-Cetty & Véron (2006) Véron-Cetty, M.-P. & Véron, P. 2006, A&A, 455, 773
- Weiß et al. (2005) Weiß, A., Walter, F., & Scoville, N. Z. 2005, A&A, 438, 533