Chemical pressure tuning of URu2Si2 via isoelectronic substitution of Ru with Fe
Abstract
We have used specific heat and neutron diffraction measurements on single crystals of URu2-xFexSi2 for Fe concentrations 0.7 to establish that chemical substitution of Ru with Fe acts as “chemical pressure” as previously proposed by Kanchanavatee et al. [Phys. Rev. B 84, 245122 (2011)] based on bulk measurements on polycrystalline samples. Notably, neutron diffraction reveals a sharp increase of the uranium magnetic moment at , reminiscent of the behavior at the “hidden order” (HO) to large moment antiferromagnetic (LMAFM) phase transition observed at a pressure 0.5-0.7 GPa in URu2Si2. Using the unit cell volume determined from our measurements and an isothermal compressibility GPa-1 for URu2Si2, we determine the chemical pressure in URu2-xFexSi2 as a function of . The resulting temperature -chemical pressure phase diagram for URu2-xFexSi2 is in agreement with the established temperature -external pressure phase diagram of URu2Si2.
pacs:
71.10.Hf, 71.27.+a, 74.70.Tx, 75.25.-jI Introduction
The heavy fermion compound URu2Si2 exhibits a large entropy change at a temperature = 17.5 K Palstra:85 ; Maple:86 ; Schlablitz:86 that has presented a challenge to researchers for almost 30 years. Despite the pronounced signature at in the heat capacity that signals a second-order symmetry breaking phase transition, the order parameter of the ground state below remains unknown, and the phase is commonly referred to as the “hidden order” (HO) phase.Luethi:93
On the other hand, a large body of experimental work has established that the HO phase develops out of a paramagnetic phase that is characterized by strong electronic correlations stemming from the hybridization of localized uranium electrons with the conduction electrons.Mydosh:11 Scanning tunneling microscopy (STM) measurements on URu2Si2 demonstrate that hybridization already arises at temperatures much larger than , where the single-ion Kondo temperature was determined as = 120 K.Schmidt:10 ; Aynajian:10 At 70 K, coherence sets in and a Kondo lattice develops as is observed by point-contact spectroscopy (PCS) measurementsRodrigo:97 consistent with bulk properties.Palstra:86 ; Schoenes:87 NMR measurements Shirer:13 also suggest the presence of a pseudogap below 30 K.
The onset of the HO is accompanied by a further reorganization of this strongly correlated electron state. The BCS-like specific heat anomaly at ,Palstra:85 ; Maple:86 Hall effectSchoenes:87 ; Oh:07 ; Kasahara:07 and optical conductivity Bonn:88 measurements show that a charge gap opens over about 40% of the Fermi surface (FS) within the HO state. The partial gapping of the FS is further supported by quantum oscillation measurements Ohkuni:99 ; Altarawneh:11 that reveal that the FS of URu2Si2 consists of mostly small closed pockets. This reorganization of the electronic structure below was also observed via angle-resolved photoemission spectroscopy (ARPES),Santander-Syro:09 STM,Schmidt:10 ; Aynajian:10 and PCS Rodrigo:97 that reveal a secondary hybridization of a heavy -like quasiparticle band with a light hole-like band at , resulting in the formation of a hybridization gap = 5 meV. More recent ARPES work suggests that possibly larger regions of the FS are gapped at .Bareille:14
Extensive inelastic neutron scattering studies demonstrated that charge and spin degrees of freedom are strongly coupled in URu2Si2. Below , spin gaps develop simultaneously with the charge gap, where most of the work has focused on the spin gaps at the commensurate and incommensurate wave vectors.Broholm:91 ; Wiebe:07 ; Villaume:08 ; Bourdarot:10 ; Bourdarot:14 The mode has been attributed to itinerant-like spin excitations that are related to the heavy electronic quasiparticles that form below . Wiebe:07 A more recent neutron scattering study that has investigated the magnetic scattering over large parts of the Brillouin zone shows that spin gaps open over wider regions of reciprocal space, and the observed magnetic excitations originate from spin-flip transitions between hybridized bands that track the FSButch:14 as previously suggested based on a smaller set of data.Janik:09 The gapping of these spin fluctuations accounts for the loss of entropy at .Wiebe:07
The mode transforms to weak quasielastic spin fluctuations above and appears to be a true signature of the HO state, where the integrated dynamic spin susceptibility behaves like an order parameter.Bourdarot:10 Notably, when URu2Si2 is tuned by means of external pressure, above a pressure 0.5-0.7 GPa, the commensurate spin gap closes and the longitudinal spin fluctuations at freeze out,Villaume:08 leading to the formation of antiferromagnetic order with a magnetic moment of /U parallel to the tetragonal axis.Amitsuka:99 We note that antiferromagnetic order with the same ordering wave vector and a tiny magnetic moment /U Broholm:87 ; Broholm:91 is also observed in the HO state for . Historically, the antiferromagnetic phase beyond has therefore been called the large moment antiferromagnetic phase (LMAFM). However, the moment in the HO phase is too small to account for the large entropy 0.2ln2 associated with the specific heat anomaly below .Maple:86 ; Palstra:85 Detailed subsequent investigations led to the wide consensus that the small magnetic moment within the HO state is due to internal strain.Amitsuka:07 ; Niklowitz:10 Larmor diffraction measurements have additionally established that the phase boundary between the HO and LMAFM is first order.Niklowitz:10 Recent theoretical workRau:12 ; Chandra:13 suggested that the magnetic moment in the HO phase has a small component in the tetragonal plane, and that the antiferromagnetic order in the HO and LMAFM phases would be different, but this was ruled out by recent detailed neutron diffraction work that confirmed that the magnetic moment in the HO phase is purely along the -axis.Das:13 ; Metoki:13 ; Ross:14
It is therefore well-established that the two phases have distinct order parameters. In contrast, quantum oscillation measurements suggest that the Fermi surfaces of the LMAFM and HO are nearly identical.Hassinger:10 This is partially supported by inelastic neutron scattering experiments that probed the incommensurate spin excitations at as a function of pressure, which find that the FS nesting vector remains unchanged upon entering the LMAFM phase.Bourdarot:14 However, the incommensurate spin gap at is found to increase abruptly at from approximately 4.5 to just below 8 meV.Bourdarot:14 Complete measurements spanning the entire Brillouin zone are difficult to perform under pressure and a full comparison with the HO phase is thus not possible. This demonstrates that the relationship between the HO and LMAFM phases that is determined via a complex interplay of localized and itinerant electronic, as well as spin degrees of freedom, remains an open question. In particular, it would be desirable to perform measurements such as STM and ARPES that are able to detect the fine details of the electronic structure in the LMAFM phase to resolve these questions; these experiments have not yet been performed since these measurements cannot be carried out under applied pressure.
Here we demonstrate that the new isoelectronic substitution series URu2-xFexSi2 may represent a new route to investigate the interplay between HO and LMAFM phases. Measurements of electrical resistivity, magnetic susceptibility and specific heat on polycrystalline samples of URu2-xFexSi2 for have recently been reported; from these measurements, a phase diagram as a function of Fe concentration that tracks the phase diagram of URu2Si2was established. Kanchanavantee:11 Notably, it appears that the reduction in the unit cell volume arising from the the substitution of the smaller isoelectronic Fe ions for Ru acts as “chemical pressure”. However, it is difficult to determine the phase boundary between the HO and LMAFM phases from bulk measurements, because they do not directly probe the order parameter of the LMAFM phase. Therefore, it was impossible to determine whether URu2-xFexSi2 samples with 0.2 indeed were in the LMAFM ground state. In addition, the polycrystalline samples also exhibited some issues with disorder, which led to broadened phase transitions as a function of temperature for 0.1, thus leading to some uncertainty in the phase diagram. In the work presented here, we have overcome these issues by performing specific heat and neutron diffraction experiments on high-quality single crystals of URu2-xFexSi2 for . The results are consistent with the viewpoint that substitution of Fe for Ru in URu2-xFexSi2 acts as a chemical pressure and, up to at least 0.3, reproduces the temperature -external pressure phase diagram of URu2Si2.
II Experimental Methods
Measurements were performed on a series of single crystals of URu2-xFexSi2 with Fe concentrations . Samples were grown using the Czochralski technique, where one of the samples () was prepared in a tri-arc furnace with a continuously purified Ar atmosphere at Los Alamos, and all other samples were prepared in a Techno Search TCA 4-5 Tetra-Arc furnace under a zirconium-gettered argon atmosphere at UCSD. The quality of the synthesized single crystals was confirmed by x-ray diffraction measurements in a D8 Discover Bruker diffractometer. Typical sample masses for all samples were a few grams. Specific heat measurements were performed for 1.8 K - 50 K in a Quantum Design Physical Property Measurement System semiadiabatic calorimeter using a heat-pulse technique. Neutron diffraction experiments were performed at the NIST Center for Neutron Research on the BT4 and BT7 triple axis spectrometers with incident energies of or meV and various collimations.Lynn:12 Samples were oriented in the scattering plane. For = 35 meV, pyrolytic graphite (PG) filters were used to reduce higher-order contamination from the monochromated neutron beam. Temperatures in the range K were accessed using a closed cycle 4He refrigerator. The higher incident neutron energies have been used to avoid extinction. The use of the analyzer crystal on both instruments further improved the signal-to-noise ratio, which is particularly important in the case of measuring the small magnetic moments in the HO phase.
III Experimental Results
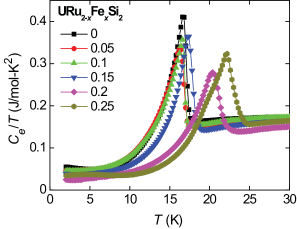
In Fig. 1, we show the electronic contribution to the specific heat divided by temperature that was determined for by subtracting the phonon contribution .Kanchanavatee:15 Specific heat data measured on the isostructural compound UFe2Si2 were used to estimate . This method should yield a good estimate of the phonon contribution for all values of since the end member compounds are isostructural and UFe2Si2 is reported to be a Pauli paramagnet down to 0.2 K.Szytula:88 Using only a Debye function, we were unable to account correctly for the phonon contribution over the entire -range measured. shows a well-defined BCS-like anomaly at the transition from the paramagnetic phase into the HO/LMAFM phase at for all measured that is similar to the feature observed for .Maple:86 We defined as the temperature of the midpoint of this feature in the data. There is no sign of the broad shoulder above that was observed for polycrystalline samples previously and has been attributed to disorder, Kanchanavantee:11 demonstrating that the single crystals studied here do not suffer from similar problems. For increasing Fe concentration, , the transition temperature moves to higher temperatures as observed for URu2Si2 under applied pressure.
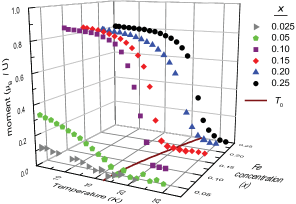
Figure 2 shows the magnetic moment per uranium as a function of temperature for all measured Fe concentrations obtained from our neutron scattering experiments. The magnetic moment for each temperature and Fe concentration was obtained by recording the integrated intensity of the magnetic Bragg reflection (1,0,0) by means of rocking scans. We note that (1,0,0) is a forbidden nuclear Bragg reflection and the observed scattering is purely magnetic apart from higher order scattering from the monochromator that was temperature independent. The intensity of a magnetic reflection for URu2-xFexSi2 is given by
| (1) |
where is the magnetic dipole moment of the neutron in units of nuclear Bohr magnetons, m, and is the unit cell volume. is a unit vector parallel to the scattering vector and is the magnetic structure factor. The indices and describe their components with . The term, , signifies that only components of the magnetic structure factor perpendicular to contribute to the magnetic scattering. The magnetic structure factor for URu2-xFexSi2 is described by
| (8) | |||||
Here , and are the Landé -factor, the magnetic form factor and the Debye-Waller factor of the magnetic uranium ions, respectively. The vector describes the position of the th uranium ion in the unit cell. In the second line, we have used the fact that URu2-xFexSi2 crystallizes in the space group , and the antiferromagnetic order found in the HO/LMAFM state is described by the two uranium ions (0,0,0) and (1/2, 1/2, 1/2) that exhibit antiparallel magnetic moments and . The magnetic moment per uranium is therefore given by and can be calculated by normalizing the recorded magnetic intensity with the known intensity of nuclear reflections such as (2,0,0). We note that we have used weak nuclear reflection such as (6,0,0) and higher incident neutron energies to avoid errors in the normalization due to extinction effects.
IV Discussion
From Fig. 2, it is clearly visible that the onset temperature of the HO/LMAFM phase increases for increasing . Here, we have determined from the temperature dependence of the magnetic moment for each concentration by performing order parameter fits of the form .Butch:10 The values of extracted in this fashion are marked with the brown solid line in Fig. 2 and are also shown in the temperature -Fe concentration phase diagram in Fig. 3(a) together with the values obtained from the specific heat measurements. For the latter, was obtained by tracking the peak of the jump in . Figure 3(a) illustrates that the values of derived from both measurements are consistent. The shape of looks remarkably similar to the shape of the curve observed when URu2Si2 is tuned via external pressure . Notably, we observe a kink in at 0.15 that occurs in at 0.7-1.3 GPa depending on the combination of method and pressure medium employed to determine .Bourdarot:05 ; Hassinger:08 ; Amitsuka:07 ; Amitsuka:08 ; Niklowitz:10 ; Motoyama:08 ; Butch:10
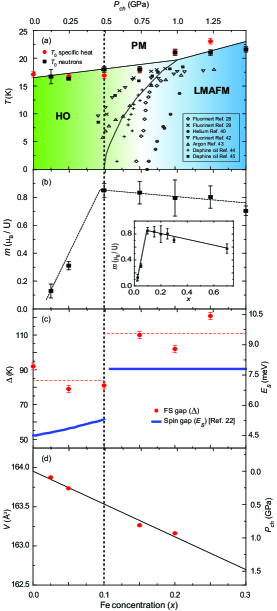
In the - phase diagram of URu2Si2, the HO-LMAFM phase transition for 0 K occurs at 0.5-0.7 GPa, where the phase boundary moves to slightly higher pressures for increasing temperature, until it connects to the phase boundary between the paramagnetic phase and the HO/LMAFM phase at (see Fig. 3(a)).Bourdarot:05 ; Hassinger:08 ; Amitsuka:07 ; Amitsuka:08 ; Niklowitz:10 ; Motoyama:08 ; Butch:10 In Fig. 3(b), we show the value of the U magnetic moment as a function of at = 5 K. The order parameter curves illustrated in Fig. 2 for various values of demonstrate that the magnetic moment is already saturated at = 5 K, so that the value of plotted in Fig. 3(b) effectively corresponds to the magnetic moment for 0 K. The magnetic moment only increases slightly as a function of for 0.1; however, at 0.1, a sharp increase of is observed, indicating that 0.1 marks the transition from the HO to the LMAFM phase in URu2-xFexSi2 for 0 K.
This is also apparent from a more detailed analysis of the specific heat data, which allows us to investigate the magnitude of the charge gap that opens in the FS at as a function of Fe concentration. The specific heat data below can be well described by the expressionMaple:86
| (9) |
The values of extracted by fitting Eq. 9 to the electronic contribution to the specific heat for each are plotted in Fig. 3(c). The FS gap K remains roughly constant up to , where a sudden increase to approximately K is observed, highlighting a change in the electronic structure of URu2-xFexSi2 at the same Fe concentration, where the abrupt change of the magnetic moment indicates the phase transition from the HO into the LMAFM state.
We note that the behavior of the charge gap extracted from the specific heat data is reminiscent of the sudden increase of the spin gap at the incommensurate wave vector when URu2Si2 is tuned from the HO into the LMAFM phase by means of external pressure.Villaume:08 ; Bourdarot:10 We have highlighted this similarity by overlaying the values of the spin gap as a function of pressure extracted from inelastic neutron scattering measurements in Fig. 3(c). Because the spin excitations at represent spin-flip transitions between hybridized bands and track the gapped FS of URu2Si2,Butch:14 ; Janik:09 it is natural that the spin gap observed via neutron scattering tracks the charge gap probed by the specific heat.
The abrupt changes of the magnetic moment and the charge gap at = 0.1, as well as the shape of the phase boundary , support the interpretation that isoelectronic substitution of Ru with smaller Fe ions in URu2Si2 behaves as chemical pressure. In Fig. 3(d), we show the unit cell volume of URu2-xFexSi2 as a function of as extracted from x-ray diffraction measurements. As expected, and similar to the previously investigated polycrystalline samples,Kanchanavantee:11 decreases for increasing . Using the value for the isothermal compressibility ( GPa-1) of URu2Si2 as in our previous work Kanchanavantee:11 and as determined from x-ray diffraction at low temperature,Kuwahara:03 we calculate the chemical pressure that corresponds to each (see right side axis of Fig. 3(d)). However, one should note that values of reported in the literature range from to GPa-1.Amitsuka:99 ; Kuwahara:03
We also indicate on the top horizontal axis of Fig. 3. Using the estimated chemical pressure, we have plotted the phase boundaries between the paramagnetic, HO and LMAFM phases for URu2Si2 as a function of pressure, as reported by several groups using different methods and pressure media.Bourdarot:05 ; Hassinger:08 ; Amitsuka:07 ; Amitsuka:08 ; Niklowitz:10 ; Motoyama:08 ; Butch:10 It is immediately apparent that the phase boundaries determined here for URu2-xFexSi2 and plotted as a function of chemical pressure are in good agreement with the established - phase diagram for URu2Si2.
We note that the magnetic moment within the HO phase of URu2-xFexSi2 increases faster than observed for pressure tuning of URu2Si2. It is likely that this discrepancy is due to the additional disorder that is introduced by chemical substitution. In this case, the disorder introduces additional strain in URu2-xFexSi2 for increasing , which leads to larger “puddles” of the LMAFM phase existing within the HO state. The magnetic moment 0.8 /U in the LMAFM phase of URu2-xFexSi2 is slightly larger than what has been observed in the LMAFM phase accessed via external pressure ( = 0.4-0.5 /U).Amitsuka:07 ; Butch:10 This may also be related to the disorder introduced by chemical substitution and/or an increased magnetic moment due to the introduction of Fe; however, additional more detailed studies will be required to explore these subtle differences between external and chemical pressure tuning.
Next, we discuss the slight difference in Fe concentration at which the HO-LMAFM phase transition occurs when we compare previous bulk measurements on polycrystalline samples of URu2-xFexSi2 ( 0.2) with the value determined for single crystals herein ( 0.1). First, we note that the value for the polycrystalline samples was based on the position of the kink in the phase boundary and an analysis of the entropy, which are both not directly sensitive to the order parameter of the LMAFM phase. In contrast, the value determined here is based on the change of the magnetic moment on the U site as 0 K. As described above, the phase boundary between the HO and LMAFM phases moves to higher pressure/Fe concentration as a function of increasing temperature. Furthermore, we note that the polycrystalline samples show some disorder as apparent from a broadened HO/LMAFM transition, which makes it more difficult to determine the exact shape of the phase boundary. Taken together, these factors account for the slight difference between poly- and single-crystalline samples.
Recently, the HO/LMAFM phase boundary was determined for the system URu2-xOsxSi2 to values of = 1.2, based on electrical resistivity, magnetic susceptibility, and specific heat measurements on polycrystalline specimens.Kanchanavatee14 ; Dalichaouch90 Similar to the URu2-xFexSi2 system, for the URu2-xOsxSi2 system increases with and exhibits a maximum of 50 K at = 1.0 (somewhat larger than the maximum of 42 K for the Fe-substituted system at = 0.8). Since the substitution of isoelectronic Os for Ru increases the unit cell volume with , it should act as a negative chemical pressure and result in a decrease of with , in analogy with the apparent equivalence of chemical pressure in the behavior of of URu2-xFexSi2 and applied pressure in the behavior of of URu2Si2. Thus, the similarity in the behavior of for the isoelectronic Os and Fe substitutions for Ru in URu2Si2 is a surprising result that suggests that other factors may be involved in the behavior of , at least for the Os-substituted system. As suggested in Ref. Kanchanavatee14, , the similar trends for observed for Fe and Os substitutions in URu2Si2 correlate with similar behavior of the ratio of the lattice parameters , which increase with for both systems. Further experiments are underway on the URu2-xOsxSi2 system to address this issue.
V Concluding Remarks
In summary, the - phase diagram, as well as the magnetic moment on the uranium site as a function of that we have determined for URu2-xFexSi2 from the specific heat and magnetic neutron diffraction measurements presented herein, are both in good agreement with the - phase diagram and the evolution of the magnetic moment as a function of in URu2Si2. This suggests that substituting smaller Fe ions for Ru in URu2Si2 is equivalent to applying external pressure as was proposed in earlier work.Kanchanavantee:11 The substitution series URu2-xFexSi2 thus enables us to study the effects of pressure tuning on URu2Si2 with methods such as ARPES or STM that cannot be employed under pressure. This will provide a new opportunity to study the change of the electronic structure between the HO and LMAFM phases in URu2Si2 that are known to be intimately connected. Keeping in mind that electronic and spin degrees of freedom are closely coupled in URu2Si2, it would be desirable to probe the complete spin excitation spectrum within the Brillouin zone for an Fe concentration 0.1 to determine subtle differences between both phases. Ultimately, these future experiments on the nature of the LMAFM phase may allow us to obtain a fresh view on the elusive order parameter of the HO state.
VI Acknowledgements
The research at UCSD was supported by the U.S. Department of Energy, Office of Basic Energy Sciences, Division of Materials Sciences and Engineering under Grant No. DE-FG02-04ER46105 (sample synthesis) and the National Science Foundation under Grant No. DMR-0802478 (sample characterization). Work at Los Alamos National Laboratory (LANL) was performed under the auspices of the U.S. DOE, OBES, Division of Materials Sciences and Engineering. The identification of any commercial product or trade name does not imply endorsement or recommendation by NIST. We thank William Ratcliff and Yang Zhao for technical support during the experiments.
References
- (1) T. T. M. Palstra, A. A. Menovsky, J. van den Berg, A. J. Dirkmaat, P. H. Kes, G. J. Nieuwenhuys, and J. A. Mydosh, Phys. Rev. Lett. 55, 2727 (1985).
- (2) M. B. Maple, J. W. Chen, Y. Dalichaouch, T. Kohara, C. Rossel, M. S. Torikachvili, M. W. McElfresh, and J. D. Thompson, Phys. Rev. Lett. 56, 185 (1986).
- (3) W. Schlabitz, J. Baumann, B. Pollit, U. Rauchschwalbe, H. M. Mayer, U. Ahlheim, and C. D. Bredl, Z. Phys. B: Condens. Matter 62, 171 (1986).
- (4) B. Luethi, B. Wolf, P. Thalmeier, M. Gunther, W. Sixl, and G. Bruls, Phys. Lett. A 175 237-240 (1993).
- (5) J. A. Mydosh, and P. M. Oppeneer, Rev. of Mod. Phys. 83, 1301 (2011).
- (6) A. R. Schmidt, M. H. Hamidian, P. Wahl, F. Meier, A. V. Balatsky, J. D. Garrett, T. J. Williams, G. M. Luke, and J. C. Davis, Nature 465, 570 (2010).
- (7) P. Aynajian, E. H. da Silva Neto, C. V. Parker, Y. Huang, A. Pasupathy, J. Mydosh, and A. Yazdani, PNAS 107, 10383 (2010).
- (8) J. G. Rodrigo, F. Guinea, S. Vieira, and F. G. Aliev, Phys. Rev. B 55, 14318 (1997).
- (9) T. T. M. Palstra, A. A. Menovsky, and J. A. Mydosh, Phys. Rev. B 33, 6527(R) (1986).
- (10) J. Schoenes, C. Schonenberger, J. J. M. Franse, and A. A. Menovsky, Phys. Rev. B(R) 35 5375 (1987)
- (11) K. R. Shirer, J. T. Haraldsen, A. P. Dioguardi, J. Crocker, N. apRoberts-Warren, A. C. Shockley, C. H. Lin, D. M. Nisson, J. C. Cooley, M. Janoschek, K. Huang, N. Kanchanavatee, M. B. Maple, M. J. Graf, A. V. Balatsky, and N. J. Curro, Phys. Rev. B 88, 094436 (2013).
- (12) Y. S. Oh, K. H. Kim, P. A. Sharma, N. Harrison, H. Amitsuka, and J. A. Mydosh, Phys. Rev. Lett. 98, 016401 (2007).
- (13) Y. Kasahara, T. Iwasawa, H. Shishido, T. Shibauchi, K. Behnia, Y. Haga, T. D. Matsuda, Y. Onuki, M. Sigrist, and Y. Matsuda, Phys. Rev. Lett. 99, 116402 (2007).
- (14) D. A. Bonn, J. D. Garrett, and T. Timusk, Phys. Rev. Lett. 61 1305 (1988)
- (15) H. Ohkuni, Y. Tokiwa, K. Sakurai, R. Settai, T. Haga, E. Yamamoto, Y. Onuki, H. Yamagami, S. Takahashi, and T. Yanagisawa, Philos. Mag. B 79 1045 (1999).
- (16) M. M. Altarawneh, N. Harrison, S. E. Sebastian, L. Balicas, P. H. Tobash, J. D. Thompson, F. Ronning, and E. D. Bauer, Phys. Rev. Let. 106 146403 (2011).
- (17) A. F. Santander-Syro, M. Klein, F. L. Boariu, A. Nuber, P. Lejay, and F. Reinert, Nat. Phys. 5, 637 (2009).
- (18) C. Bareille, F. L. Boariu, H. Schwab, P. Lejay, F. Reinert, and A. F. Santander-Syro, Nature Communications 5, 4326 (2014).
- (19) C. Broholm, H. Lin, P. T. Matthews, T. E. Mason, W. J. L. Buyers, M. F. Collins, A. A. Menovsky, J. A. Mydosh, and J. K. Kjems, Phys. Rev. B 43, 12 809 (1991).
- (20) C. R. Wiebe, J. A. Janik, G. J. MacDougall, G. M. Luke, J. D. Garrett, H. D. Zhou, Y. J. Jo, L. Balicas, Y. Qiu, J. R. D. Copley, Z. Yamani, and W. J. L. Buyers, Nature Phys. 3, 96 (2007).
- (21) A. Villaume, F. Bourdarot, E. Hassinger, S. Raymond, V. Taufour, D. Aoki, and J. Flouquet, Phys. Rev. B 78, 012504 (2008).
- (22) F. Bourdarot, E. Hassinger, S. Raymond, D. Aoki, V. Taufour, L.-P. Regnault, and J. Flouquet, J. Phys. Soc. Jpn., 79, 064719 (2010).
- (23) F. Bourdarot, S. Raymond, and L.-P. Regnault, Philos. Mag., DOI: 10.1080/14786435.2014.935513 (2014).
- (24) N. P. Butch, M. E. Manley, J. R. Jeffries, M. Janoschek, K. Huang, M. B. Maple, A. H. Said, B. M. Leu, and J. W. Lynn, accepted for publication in Phys. Rev B.
- (25) J. A. Janik, H. D. Zhou, Y.-J. Jo, L. Balicas, G. J. Mac-Dougall, G. M. Luke, J. D. Garrett, K. J. McClellan, E. D. Bauer, J. L. Sarrao, Y. Qiu, J. R. D. Copley, Z. Yamani, W. J. L. Buyers, and C. R. Wiebe, J. Phys. Condens. Matter 21, 192202 (2009).
- (26) H. Amitsuka, M. Sato, N. Metoki, M. Yokoyama, K. Kuwahara, T. Sakakibara, H. Morimoto, S. Kawarazaki, Y. Miyako, and J. A. Mydosh, Phys. Rev. Lett. 83, 5114 (1999).
- (27) C. Broholm, J. K. Kjems, W. J. L. Buyers, P. Matthews, T. T. M. Palstra, A. A. Menovsky and J. A. Mydosh, Phys. Rev. Lett. 58, 1467 (1987).
- (28) H. Amitsuka, K. Matsuda, I. Kawasaki, K. Tenya, M. Yokoyama, C. Sekine, N. Tateiwa, T. C. Kobayashi, S. Kawarazaki, and H. Yoshizawa, J. Mag. Mag. Mater. 310 214 (2007)
- (29) P. G. Niklowitz, C. Pfleiderer, T. Keller, M. Vojta, Y. -K. Huang, and J. A. Mydosh, Phys. Rev. Lett. 104, 106406 (2010).
- (30) J. G. Rau and H. Y. Kee, Phys. Rev. B 85 245112 (2012).
- (31) P. Chandra, P. Coleman, and R. Flint, Nature 493 621 (2013).
- (32) P. Das, R. E. Baumbach, K. Huang, M. B. Maple, Y. Zhao, J. S. Helton, J. W. Lynn, E. D. Bauer, and M. Janoschek, New J. Phys 15, 053031 (2013).
- (33) N. Metoki, H. Sakai, E. Yamamoto, N. Tateiwa, T. Matsuda, and Y. Haga, J Phys. Soc. Jpn. 82, 055004 (2013).
- (34) K. A. Ross, L. Harringer, Z. Yamani, W. J. L. Buyers, J. D. Garrett, A. A. Menovsky, J. A. Mydosh, and C. L. Broholm, Phys. Rev. B 89, 155122 (2014).
- (35) E. Hassinger, G. Knebel, T. D. Matsuda, D. Aoki, V. Taufour, and J. Flouquet, Phys. Rev. Lett. 105, 216409 (2010).
- (36) N. Kanchanavatee, M. Janoschek, R. E. Baumbach, J. J. Hamlin, D. A. Zocco, K. Huang, and M. B. Maple, Phys. Rev. B 84, 245122 (2011).
- (37) J. W. Lynn, Y. Chen, S. Chang, Y. Zhao, S. Chi, W. Ratcliff, B. G. Ueland, and R. W. Erwin, J. Research NIST 117, 61 (2012).
- (38) N. Kanchanavatee, B. D. White, M. Janoschek, M. B. Maple (to be published).
- (39) A. Szytula, M. Slaski, B. Dunlap, Z. Sungaila, and A. Umezawa, J. Magn. Magn. Mater. 75, 71 (1988).
- (40) N. P. Butch, J. R. Jeffries, S. Chi, J. B. Leão, J. W. Lynn, and M. B. Maple, Phys. Rev. B 82, 060408(R) (2010).
- (41) K. Kuwahara, H. Sagayama, K. Iwasa, M. Kohgi, S. Miyazaki, J. Nozaki, J. Nogami, M. Yokoyama, H. Amitsuka, H. Nakao, and Y. Murakami, Acta Phys. Pol. B 34, 4307 (2003).
- (42) F. Bourdarot, A. Bombardi, P. Burlet, M. Enderle, J. Flouquet, P. Lejay, N. Kernavanois, V. P. Mineev, L. Paolasini, M. E. Zhitomirsky, and B. Fåk, Physica B 359-361, 986 (2005).
- (43) E. Hassinger, G. Knebel, K. Izawa, P. Lejay, B. Salce, and J. Flouquet, Phys. Rev. B 77, 115117 (2008).
- (44) H. Amitsuka, K. Matsuda, M. Yokoyama, I. Kawasaki, S. Takayama, Y. Ishihara, K. Tenya, N. Tateiwa, T. C. Kobayashi, and H. Yoshizawa, Physica B 403, 925 (2008).
- (45) G. Motoyama, N. Yokoyama, A. Sumiyama, and Y. Oda, J. Phys. Soc. Jpn. 77, 123710 (2008).
- (46) N. Kanchanavatee, B. D. White, V. W. Burnett, and M. B. Maple, Philos. Mag. 94, 3681 (2014).
- (47) Y. Dalichaouch, M. B. Maple, J. W. Chen, T. Kohara, C. Rossel, M. S. Torikachvili, and A. L. Giorgi, Phys. Rev. B 41, 1829 (1990).