Visualizing kinetic pathways of homogeneous nucleation in colloidal crystallization
Abstract
When a system undergoes a transition from a liquid to a solid phase, it passes through multiple intermediate structures before reaching the final state. However, our knowledge on the exact pathways of this process is limited, mainly due to the difficulty of realizing direct observations. Here, we experimentally study the evolution of symmetry and density for various colloidal systems during liquid-to-solid phase transitions, and visualize kinetic pathways with single-particle resolution. We observe the formation of relatively-ordered precursor structures with different symmetries, which then convert into metastable solids. During this conversion, two major cross-symmetry pathways always occur, regardless of the final state and the interaction potential. In addition, we find a broad decoupling of density variation and symmetry development, and discover that nucleation rarely starts from the densest regions. These findings hold for all our samples, suggesting the possibility of finding a unified picture for the complex crystallization kinetics in colloidal systems.
Introduction
Crystallization is an important process in condensed matter physics
and materials science. As liquid changes into solid, evolutions in
both symmetry and density take place. However, the exact kinetic
pathways across the liquid-to-solid transition remain as a focus of
debate, with no unified picture up to date. Although the classical
nucleation theory (CNT) provides a nice framework for understanding
crystallization, it has been well recognized that it does not
properly describe all aspects of the nucleation process. In the CNT
description, the crystallization kinetics proceeds as nucleation and
growth of nuclei: small crystals, which have the same symmetry and
density as the stable solid, directly emerge from liquid through
spontaneous density fluctuation. By contrast, however, previous
studies find rather different results: multiple metastable solids
that may differ from the stable solid are observed, with one
dominant component prevailing in the nucleation process
ostpc1897 ; alexprl78 . More specifically, the body-centered
cubic (BCC) symmetry dominates the early crystallization in
Lennard-Jones and other soft-potential systems
woldeprl95 ; woldejcp96 ; shenprl96 ; frenkeljpcm02 ; Moroniprl05 ; tanakasm ;
while the random hexagonal close-packed (RHCP) structure makes the
dominant metastable solid in hard-sphere systems
puseynature86 ; puseyprl89 ; zhunature97 ; gasserscience01 ; Auernature01 (RHCP is a mixture of face-centered cubic (FCC) and
hexagonal close-packed (HCP) structures). The kinetic origin of
these metastable solids, especially of the dominant component, is
currently an outstanding issue requiring experimental elucidation.
Correspondingly, the density variation accompanying such symmetry transformation remains unclear. The traditional view of CNT indicates a simultaneous density and symmetry variation within one step; while recent simulations suggest the possibility of either a two-step variation where densification precedes order construction Woldescience , or a gradual transition in both symmetry and density driven by the bond order fluctuation tanakapnas ; tanakasr . The exact density-symmetry correlation depends on the kinetic transformations among different intermediate structures which can be best clarified with single-particle level experiments.
The missing of kinetic information also prevents a clear understanding on the liquid state immediately before crystallization. Unlike the conventional picture of a uniformly disordered liquid state, numerical simulations suggest the existence of relatively-dense or relatively-ordered liquid structures serving as precursors of nuclei Schillingprl ; Tothprl ; lechnerprl ; tanakapnas ; tanakasr ; Woldescience ; Lutskoprl , which may account for an intermediate crystallization step Martinpre03 ; SchopePRL ; Schopejcp ; Savageprl . However, the entire picture is far from clear. How does liquid pass through the precursor state to become metastable solids remains a big mystery – even the direct observation of precursors in three-dimensional (3D) real space is still missing. To tackle this mystery, illustrating the crystallization kinetics again plays an essential role.
In this study, we report single-particle level measurements on the kinetics of 3D colloidal crystallization, for both symmetry and density transformations. To dig out the universal kinetics, extensive studies across different final states and interaction potentials are performed. Colloidal systems are used due to their similar phase-transition behaviors as atomic and molecular systems, while their large particle sizes enabling single-particle level visualization larsennature97 ; weeksscience2000 ; gasserscience01 ; andersonnature2002 ; schallscience2004 ; yodhscience2005 ; salvagescience06 ; lunature2008 ; yilongscience12 . We directly observe relatively-ordered liquid structures behaving as precursors, out of which small nuclei emerge. These precursors exhibit local orders close to HCP, BCC and FCC symmetries, and subsequently convert into these metastable solids. During this precursor-to-solid conversion, interestingly, two major cross-symmetry pathways are universally observed: (1) HCP-like precursors to BCC metastable solid and (2) HCP-like precursors to FCC metastable solid. These major pathways could explain the kinetic origin of the dominant metastable solid. In the density evolution, we surprisingly discover a strong decoupling between density variation and symmetry development, and demonstrate that initial nucleation rarely starts from the densest regions of our samples.
Our system is made up of poly(methyl methacrylate) colloids with
diameter and polydispersity less than 2.5,
suspended in a density and refractive index matched solvent. The
particles carry charges and form Wigner crystals at low
concentrations LeunissenNature2005 ; Pengprl2012 . We fix the
sample concentration at 17% which avoids particle-particle contact
and ensures soft-repulsive potential (see “Methods”). By tuning
the Debye screening length, , and the surface charge,
, we can obtain BCC-stable and FCC-stable crystals
respectivelyLeunissenNature2005 ; Hynninen . The phase diagram
is shown in the Supplementary Information (SI, Fig.SI-1A). The
adjustable stable states offer the opportunity to study kinetic
pathways for various transition situations. We shear melt colloidal
crystals and record the re-crystallization process immediately after
agitation, at the supercooling of , with being the melting temperature (see
“Methods”).
Three symmetries in precursors and nuclei
By inspecting the local bond order parameters (shown later), we can
specify highly-ordered nuclei particles and relatively-ordered
liquid particles (in comparison to normal liquid particles), as
shown respectively by the dark-brown and light-brown spheres in
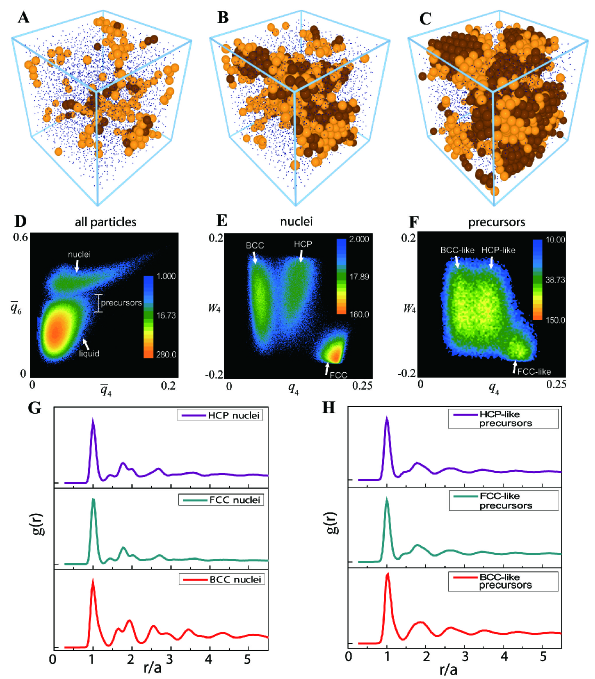
Fig.1A-C (movie S1): at the beginning of nucleation in Fig.1A, small
nuclei (dark brown) emerge from relatively-ordered liquid structures
(light brown) which serve as precursors of solid. Moreover,
such precursors are continuously created in the subsequent
development, as demonstrated by Fig.1B around the stage of critical
nuclei size and Fig.1C for the post-critical stage. Precursors wrap
the nuclei like a layer of coating and account for an intermediate
step in the liquid-solid transition Schillingprl ; lechnerprl ; tanakapnas ; tanakasr ; Woldescience ; Lutskoprl .
To characterize the local order of any particle , we measure its local bond order parameters, , , and the coarse grained bond order parameters, (see SI for more information) steinhardtprb83 ; woldejcp99 ; lechnerjcp08 . Good statistics is obtained by locating over particles at 50 different regions within the same sample, in the early crystallization stage (solid fraction ). A clear distinction between nuclei and liquid is demonstrated by the number distribution of all particles in the - plane in Fig.1D: the upper group with larger is composed by nuclei particles; while the lower group with smaller is by liquid particles. Within the liquid group, we further pick out the particles with relatively high bond order, , as the light-brown precursors shown in Fig.1A-C. According to the two-step nucleation theory, precursors are dense structures with a symmetry lower than solid Tothprl ; Schillingprl ; SchopePRL ; Lutskoprl . Our precursors are therefore defined as the particles with relatively high local order () but below the level of solid structures (solid bond number woldejcp99 ), in agreement with Kawasaki et al tanakapnas . With this definition ( and ), the precursors also have densities higher than normal liquid (see Fig.SI-4D in SI), which is consistent with previous simulations Tothprl ; Schillingprl ; SchopePRL ; Lutskoprl . Note that we can further vary the threshold value of 0.27 to numbers between 0.27 to 0.30, and obtain qualitatively similar results, confirming that the precursor properties do not depend on the choice of exact threshold values.
Several crystalline symmetries appear as we further analyze the local order of nuclei and precursors. For nuclei, three distinct symmetries – BCC, HCP, and FCC – are illustrated by the - plot in Fig.1E. Clearly, nuclei at the early stage are composed by various components gasserscience01 , which evolve into one stable solid during much later development. Moreover, the same analysis on precursors reveals this symmetry differentiation even before the solid formation: there exist BCC-like, HCP-like and FCC-like precursors whose local structures are similar to the corresponding nuclei, as shown in Fig.1F and Fig.SI-4C. For the first time, the experiment reveals multiple symmetries emerging in precursors within the liquid stage, which behave as the “seeds” of the multiple metastable solids and thus account for their kinetic origins.
To verify our symmetry analysis, we plot the radial distribution function, , for the three types of nuclei symmetries in Fig.1G: all peaks match precisely with the ideal crystals, confirming the validity of our bond order analysis (note that HCP and FCC have similar as expected). Moreover, we find a good match in the main peaks between the precursors (Fig.1H) and the corresponding nuclei (Fig.1G), confirming their underlying structural connection. Because of this structural similarity, the existence of precursors at the liquid-solid interface may dramatically reduce the interfacial tension and promote the rate of nucleationgasserscience01 ; tanakapnas . A small surface tension is also consistent with the ramified nuclei profile observed in the early crystallization stage both in this experiment (see Fig.1A and Fig.1B as an example) and in the previous study gasserscience01 .
In addition, we clarify one important point: the local order in
precursors revealed by us is quite short-ranged, typically extending
only to the first shell (the central particle plus its neighbors).
When longer ranges are involved, however, the bulk phase of
precursor clusters is quite amorphous, due to the mixing and
interfering of multiple components (see Fig.2A). In comparison to
the previous studies, our precursor definition is similar to the one
by Kawasaki et al tanakapnas ; but is probably only
part of the precursors defined in some other studies Tothprl ; Schillingprl ; SchopePRL ; Lutskoprl , which may also contain a truly
amorphous fraction. To study this truly amorphous fraction, dynamic
investigations regarding the lifetime of dense amorphous clusters
would be needed. In conclusion, the precursors in our study exhibit
multiple local orders at short-range, but are amorphous at
intermediate and long ranges (see more details in SI, session IIC,
page 10-15).
Kinetic pathways during precursor-to-solid conversion
Our experiment confirms the existence of precursors, which exhibit
various symmetries and convert into different metastable solids.
However, the symmetry transformation during the precursor-to-solid
conversion requires further illumination. To visualize the process,
we color the three symmetries differently and demonstrate their
evolutions in Fig.2A-C (movie S2): at the very beginning in Fig.2A,
the HCP symmetry (nuclei + precursors, purple spheres) dominates the
other two, while the BCC symmetry (red spheres) catches up around
the critical nuclei size in Fig.2B, and later dominates the system
(see Fig.2C). This particular sample eventually develops into a BCC
crystal.
The system evolves from HCP-dominant to BCC-dominant, indicating transformations across different symmetries. To figure out the transformation pathways, we track the relative fractions of different symmetries with respect to time, for both precursors and nuclei. The typical result for a BCC-stable system is demonstrated in Fig.2D: for all three symmetries, the precursor (open symbols) and nuclei (close symbols) curves are roughly parallel, demonstrating their close correlation. However, a gap also exists between the two, revealing cross-symmetry transformations during the precursor-to-solid conversion. More specifically, in the HCP panel the precursor curve is higher than the nuclei one, indicating an extra fraction of HCP-like precursors that must convert into other types of nuclei. Correspondingly, in BCC and FCC panels excess fractions of nuclei (instead of precursors) are found, reconfirming the conversion from HCP-like precursors. Therefore our data indicate two cross-symmetry pathways during the precursor-to-solid conversion: (1) HCP-like precursors to BCC nuclei and (2) HCP-like precursors to FCC nuclei. The same kinetic pathways are also observed in a typical FCC-stable system, as shown in Fig.2E. In addition, hard-sphere systems exhibit the same behavior (see Fig.SI-12 in SI) as well, demonstrating the general validity of the two cross-symmetry pathways.
To visualize the pathways directly, we illustrate all possible conversions between different types of precursors and nuclei in the plane in Fig.2F: the values are used for distinguishing nuclei from precursors; while the values are used for distinguishing different symmetries. The lower cluster indicates precursors, the upper cluster represents nuclei, and the connection in between is from the particles caught during the precursor-to-nuclei conversion which directly visualizes the kinetic pathway. Clearly, a pathway always exists for a conversion within the same symmetry as demonstrated by the three corresponding images in Fig.2F (upper-left to lower-right diagonal), which verifies the previous simulation tanakasr . More interestingly, cross-symmetry pathways previously never reported also appear. Two strong pathways from HCP-precursors to BCC-nuclei and FCC-nuclei are revealed in the second row, consistent with Fig.2D and Fig.2E. At the same time, two weak pathways from BCC-precursors and FCC-precursors to HCP-nuclei are also found, although overwhelmed by the effect from the two strong ones just mentioned. For the interaction between BCC and FCC symmetries, there is essentially no pathway during the conversion. These kinetic pathways are universally observed in all our soft-repulsive systems.
In soft-repulsive systems, we observe dominant HCP-like precursors initially tanakapnas ; tanakasr , which can subsequently convert into BCC and FCC nuclei via two cross-symmetry pathways. However, the pathway to BCC-nuclei is much more significant, as demonstrated by its much stronger magnitude (see Fig.2F, 2nd row, the leftmost image compared with the rightmost image). Correspondingly, BCC-symmetry dominates the early metastable solid phase in both our soft-repulsive samples and the systems previously studied alexprl78 ; woldeprl95 ; woldejcp96 ; shenprl96 ; frenkeljpcm02 ; Moroniprl05 . Therefore, we propose that the dominant cross-symmetry pathway probably leads to the dominant metastable solid in early crystallization. To further test this scenario, we perform the same measurements in hard-sphere systems, whose dominant metastable solid is RHCP (mixture of FCC and HCP) instead of BCC gasserscience01 ; Auernature01 . As expected, the dominant pathway changes accordingly: the HCP-like precursors now mainly transfer into FCC-nuclei instead of BCC, as FCC is one important component of the RHCP structure (see Fig.SI-12 in SI). Both the soft-repulsive and hard-sphere experiments are consistent with our newly proposed scenario, which explains the kinetic origin of the dominant metastable solid in early crystallization.
We summarize our crystallization kinetics in Fig.2G. As temperature
drops below the melting point, precursors emerge out of liquid, with
the HCP-like component dominating the BCC-like and the FCC-like
ones. These precursors then convert into metastable solids. Besides
the conversion within the same symmetry, interestingly,
cross-symmetry pathways also exist: there are two major ones from
HCP-like precursors to BCC and FCC nuclei, and two minor ones from
BCC-like and FCC-like precursors to HCP nuclei, as represented by
the solid and dashed lines respectively. The effect of major
pathways overwhelm the effect of minor ones. Eventually all
metastable solids evolve into the stable solid note1 .
Density-symmetry correlation
In the process of crystallization, the establishment of crystalline
order is naturally accompanied by density change. We illustrate
their correlation by directly measuring the variation of local
density with respect to the development of local order. The local
density, , is determined by the Voronoi diagram; and the local
order is quantified by the solid bond number, (see SI for the
exact definition). Typically a larger indicates a better
crystalline order. Good statistics is obtained from measurements
over particles in the early crystallization stage (solid
fraction ). At each solid bond number, we obtain the
average local density and illustrate their correlation in the
- plot.
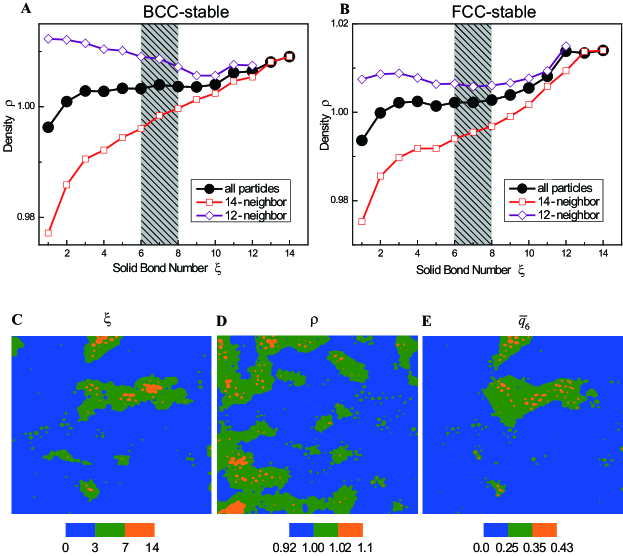
A typical - dependence is shown by the solid symbols in Fig.3A for a BCC-stable system. Clearly there exists a density plateau over a broad range of local order, , indicating very little density change against a significant development of order. In particular, across the hatched area of liquid-solid boundary (), does not experience any abrupt increase, in sharp contrast to the density jump described in the classical nucleation theory. Significant densification only occurs at either quite early () or rather late () stages of local order construction, and corresponds respectively to the initial formation of precursors and the final perfection of local order. We note that particles with largely overlap with the precursor particles defined previously (see their similar in Fig.SI-6). Consequently, our experiment reveals a rather complex three-stage correlation for density and symmetry development: initially they grow simultaneously during the formation of precursors (), followed by a decoupling plateau throughout precursor-to-solid conversion (), and then reappears the simultaneous growth for the final perfection of local order (). This three-stage trend has never been reported previously and requires further theoretical explanation.
Different symmetries and structures emerge as early as in the liquid stage, and therefore we illustrate their density variations separately as well. We can divide the densities of most particles () into two branches: the 14-neighbor branch (BCC-like) and the 12-neighbor branch (FCC-like and HCP-like), as shown by the open symbols in Fig.3A. The two branches exhibit a large difference at low , which diminishes as crystalline order increases. Moreover, before the order is fully constructed, the 14-neighbor branch is always below the 12-neighbor one, indicating a lower density for the BCC-like structure. Since we observe a major pathway from HCP-like precursors to BCC nuclei in the soft-repulsive systems, it indicates a conversion from the high-density branch to the low-density one. This conversion apparently lowers the high-density branch, raises the low-density one, while keeps the average density largely unchanged, as revealed by the plateau of solid symbols. Similar results are also observed in the FCC-stable systems shown in Fig.3B, except with two minor differences: (1) there is a sharper density increase after the plateau, and (2) the fully developed FCC crystal (i.e., the end point of upper branch) is denser than the BCC counterpart (i.e., the end point of lower branch) while the opposite is true in Fig.3A.
Over a broad range of order construction, a decoupling plateau
between density variation and symmetry development is observed,
especially at the liquid-to-solid transition boundary
(). Such discrepancy with the classical picture is even
more apparent when we compare the spatial distributions of and
in the early crystallization stage: very little correlation
is found between the nucleation events indicated by in Fig.3C
and the dense regions specified by in Fig.3D. The densest
regions (, orange areas) are significantly denser than
the nuclei (), and appear mostly at disordered
locations. At the same time, the local density fluctuations in both
space and time are more than , much larger than the density
mismatch between liquid and nuclei (). To further test
this result, we plot the spatial distribution of local bond order,
, in Fig.3E, and again find very little correlation
with the density plot in Fig.3D. These results unambiguously
demonstrate that nucleation events do not start from the
densest regions, in sharp contrast to the conventional picture of
nucleation. However, the similarity between Fig.3C and Fig.3E
indicates a strong correlation between the nucleation events and the
local bond ordertanakapnas ; tanakasr .
Discussions
One important question remains unclear: why the HCP-like precursors
dominate initially? We believe it is due to the common feature of
tetrahedra clusters adjacent by faces, which widely appear in both
the disordered liquid Medvedevprl2007 and the HCP-like
precursors. This structural similarity makes the transformation to
HCP-like precursors a major first step. Subsequently, the local
HCP-like symmetry converts into other symmetries via slight
deformations: a shear parallel to the hexagonal plane can result in
FCC symmetry while an in-plane compression (or stretch) may lead to
BCC structure. Both approaches only involve locally small movements
with little energy cost, while they produce significant changes in
symmetry. The underlying inhomogeneous stresses may come from the
surface tension of ramified liquid-solid interfaces, as supported by
the observation that symmetry conversion mainly occurs at this
interface. However this picture is largely qualitative and calls for
further study.
Moreover, the density fluctuations at single particle level exceed the liquid-solid density mismatch substantially, implying that local structures can easily fluctuate in and out of the solid density. Combining with the observation that nucleation rarely starts from the densest regions, we suspect that density fluctuation may not be the main driving factor for our crystallization process; instead the local bond order fluctuation could be a reasonable candidatetanakasr . Illustrating these emerging questions should shed new light on the conventional picture of crystallization.
methods
Our system is made up of NBD dyed poly(methyl methacrylate) (PMMA) colloids with diameter and polydispersity less than 2.5. The colloids are suspended in a mixture of non-polar and weakly-polar solvents, which closely matches both the refractive index and the density of particles (see Experimental Details and Phase Diagram in the Supplementary Information (SI) for more details). The particles are charge-stabilized in the solvent, with the weakly-screened electric repulsion causing Wigner crystals at low concentrations LeunissenNature2005 ; Pengprl2012 . To ensure soft-repulsive interaction, we fix the concentration of all samples at 17% which avoids direct contacts among particles. By adjusting the volume ratio between the non-polar to weakly-polar solvents LeunissenNature2005 , we can tune the Debye screening length, , and the surface charge, Hynninen . This leads to different stable solid states: at long screening lengths, the BCC symmetry is most stable; while at short screening lengths, the most stable symmetry becomes FCC. We measure the phase diagram with various samples (see Fig.SI-1A in SI), and show the detailed analysis of two typical samples, BCC-stable (960 nm) and FCC-stable (520 nm), respectively. The adjustable stable states offer the opportunity to study various precursor-to-solid(metastable) kinetic pathways. We shear melt colloidal crystals and record the re-crystallization process immediately after agitation, with a Leica Sp5 confocal microscope scanning in three dimensions with respect to time. We can estimate the degree of supercooling below the melting temperature, , for all our solid samples in the phase diagram. Two different approaches are applied: the distance from the melting line yields ; and the Lindemann parameter approach Meijer ; zahnprl00 gives . The two independent estimates agree with each other within the experimental accuracy.
Correspondence and requests: Correspondence and requests for materials should be addressed to L. X.
Acknowledgements: P. T. and L. X. are supported by the Research Grants Council of Hong Kong (GRF grant CUHK404211, ECS grant CUHK404912, CUHK Direct Grant 4053021), and N. X. is supported by National Natural Science Foundation of China (No. 91027001 and 11074228), National Basic Research Program of China (973 Program No. 2012CB821500), CAS 100-Talent Program (No. 2030020004), and Fundamental Research Funds for the Central Universities (No. 2340000034). We thank Hajime Tanaka and Eli Sloutskin for helpful discussions, and Andrew Schofield for providing the particles.
Author contributions: P. T. and L. X. conceived and designed the experiments, P. T. performed the experiments, P. T., N. X. and L. X. analyzed the data, P. T. developed the new approach of local bond order analysis, P. T. and L. X. wrote the paper.
References
- (1) Ostwald, W. Studien über die Bildung und Umwandlung fester Körper. 1. Abhandlung: Übersättigung und Überkaltung, Z. Phys. Chem. 22, 289-330 (1897).
- (2) Alexander, S. & McTague, J. Should All Crystals Be bcc? Landau Theory of Solidification and Crystal Nucleation, Phys. Rev. Lett. 41, 702-705 (1978).
- (3) ten Wolde, P. R., Ruiz-Montero, M. J. & Frenkel, D. Numerical Evidence for bcc Ordering at the Surface of a Critical fcc Nucleus, Phys. Rev. Lett. 75, 2714-2717 (1995).
- (4) ten Wolde, P. R., Ruiz-Montero, M. J. & Frenkel, D. Numerical calculation of the rate of crystal nucleation in a Lennard-Jones system at moderate undercooling, J. Chem. Phys. 104, 9932-9947 (1996).
- (5) Shen, Y. C. & Oxtoby, D. W. bcc Symmetry in the Crystal-Melt Interface of Lennard-Jones Fluids Examined through Density Functional Theory, Phys. Rev. Lett. 77, 3585-3588 (1996).
- (6) Auer, S. & Frenkel, D. Crystallization of weakly charged colloidal spheres: a numerical study, J. Phys.: Condens. Matter 14, 7667 (2002).
- (7) Moroni, D., ten Wolde, P. R., & Bolhuis, P. G. Interplay between Structure and Size in a Critical Crystal Nucleus, Phys. Rev. Lett. 94, 235703 (2005).
- (8) Russo, J. & Tanaka, H. Selection mechanism of polymorphs in the crystal nucleation of the Gaussian core model, Soft Matter 8, 4206-4215 (2012).
- (9) Pusey, P. N. & van Megen, W. Phase behaviour of concentrated suspensions of nearly hard colloidal spheres, Nature 320, 340-342 (1986).
- (10) Pusey, P. N. et al. Structure of crystals of hard colloidal spheres, Phys. Rev. Lett. 63, 2753-2756 (1989).
- (11) Zhu, J. et al. Crystallization of hard-sphere colloids in microgravity, Nature 387, 883-885 (1997).
- (12) Gasser, U., Weeks, E. R., Schofield, A., Pusey, P. N. & Weitz, D. A. Real-Space Imaging of Nucleation and Growth in Colloidal Crystallization, Science 292, 258-262 (2001).
- (13) Auer, S. & Frenkel, D. Prediction of absolute crystal-nucleation rate in hard-sphere colloids, Nature 409, 1020-1023 (2001).
- (14) tenWolde, P. R. & Frenkel, D. Enhancement of Protein Crystal Nucleation by Critical Density Fluctuations, Science 277, 1975-1978 (1997).
- (15) Kawasaki, T. & Tanaka, H. Formation of a crystal nucleus from liquid, Proc. Nat. Acad. Sci. 107, 14036-14041 (2010).
- (16) Russo, J. & Tanaka, H. The microscopic pathway to crystallization in supercooled liquids, Scientific Reports 2, 505 (2012).
- (17) Schilling, T., Schöpe, H. J., Oettel, M., Opletal, G. & Snook, I. Precursor-Mediated Crystallization Process in Suspensions of Hard Spheres, Phys. Rev. Lett. 105, 25701(2010).
- (18) Tóth, G. I., Pusztai, T., Tegze, G., Tóth, G., & Gránásy, L. Amorphous Nucleation Precursor in Highly Nonequilibrium Fluids, Phys. Rev. Lett. 107, 175702 (2011).
- (19) Lechner, W., Dellago, C. & Bolhuis, P. G. Role of the Prestructured Surface Cloud in Crystal Nucleation, Phys. Rev. Lett. 106, 85701 (2011).
- (20) Lutsko, J. F. & Nicolis, G. Theoretical Evidence for a Dense Fluid Precursor to Crystallization, Phys. Rev. Lett. 96, 046102 (2006).
- (21) Martin, S., Bryant, G. & van Megen, W. Crystallization kinetics of polydisperse colloidal hard spheres: Experimental evidence for local fractionation, Phys. Rev. E 67, 061405 (2003).
- (22) Schöpe, H. J., Bryant, G. & van Megen, W. Two-Step Crystallization Kinetics in Colloidal Hard-Sphere Systems, Phys. Rev. Lett. 96, 175701 (2006).
- (23) Iacopini, S., Palberg, T. & Schöpe, H. J. Crystallization kinetics of polydisperse hard-sphere-like microgel colloids: Ripening dominated crystal growth above melting, J. Chem. Phys. 130, 084502 (2009).
- (24) Savage, J. R. & Dinsmore, A. D. Experimental Evidence for Two-Step Nucleation in Colloidal Crystallization, Phys. Rev. Lett. 102, 198302 (2009).
- (25) Larsen, A. E. & Grier, D. G. Like-charge attractions in metastable colloidal crystallites, Nature 385, 230-233 (1997).
- (26) Weeks, E. R., Crocker, J. C., Levitt, A. C., Schofield, A. & Weitz, D. A. Three-Dimensional Direct Imaging of Structural Relaxation Near the Colloidal Glass Transition, Science 287, 627-631 (2000).
- (27) Anderson, V. J. & Lekkerkerker, H. N. Insights into phase transition kinetics from colloid science, Nature 416, 811-815 (2002).
- (28) Schall, P., Cohen, I., Weitz, D. A. & Spaepen, F. Visualization of Dislocation Dynamics in Colloidal Crystals, Science 305, 1944-1948 (2004).
- (29) Alsayed, A. M., Islam, M. F., Zhang, J., Collings, P. J. & Yodh, A. G. Premelting at Defects Within Bulk Colloidal Crystals, Science 309, 1207-1210 (2005).
- (30) Savage, J. R., Blair, D. W., Levine, A. J., Guyer, R. A. & Dinsmore, A. D. Imaging the Sublimation Dynamics of Colloidal Crystallites, Science 314, 795-798 (2006).
- (31) Lu, P. J., Zaccarelli, E., Ciulla, F., Schofield, A. B., Sciortino, F. & Weitz, D. A. Gelation of particles with short-range attraction, Nature 453, 499-503 (2008).
- (32) Wang, Z. R., Wang, F., Peng, Y., Zheng, Z. Y. & Han, Y. L. Imaging the Homogeneous Nucleation During the Melting of Superheated Colloidal Crystals, Science 338, 87-90 (2012).
- (33) Leunissen, M. E. et al. Ionic colloidal crystals of oppositely charged particles, Nature 437, 235-240 (2005).
- (34) Tan, P., Xu, N., Schofield, A. & Xu, L. Understanding the Low-Frequency Quasilocalized Modes in Disordered Colloidal Systems, Phys. Rev. Lett. 108, 095501 (2012).
- (35) Hynninen, A. & Dijkstra, M. Phase diagrams of hard-core repulsive Yukawa particles, Phys. Rev. E 68, 021407 (2003).
- (36) Steinhardt, P. J., Nelson, D. R. & Ronchetti, M. Bond-orientational order in liquids and glasses, Phys. Rev. B 28, 784-805 (1983).
- (37) ten Wolde, P., Ruiz-Montero, M. J. & Frenkel, D. Simulation of homogeneous crystal nucleation close to coexistence, Faraday Discuss 104, 93-110 (1996).
- (38) Lechner, W. & Dellago, C. Crystal structures based on averaged local bond order parameters, J. Chem. Phys. 129, 114707 (2008).
- (39) We find the dominant solid phase in our experimets is BCC(960 nm) or RHCP(520 nm) after several days.
- (40) Anikeenko, A. V. & Medvedev, N. N. Polytetrahedral Nature of the Dense Disordered Packings of Hard Spheres, Phys. Rev. Lett. 98, 235504 (2007).
- (41) Meijer, E. J. & Frenkel, D. Melting line of Yukawa system by computer simulation, J. Chem. Phys. 94, 2269-2271 (1991).
- (42) Zahn, K. & Maret, G. Dynamic Criteria for Melting in Two Dimensions, Phys. Rev. Lett. 85, 3656-3659 (2000).
![[Uncaptioned image]](/html/1412.5788/assets/x2.png)