Enabling the next generation of cm-wavelength studies of high-redshift molecular gas with the SKA
Abstract:
The Square Kilometre Array will be a revolutionary instrument for the study of gas in the distant Universe. SKA1 will have sufficient sensitivity to detect and image atomic 21 cm HI in individual galaxies at significant cosmological distances, complementing ongoing ALMA imaging of redshifted high-J CO line emission and far-infrared interstellar medium lines such as [CII] 157.7m. At frequencies below 50 GHz, observations of redshifted emission from low-J transitions of CO, HCN, HCO+, HNC, H2O and CS provide insight into the kinematics and mass budget of the cold, dense star-forming gas in galaxies. In advance of ALMA band 1 deployment (35 to 52 GHz), the most sensitive facility for high-redshift studies of molecular gas operating below 50 GHz is the Karl G. Jansky Very Large Array (VLA). Here, we present an overview of the role that the SKA could play in molecular emission line studies during SKA1 and SKA2, with an emphasis on studies of the dense gas tracers directly probing regions of active star-formation.
1 Gas in galaxies: 2020 and beyond
Studies of the dense star-forming gas in high-redshift galaxies have been transformed in recent years owing to the increased sensitivity and bandwidth of new submm through cm-wavelenth facilities like the Karl G. Jansky Very Large Array (VLA), the Plateau de Bure Interferometer (PdBI) and the Atacama Large Millimeter/submm Array (ALMA). A few highlights include observations of molecular gas through 12CO (hereafter CO) line emission in main sequence star-forming galaxies at (Daddi et al. 2008, 2010; Dannerbauer et al. 2009; Tacconi et al. 2010, 2013; Aravena et al. 2010, 2014), the detection and imaging of CO and [CII] line emission in quasar host galaxies during the epoch of reionization (Walter et al. 2003, 2004; Carilli et al. 2007; Wang et al. 2013; Willott et al. 2013), and the first blank-field CO emission line surveys for gas-rich galaxies over significant cosmological volumes (Walter et al. 2014; Decarli et al. 2014). These new surveys greatly expand our knowledge of the gas content of galaxies in the distant Universe, which had been based primarily on detections of CO in far-infrared luminous AGN host galaxies and submm/mm-selected star-forming galaxies (see Carilli & Walter 2013 for a recent review). The emerging picture is that, with the exception of atomic HI, the cool gas content of main sequence star-forming galaxies is now accessible with current facilities across the peak in cosmic star-formation. Here, we summarize the molecular gas studies of high-redshift galaxies that could be enabled by the SKA.
In 2020 and beyond, the SKA will operate in parallel with major new facilities covering much of the electromagnetic spectrum, collaboratively conducting sensitive studies of gas and star-formation in galaxies well into the epoch of reionization (EoR) at . These facilities include optical telescopes like the European Extremely Large Telescope (E-ELT), the Thirty Meter Telescope (TMT), and the Large Synoptic Survey Telescope (LSST), and infrared facilities such as the James Webb Space Telescope (JWST) and Euclid. At long submm/mm-wavelengths, ALMA, NOEMA, the Cerro Chajnantor Atacama Telescope (CCAT) and the Large Millimeter Telescope (LMT) will shed light on Galactic and extragalactic regions of the Universe obscured by molecular gas and dust. The long wavelength complement to these facilities will be the SKA.
One of the main science drivers for the SKA has always been the study of 21 cm HI line emission in normal galaxies out to redshifts . Predictions and science drivers for future SKA extragalactic HI surveys are presented by other authors in this volume (e.g. Blyth et al.; de Blok et al.; Morganti et al.; Obreschkow et al.; Santos et al.; Staveley-Smith et al.). Similarly, the SKA will provide the unique ability to survey thermal and non-thermal (synchrotron) radio emission at low radio frequencies covering 10s to 1000s of square degrees in order to probe the evolution of obscured star-formation out to redshifts approaching the end of reionization at (see Prandoni et al., Jarvis et al., and Murphy et al. in this volume). Over fields much smaller than one square degree, this obscured star-formation will be probed to higher redshifts by ALMA, which has already been successful in imaging far-infrared continuum emission in star-forming galaxies during the epoch of reionization (e.g. Wang et al. 2013). For galaxy evolution studies, the wide field imaging capabilities of the SKA will be complemented at optical/infrared wavelengths by LSST and Euclid. Finally, ALMA is sensitive to the high-J CO, HCN, HCO+ and CS line emission in the distant Universe at frequencies GHz ( GHz once band 1 is deployed), leaving open the need for a sensitive facility able to conduct surveys of the low-J transitions of these molecules that provide an anchor for the spectral line energy distribution. Without this anchor, there will be degeneracies in the models fit to derive gas properties such as density and temperature. Measurements of only the high-J CO emission lines may lead to a bias in molecular gas mass estimates as their intensities will depend on the excitation conditions of the gas.
2 Molecular CO line emission with the SKA
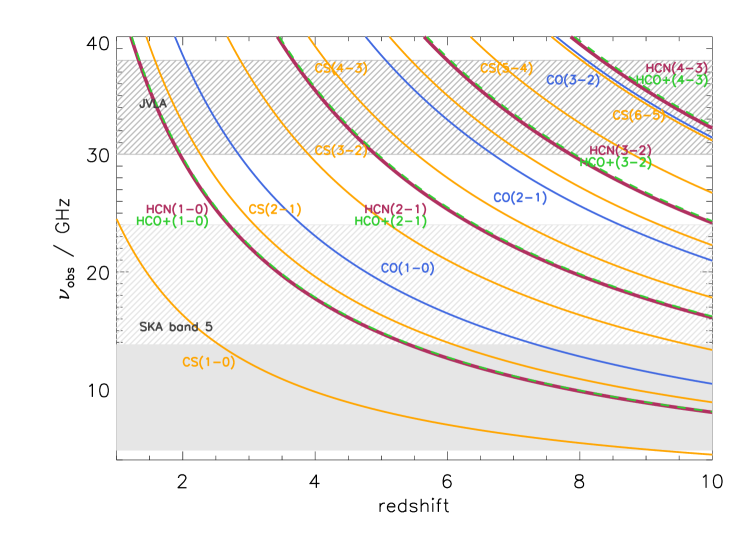
Among the outstanding challenges for galaxy formation studies is to quantify the kinematic properties and to measure the gas content of star-forming galaxies over the history of the Universe. Aided by the typical increase in line flux density with increasing rotational transition in star-forming molecular gas, interferometric observations of CO line emission provide a means of estimating dynamical masses through the linewidths and source sizes in galaxies out to the very early Universe (e.g. Walter et al. 2004; Riechers et al. 2013). At cm-wavelengths, one is sensitive to the low-J transitions of this line, the luminosity of which has traditionally been used as a means of estimating the total cold molecular () mass that is available to fuel star-formation by adopting a CO-to-H2 conversion factor, (e.g Downes & Solomon 1998; Bolatto et al. 2013). As such, observations of high-redshift molecular CO line emission have naturally become one of the main science drivers for current and future cm-wavelength interferometers operating above 20 GHz. Figure 1 shows the redshifted frequencies of the low-J CO lines, along with those of dense gas tracing molecular line species.
Here, we consider the likelihood that CO J=1-0 line emission will be either a viable tracer of galaxy dynamics or a tool for estimating cold molecular gas masses with the current plans for SKA1-MID and SKA2. The possibility of CO intensity mapping with the SKA is discussed in another chapter (Chang et al.). Five bands are currently defined for SKA1-MID, although only three are expected to be deployed in the first phase. Band 5 would extend up to 13.8 GHz, corresponding to CO J=1-0 line emission redshifted to . The most luminous metal-enriched quasar host galaxy at is undetected in CO J=6-5 line emission with the PdBI (Venemans et al. 2012), which should benefit from a factor of 36 increase in flux density with respect to the CO J=1-0 line emission owing to the dependance of flux density on rest frequency. Molecular line emission from transitions where the excitation temperature is similar to the CMB background temperature () should not be detectable (e.g. Papadopoulos et al. 2000; Obreschkow et al. 2009; Da Cunha et al. 2013b). In the case of a star-forming galaxy (similar to a submm galaxy or a far-infrared luminous quasar host galaxy) with molecular gas at an average kinetic temperature of K (at ), the CO J=1-0 line is predicted to exhibit 40% of the flux density it would have in the absence of the CMB. In the case of more quiescent star-formation where the kinetic temperature of the gas would be K , the integrated CO J=1-0 line flux density of that galaxy at would be down to 5% of its value. Such effects likely contributed to the (sensitive) Green Bank Telescope (GBT) non-detections of CO J=1-0 in two star-forming Ly emitters (LAEs) at by Wagg, Kanekar & Carilli (2009), including the gravitationally lensed LAE HCM6A, which may have a star-formation rate M⊙ yr-1 (Chary et al. 2005). During these early cosmic times, corresponding to the epoch of reionization (EoR), measuring the kinematic properties (dynamical mass estimates) of quasar host galaxies, or redshifts for the lower luminosity galaxy population, would best be achieved through observations of the redshifted [CII] line emission at mm-wavelengths (e.g. Maiolino et al. 2005; Walter et al. 2009; Wagg et al. 2012a; Carilli et al. 2013; Wang et al. 2013; Riechers et al. 2014).
Adding to the inherent difficulty in detecting the low-J CO lines during the EoR, the average metallicity of galaxies is expected to be lower, and recent observational and theoretical work suggests that may be higher in low metallicity gas clouds (e.g. Genzel et al. 2012; Leroy et al. 2009; Narayanan et al. 2012). Larger naturally leads to a lower CO line flux density per unit mass of H2. The population of star-forming Ly emitters have typical star-formation rates of 5-10 yr-1. Their metallicities cannot be measured with current facilities (except possibly with ALMA, which is sensitive to redshifted FIR lines like [CII] and [NII]), although these are likely to have sub-solar metallicties given the timescales needed for metal enrichment (the Universe is 710 Myr old at ). Wagg et al. (2012b) obtained a sensitive GBT upper-limit on CO J=2-1 line emission in the Ly blob (LAB) ‘Himiko’ at . It is likely that the low expected metallicities of typical star-forming galaxy populations like the LABs and LAEs will mean that SKA1-MID band 5 surveys of CO J=1-0 line emission will only be sensitive to more massive and rare starburst galaxies (see Murphy et al. in this edition). The only high-redshift galaxy currently detected in molecular CO line emission at frequencies below 20 GHz is a gravitationally lensed star-forming submm galaxy at (Riechers et al. 2013). The surface density of similarly luminous quasar host galaxies detected in CO line emission at is 1 per 500 square degrees.
During SKA2, the situation would be improved by the expected order of magnitude increase in collecting area and extended frequency coverage up to 24 GHz (or 30 GHz, as proposed by Murphy et al. in this volume, who also present the science case for GHz extragalactic continuum studies). Such studies would be sensitive to CO J=1-0 line emission at ( for GHz), covering the epoch when massive galaxies should have formed their stars, likely in obscured bursts of star-formation. For the case of cold, quiescent gas at a kinetic temperature of 18 K in a galaxy, the prediction is that the measured flux density should be less than 25% of what would be measured in the absence of the CMB (Da Cunha et al. 2013b). For warm star-forming gas at K, one would measure 65% of the intensity at a redshift of . We expect that SKA2-MID should provide a powerful means of quantifying the cosmic evolution of the molecular H2 gas density over the epoch of massive galaxy formation.
3 Dense star-forming gas
Dense star-forming gas tracers such as HCN and CS hold the promise for future SKA studies of the high-redshift interstellar medium (ISM), as their emission lines directly probe sites of active star-formation with densities in excess of 104 cm-3. Although they are typically an order of magnitude fainter than the CO lines, the luminosity in the 88.6 GHz HCN J=1-0 line correlates linearly with infrared luminosity in star-forming gas over nearly eight orders of magnitude in luminosity (Gao & Solomon 2004; Wu et al. 2005). As such, emission from lines like HCN J=1-0 should be a good proxy for the total mass in dense molecular gas directly involved in ongoing star-formation activity. The HCN J=1-0 line traces gas at kinetic temperatures of 40 to 50 K in luminous infrared star-forming galaxies, much higher than the CMB temperature at redshifts below . Current cm-wavelength facilites lack the sensivity to detect HCN J=1-0 line emission at GHz in even the most luminous, known star-forming galaxies and quasar host galaxies. Previous attempts to detect low-J HCN line emission in galaxies have only been successful for a handful of lensed objects (Solomon et al. 2003; Vanden Bout et al. 2005; Carilli et al. 2005; Gao et al. 2007; Riechers et al. 2007), while high-J HCN line emission remains a promising tool for ALMA studies (Wagg et al. 2005; Weiss et al. 2007; Danielson et al. 2011). The HCO+ line may also hold promise as a dense gas tracer in high-redshift galaxies (e.g. Riechers et al. 2006; Garcia-Burillo et al. 2006), although the possible decrease in abundance of HCO+ in regions of high electron density has brought into question its effectiveness as a proxy for dense molecular gas mass in starburst galaxies (e.g Papadopoulos et al. 2007).
In the case of CS, the J=1-0 transition occurs at a rest frequency of 49 GHz, close to the atmospheric O2 line, which limits the sensitivity for surveys of CS line emission in the local Universe. CS is a more common tracer of dense star-forming cores in our Galaxy (e.g. Evans 1999), however it has not been widely studied in the high-redshift Universe given the sensitivity of current cm-wavelength instruments.
If band 5 were deployed on SKA1-MID, it would be sensitive to HCN J=1-0 and HCO+ J=1-0 line emission at and CS J=1-0 line emission at . An even greater advance will be made with the increased sensitivity and extended frequency coverage of SKA2, which should be an excellent facility for the study of low-J transitions of dense gas tracers in high-redshift galaxies. It would be the first interferometer capable of resolving the emission from the low-J dense gas tracers at redshifts between (roughly half the present-day age of the Universe), and to the end of the epoch of reionization at . In Section 5, we make predictions for the expected number of dense gas emitters that might be detected in future SKA1 and SKA2 spectral line surveys.
4 OH and H2O megamaser emission
Another potentially interesting probe of star-formation and the molecular ISM of high-redshift galaxies is redshifted emission from OH or H2O megamaser emission. Although it may be that the luminosity in the OH megamaser line is correlated with star-formation activity, this emission has not been detected in far-infrared luminous galaxies at high-redshift (e.g. Ivison 2006). Similarly, early searches for H2O megamasers at high-redshift (e.g. Wilner et al. 1999; Ivison 2006; Edmonds et al. 2009; Wagg & Momjian 2009), resulted in only a pair of detections at (Barvainis & Antonucci 2005) and (Impellizzeri et al. 2008). It is therefore difficult to predict the expected number density of these line emitters with the increased sensitivity of the SKA. Murphy et al. (this edition) discuss the use of H2O megamaser line emission for studying AGN at high-redshift.
5 Predictions for SKA spectral line surveys

For the purpose of predicting the expected detectability of molecular emission lines in future SKA observations, we first assume a -dominated cosmological model with , , and km s-1 Mpc-1. The standard definition of line luminosity is given by Solomon, Downes & Radford (1992), and we assume a linewidth, km s-1 throughout. For both SKA1 and SKA2, we consider two scenarios, one where targeted observations of known ultraluminous infrared galaxies (ULIRGs) are made ( L⊙, M⊙ yr-1), and a second where pointed deep field observations are conducted, sensitive to less luminous galaxies. In the latter case, we adopt the models of da Cunha et al. (2013a), who make empirical predictions for the observed molecular line properties of star-forming galaxies in the observed Hubble Ultra Deep Field (UDF). In the original models, the expected CO line luminosity is predicted from the infrared luminosity, and here we extend this prediction to HCN, HCO+, and CS which we convert from the CO J=1-0 line luminosity by adopting the relationship to dense gas tracer line luminosity measured by Gao & Solomon (2004).
For the purposes of SKA1 band 5 (4.6 to 13.8 GHz) predictions, we do not consider CO J=1-0 line emission at , due to the effects discussed in the previous section. ALMA observations of higher-J CO lines would be sensitive to the same star-forming molecular gas, while also benefitting from an increase in flux density that depends on . For targeted observations of HCN J=1-0 or CS J=1-0 line emission in ULIRGs at (HCN) or (CS), the expected peak flux density in both cases would be 1.5 Jy. A 5- detection of such a line would take 1000 hours of integration time with the full SKA1, or 4000 hours if SKA1 had 50% less sensitivity. Now considering predictions for blind surveys, Figure 2 shows the expected number density of CS J=1-0 line emitters as a function of flux density, where we also indicate the expected sensitity after 5000 hours with the full SKA1. In that case, one might expect to detect source per square arcminute over the field of view at the highest frequency end of the band.

SKA2 should enable a revolution in high-redshift molecular gas studies, not only because of the extended frequency coverage (up to 24 GHz), but also due to the increase from 190 to 2500 in the number of band 5 MID antennas. In assessing the potential for SKA2 studies, we only assume blank-field searches for molecular line emitting galaxies. We note that the expected rms in a 300 km s-1 channel after 1000 hours of on-source integration time is expected to be 24 nJy at frequencies above 10 GHz. Figure 3 shows the predictions for two tunings, each covering 5 GHz of bandwidth over the upper-end of SKA2-MID band 5. We only consider CO J=1-0 line emitters detected in the upper tuning (), when the emission from cold molecular gas is not expected to be dramatically effected by the CMB effects discussed previously. We note that at these redshifts metallicity evolution may have an impact on the detectability of CO line emission in galaxies with low metallicities. A deep integration covering the 19 to 24 GHz frequency range is expected to detect more than 50 CO line emitters per square arcminute. Such a survey would provide the first strong constraint on the evolution of the CO J=1-0 line luminosity function at .
6 Summary
The SKA has the potential to be a powerful facility for the detection and imaging of low-J transitions of molecular line emission in high-redshift galaxies. During SKA1, it could be possible to detect faint CS J=1-0 line emission associated with luminous infrared galaxies ( L⊙). At , HCN J=1-0 could be observed in order to quantify the total dense molecular gas mass in galaxies. Our models predict that with the increased sensitivity and frequency coverage of SKA2 extending up to 24 GHz, we expect to detect significant numbers of CO line emitters in blank-field surveys. Such galaxies may be significant contributors to the total star-formation rate density of the Universe at these early cosmic epochs.
References
- 1 Aravena, M., Carilli, C., Daddi, E., et al. 2010, ApJ, 718, 177
- 2 Aravena, M., Hodge, J. A., Wagg, J., et al. 2014, MNRAS, 442, 558
- 3 Barvainis, R., & Antonucci, R. 2005, ApJL, 628, L89
- 4 Bolatto, A. D., Wolfire, M., & Leroy, A. K. 2013, ARA&A, 51, 207
- 5 Carilli, C. L., & Rawlings, S. 2004, New Astronomy Reviews, 48, 979
- 6 Carilli, C. L., Solomon, P., Vanden Bout, P., et al. 2005, Astrophys. J. , (6) 18, 586
- 7 Carilli, C. L., Neri, R., Wang, R., et al. 2007, ApJL, 666, L9
- 8 Carilli, C. L., & Walter, F. 2013, ARA&A, 51, 105
- 9 Carilli, C. L., Riechers, D., Walter, F., et al. 2013, ApJ, 763, 120
- 10 Chary, R.-R., Stern, D., & Eisenhardt, P. 2005, ApJL, 635, L5
- 11 da Cunha, E., Walter, F., Decarli, R., et al. 2013a, ApJ, 765, 9
- 12 da Cunha, E., Groves, B., Walter, F., et al. 2013b, ApJ, 766, 13
- 13 Daddi, E., Dannerbauer, H., Elbaz, D., et al. 2008, ApJL, 673, L21
- 14 Daddi, E., Bournaud, F., Walter, F., et al. 2010, ApJ, 713, 686
- 15 Danielson, A. L. R., Swinbank, A. M., Smail, I., et al. 2011, MNRAS, 410, 1687
- 16 Dannerbauer, H., Daddi, E., Riechers, D. A., et al. 2009, ApJL, 698, L178
- 17 Decarli, R., Walter, F., Carilli, C., et al. 2014, ApJ, 782, 78
- 18 Di Francesco, J., Johnstone, D., Matthews, B. C., et al. 2013, arXiv:1310.1604
- 19 Downes, D., & Solomon, P. M. 1998, ApJ, 507, 615
- 20 Edmonds, R., Wagg, J., Momjian, E., et al. 2009, AJ, 137, 3293
- 21 Evans, N. J., II 1999, ARA&A, 37, 311
- 22 Gao, Y., & Solomon, P. M. 2004, ApJS, 152, 63
- 23 Gao, Y., Carilli, C. L., Solomon, P. M., & Vanden Bout, P. A. 2007, ApJL, 660, L93
- 24 García-Burillo, S., Graciá-Carpio, J., Guélin, M., et al. 2006, ApJL, 645, L17
- 25 Genzel, R., Tacconi, L. J., Combes, F., et al. 2012, ApJ, 746, 69
- 26 Impellizzeri, C. M. V., McKean, J. P., Castangia, P., et al. 2008, Nature, 456, 927
- 27 Ivison, R. J. 2006, MNRAS, 370, 495
- 28 Leroy, A. K., Bolatto, A., Bot, C., et al. 2009, ApJ, 702, 352
- 29 Maiolino, R., Cox, P., Caselli, P., et al. 2005, A&A, 440, L51
- 30 Narayanan, D., et al. 2012, MNRAS, 421, 3127
- 31 Obreschkow, D., Heywood, I., Klöckner, H.-R., & Rawlings, S. 2009, ApJ, 702, 1321
- 32 Papadopoulos, P. P., Röttgering, H. J. A., van der Werf, P. P., et al. 2000, ApJ, 528, 626
- 33 Papadopoulos, P. P. 2007, ApJ, 656, 792
- 34 Riechers, D. A., Walter, F., Carilli, C. L., et al. 2006, ApJL, 645, L13
- 35 Riechers, D. A., Walter, F., Carilli, C. L., & Bertoldi, F. 2007, ApJL, 671, L13
- 36 Riechers, D. A., Bradford, C. M., Clements, D. L., et al. 2013, Nature, 496, 329
- 37 Riechers, D. A., Carilli, C. L., Capak, P. L., et al. 2014, arXiv:1404.7159
- 38 Solomon, P., Vanden Bout, P., Carilli, C., & Guelin, M. 2003, Nature, 426, 636
- 39 Tacconi, L. J., Genzel, R., Neri, R., et al. 2010, Nature, 463, 781
- 40 Tacconi, L. J., Neri, R., Genzel, R., et al. 2013, Astrophys. J. , (7) 68, 74
- 41 Vanden Bout, P. A., Solomon, P. M., & Maddalena, R. J. 2004, ApJL, 614, L97
- 42 Venemans, B. P., McMahon, R. G., Walter, F., et al. 2012, ApJL, 751, L25
- 43 Wagg, J., Wilner, D. J., Neri, R., Downes, D., & Wiklind, T. 2005, ApJL, 634, L13
- 44 Wagg, J., Kanekar, N., & Carilli, C. L. 2009a, ApJL, 697, L33
- 45 Wagg, J., & Momjian, E. 2009b, AJ, 138, 895
- 46 Wagg, J., Carilli, C. L., Wilner, D. J., et al. 2010, A&A, 519, L1
- 47 Wagg, J., Wiklind, T., Carilli, C. L., et al. 2012a, ApJL, 752, L30
- 48 Wagg, J., & Kanekar, N. 2012b, ApJL, 751, L24
- 49 Walter, F., Bertoldi, F., Carilli, C., et al. 2003, Nature, 424, 406
- 50 Walter, F., Carilli, C., Bertoldi, F., et al. 2004, ApJL, 615, L17
- 51 Walter, F., Decarli, R., Sargent, M., et al. 2014, ApJ, 782, 79
- 52 Wang, R., Carilli, C. L., Neri, R., et al. 2010, ApJ, 714, 699
- 53 Wang, R., Wagg, J., Carilli, C. L., et al. 2013, ApJ, 773, 44
- 54 Weiß, A., Downes, D., Neri, R., et al. 2007, A&A, 467, 955
- 55 Willott, C. J., Omont, A., & Bergeron, J. 2013, ApJ, 770, 13
- 56 Wilner, D. J., Bourke, T. L., Ho, P. T. P., Killeen, N. E. B., & Calabretta, M. 1999, AJ, 117, 1139
- 57 Wu, J., Evans, N. J., II, Gao, Y., et al. 2005, ApJL, 635, L173