Network Evolution by Relevance and Importance Preferential Attachment
Abstract
Relevance and importance are the main factors when humans build network connections. We propose an evolutionary network model based on preferential attachment(PA) considering these factors. We analyze and compute several important features of the network class generated by this algorithm including scale free degree distribution, high clustering coefficient, small world property and core-periphery structure. We then compare this model with other network models and empirical data such as inter-city road transportation and air traffic networks.
1 Introduction
For many complex networks in society, it is arguable that the Relevance and the Importance are the two main factors influencing how new network connections are formed in existing dynamic networks. One typical scenario is in scientific research and the publication process. In choosing references, authors are more likely to cite articles with high impact(importance) and also those using similar method or discussing relevant issues(relevance). Another example is in the design and organic growth of intercity transportation networks. Traffic engineers and city designers prefer to connect a given city to big cities with high connectivity(importance) but also want to reduce the expense by giving priority to the connections between nearby cities(relevance). Complex networks involving both relevance and importance also include aspects of the World Wide Web(WWW) and many social networks. An interesting and ironic point is that people are still striving to understand the properties of these complex networks which are largely man-made. As a related point, we emphasize that the network evolutions studied here are governed by a distributed decision- making system rather than centrally organized. For each agent in the networks that makes local decisions, the rule of adding or deleting links may be simple and clear. Intuitively, the complexity of the networks arise from some other reasons such as cooperative and bulk properties of large systems consisting of many similar subunits. While this complexity is not explicit in the local design rules and is often beyond total control of the network designers, human society nonetheless seek to understand and manage this complexity. Hence, the current scientific and technological interests in studying the origins and properties of these dynamic complex systems. In this paper, we suggest that one of the origins of this complexity is an underlying metric space defining the Relevance structure which we will introduce and discuss in detail later.
In the past few decades, several evolutionary network models have been proposed with respect to one or both of the two factors, importance and relevance. For importance alone, the most famous model is invented by Barabasi, Albert, known as BA network model[2] or ``preferential attachment''(PA) algorithm. The standard preferential attachment starts with a network with vertices and edges. New vertex is successively added and attached to preexisting vertices. The probability of attaching to a vertex is proportional to its degree . This algorithm will naturally generate the network with power-law degree distribution with . There are many variations of the PA algorithm in the literature[6, 7, 9], all of which have the relevant complexity. From this, we conclude that the preferential attachment to high degree nodes, i.e. the ``rich get richer'' effect, is the essential reason for the emergence of scale free degree distribution.
There are also well known network models based on the relevance. The simplest evolutionary model considering the relevance is the Random Geometric Graph(RGG). In this model, we successively add vertices at random locations in a unit square, and link each new vertex to all the nearby vertices within a given radius . Here the relevance is measured by the geometric distance. Another model considering the relevance is given in [8], in which the relevance is given by a hierarchical structure and tree distance. According to these models, we find the most natural way to measure the relevance is to suggest an underlying metric space. We will show later in this paper that how this metric space affects the global properties of the network. Due to the triangle inequality in metric spaces, the corresponding relevance relationship satisfies that any two objects relevant to the same one should also be relevant each other. Therefore, network models based on the relevance often have high clustering coefficients. The other way of thinking the relevance structure of the complex networks is to use geometric embedding[12, 17, 11] which is not to provide an evolutionary model but to find the most suitable underlying metric space for the known network.
Motivated by these network models, we propose an evolutionary network model with appealing properties that takes the both two factors into consideration. Our model is based on the preferential attachment. But beside the preferential attachment to the high degree nodes, we also suggest the preferential attachment to nearby nodes under a given metric space. Later in this paper, we will introduce our Relevance and Importance Preferential Attachment(RIPA) model given by an evolution process, analyze several network properties, and compare this model with other network models and some empirical data.
2 Model
In this section we will describe the algorithm called Relevance and Importance Preferential Attachment(RIPA) which generates a class of complex networks. The RIPA, similar to the classical preferential attachment, starts with a initial network with vertices and edges. A new vertex is attached to other vertices with the probability depending on the importance and relevance of those vertices.
In RIPA, the importance of a vertex is valued by its degree as in the classical preferential attachment, and the relevance is given by a metric space . We denote distance between two elements by . Then , the relevance between them, is defined as a non-increasing function of the distance ,
satisfying and . A typical example is , but can also have a power-law tail.The centrality defined below measures the general influence of an element on the whole space.
| (1) |
Centrality actually gives, in another sense, an ``importance'' according to the position in the underlining metric space instead of the connectivity to other vertices. In the scenario of the between-city transportation, centrality measures the physical geographical transportation condition of a position. In the scenario of scientific research, a research topic has high centrality means it is a bridge of many other fields and therefore is important by itself regardless how it is recognized by citations. Later in this paper, we will investigate some cases on the metric spaces with constant centrality . Examples are: (1)square with periodic boundary condition, (2) sphere in 3-d space In these spaces, there is no ``center'' position and every element is at an equivalent place.
A further restriction here for the relevance and hence is that the integral in Eqn. (1) should be well-defined. This restriction is fairly important especially when we consider the large network limit.
In the RIPA, a new vertex is attached to the preexisting vertex by the probability
Here is the degree of indicating the importance and is the relevance between . is the normalization constant so that . is defined as a function on called local partition by
The summation here goes over all existing vertices. A particular position with higher local partition has more overall relevance to previous vertices, therefore may attract more interest of a new vertex. So we suggest , the probability of emergence of a new vertex at , is proportional to ,
where is the global partition function
In a metric space with constant centrality, we further have where is the total number of degree in the network and grows linearly with time .
We summarize the algorithm of RIPA as follows:
-
•
1. Begin with a network with nodes.
-
•
2. For to
2.1 Add a new node at the position with probability
2.2 Attach to preexisting nodes with probability
The expected change of the degree of the vertex is given by
The above equation shows that the degree of a vertex grows at a expected speed proportional to the current degree which is exactly the relation we have in standard preferential attachment algorithm. Therefore we derive the stable degree distribution using the same approach for standard PA and obtain the following theorem:
Theorem: With arbitrary metric space and initial network, the network generated by RIPA has the power-law degree distribution with as .
Besides, the change of the local partition comes from two parts: the growth of degrees of the existing vertices and the new vertex. When the centrality is constant , we have
Here is considered as an average of in the neighborhood of by the weight function . The above equation can be rewritten as
On the right hand side, the first term is respect to exponential growth tending to generate a scale free distribution of , the second term is a diffusion term which will smooth the distribution of .
Several previous models can be more or less considered as special cases of our model. By selecting the trivial metric space, a singleton, our model becomes the standard BA model. On the unit square with the Euclidean metric, taking the relevance function
we obtain the RGG model. On the tree(graph) as a discrete metric space with the standard tree distance, we obtain the Community Guided Attachment(CGA) model[8]. In this paper, we mainly investigate the case on the 2-D surface with the Euclidean metric and power-law or exponentially decreasing relevance function.
Next we will discuss several important properties of the RIPA network model. Although there is no rigorous definition of complex networks, many people consider the following three are the typical properties of complex networks: power-law degree distribution (scale free), high clustering coefficient (clustering), short average path-length (small world). A lot of efforts have been made to find network models which capture these properties. The following table summarizes the properties of several known network models. (ER stands for Erdos CRenyi model[1], BA stands for Barabasi CAlbert model[2], RGG stands for Random Geometric Graph[4], WS stands for Watts-Strogatz model[3], RAN stands for Random Apollonian network[10].)
| Network Model | scale free | clustering | small world |
|---|---|---|---|
| ER | |||
| BA | |||
| RGG | |||
| WS | |||
| RAN | |||
| RIPA |
Till now, not many network models satisfactorily capture all of the three typical properties. Some network models like Random Apollonian Network(RAN) do, but is totally artificial without revealing the mechanism from which all the properties of the real world networks come. The RIPA model we proposed here have all of the three properties under certain conditions, and at the same time provides a natural reasoning of these properties. Further more, it also has a core-periphery structure which is an important feature of some real world networks like the world airline network (WAN).
3 Equivalent model
In this section, we propose an equivalent model of RIPA called Relevance and Importance Branching Process (RIBP). This model is useful in analyzing some important network properties, especially the degree-degree correlation. RIBP is a random process with continuous time variable . Each node undergoes an independent Poisson process with rate . . When has an increment at time , the node will generate a children node at a random position which satisfies the distribution . Attach to , and also to other nodes as the way in RIPA. To compare these two models, we set the relationship between the time variables as
For RIBP, there is a 1-1 map between the network state and the time variable as given above, therefore this setting is well defined. We only care about the updates of the network state, so we can rewrite the algorithm of RIBP as follows:
-
•
1. Begin with a network with nods.
-
•
2. For to
2.1 Pick a node as the generator with probability .
2.2 Locate the new node at the position with probability , and attach to .
2.3 Attach to preexisting nodes with probability
The crucial difference between RIBP and RIPA lies in the arrival of new nodes. For RIPA, the arrival of new nodes follows a global probability distribution which is affected by all the existing nodes and thus is very complicated. For RIBP, the arrival of of new nodes is more like what happened in some private clubs: the membership of a new guest requires the invitation of an existing member and there is a default social link between the new member and his/her inviter. The RIBP is more parallelizable because each existing node invites new nodes to join the network independently and the location of the new node is only affected by its inviter. Therefore, compared to RIPA, the RIBP is much easier to implement and analyze. As we will show below, by carefully choosing the rate of the invitation for each node, we build up the RIBP which is essentially a different stochastic process from RIPA but generate the same random network ensemble.
Let denote the two random processes of evolutionary networks generated by RIPA and RIBP respectively. We define the equivalence of the two models as:
If at time , , then and as random networks have the same probability measure at .
To prove the equivalence we only need to show that, given , for any , the two probabilities are equal
For simplicity, we first consider the case. Without loosing any generality, let be the state that the next new node locates at and attaches to the node . Therefore
More generally, when , is the state that the next new node locates at and attaches to the nodes .
To calculate , we first consider the case that is the generator. The probability for this case is
Sum up the probabilities of all such cases, we have
When , it is easy to show that all the degrees 's are independent by construction. When , the degrees are correlated and then we will analyze the degree-degree correlation at fixed time .
At time step , we calculate the probability for the new node attach to node and at the same time.
As a baseline, we also calculate the probability for the same event under the assumption that , are independent.
implies the correlation between and . When , and are correlated; When , and are anti-correlated.
According to the above formula, we conclude that degrees of two nodes can be anti-correlated due to the following two reasons:
1. The two nodes are far apart such that and are anti-correlated, i.e. relevant to one means irrelevant to the other.
2. The two nodes are separated by a high area, hence the new nodes relevant to the both are very likely to be distracted by the nodes in between.
4 Between-city transportation
In this section we focus on RIPA on 2-dimensional surface with respect to the case of between-city transportation. First, we consider networks generated by RIPA on the unit square with periodic boundary conditions. The relevance is given by . In this case the total partition function is:
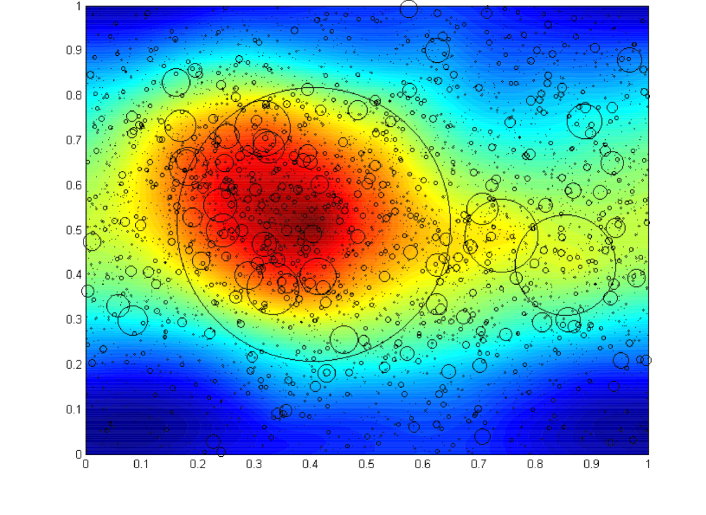
Figure 1 represents a special realization of the network. Each circle in the figure represents a city, the center of the circle indicates the locations of the city and the radius indicates the degree, the color(brightness) in the background indicates the logarithm of the local partition function . In Fig.1, we observe a phenomenon that cities tends to gather but big cities tends to separate. For example, around the greatest city (the capital), we can find bigger city in the area further from the capital. This is because a huge city has two effects: (1) the local partition in its neighbor area is bigger therefore attract more new cities, (2)it will attract more links from new cities therefore inhibit the nearby cities to grow. The second effect is the most significant when we choose small .
Next, we will investigate the properties of the RIPA network model one by one in this special case, and compare this network model with the BA network and the world airline network (WAN)[14]. The later is an empirical network from openfights.org.
4.1 Degree distribution
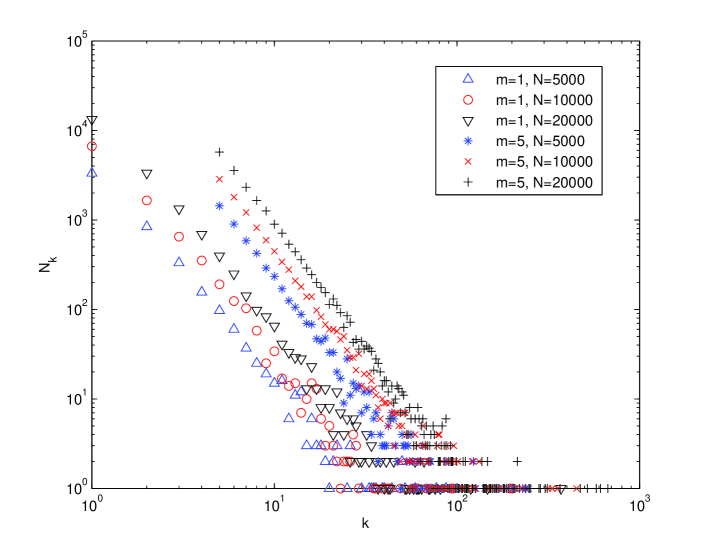
Fig. 2 shows that the power-law degree distribution of the RIPA network. As analyzed before, the degree distribution is . is the number of vertices with the degree . The index as the same as in the BA network model.
4.2 Clustering Coefficient
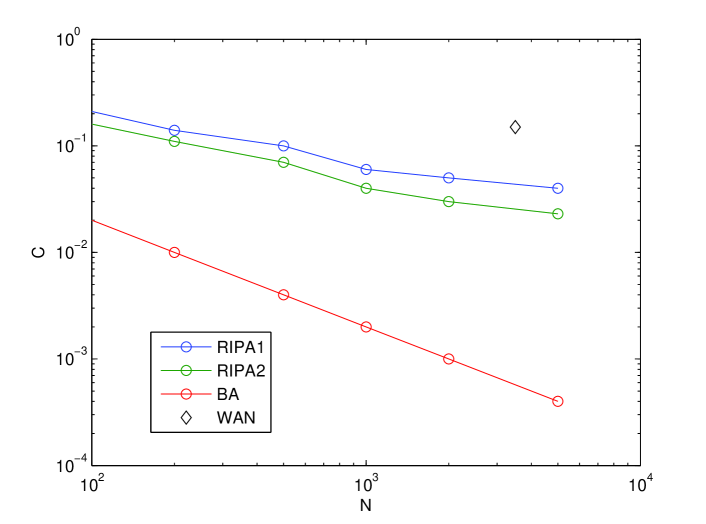
The clustering coefficient quantifies how well connected are the neighbors of a node in a network. Network models considering the relevance usually has higher clustering coefficient than purely random networks. This is because the relevance is naturally transitive, i.e. two objects relevant to the same thing are more likely to be relevant to each other. Consequently, the RIPA network has a significant higher clustering coefficient then the ER or BA networks. Fig.3 shows the clustering coefficients of the RIPA network, the BA network and the WAN network[14].
5 Average path-length
In the area of complex networks, we say a network is a ``small world'' if the average path-length of two arbitrary nodes in the network is no more than the order as the network size grows. There are two different large limits of this network model. One is the non-extensive limit, for which the metric space keeps the same and the density of nodes increases to infinity. The other is the extensive limit, for which the density of nodes keeps the same and the metric space extends to infinity. In the latter case, an equivalent way is to keep the metric space the same and rescale the metric. For instance, on the unit square, the metric should be rescaled as , so that the average density of nodes keeps constant as grows.
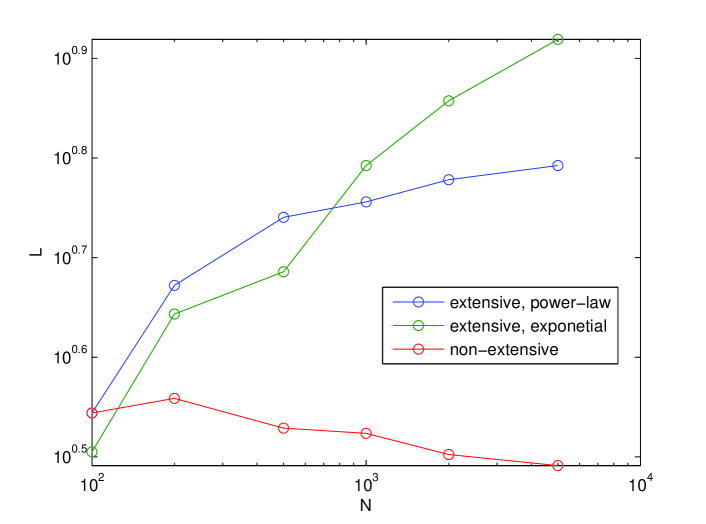
According to Fig.4, the RIPA under non-extensive limit is always a small world. The average path-length even lightly decays as grows. This observation can be interpreted as the transportation in a fixed area becomes more convenient when you have more choices of transition points. We also observe that the RIPA under extensive limit is a small world when the relevance function has the power-law decay (), but is not when has a exponential decay (). From the physics aspect, the two relevance functions are analogues of long-range and short-range correlations. So this observation can be concluded as the RIPA network is a small world when the relevance function represents a long-range correlation.
The following theorem give a criterion when the RIPA network on two-dimensional space is not a small world.
Theorem: The network is not a small world network if the
| (2) |
Proof: First, we show that the probability distribution of , the length of the links, is proportional to . For a fixed vertex at the location at arbitrary time step, consider the length of the next link attached to it. Ignoring the boundary effect of the two dimensional space (for unit square it means ), the probability that the new vertex appears at which is apart from with the distance and attaches to the vertex is
where is the circle centered at with radius . Since for all of the preexisting vertices, the distribution of the length of the next new link is the same, so is the overall length distribution of the next new link at arbitrary time step. So except for the initial links which can be neglected in the large N limit, the length distribution is proportional to .
Then we divide the two-dimensional space into blocks with edge length . In the extensive large limit, the density of vertices keeps constant, so the expected number of links which is attached to the given block and longer than is . If Eqn. (2) holds, for big enough , the probability to find a link longer than in a given block can be controlled by arbitrarily small , i.e. with probability one can only move to its neighboring blocks by one step along the path. Therefore, the shortest path length between two vertices with distance is lower bounded by which obviously is not a small world. Similar criterion is easy to establish for space.
6 core-periphery structure
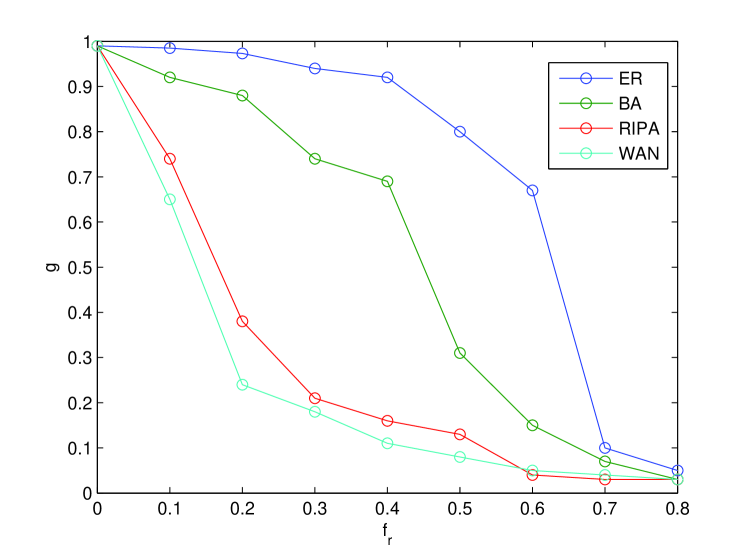
Core-periphery structure is observed in several real world complex networks[23, 15]. In the network with such kind of structure, there is a subnetwork called ``core'' which is tightly connected, and the complementary subnetwork, the periphery, are fragmental and mostly attached to the core. A significant feature of the core-periphery structure is that the network is vulnerable to the attacks on the core[15]. By successively removing nodes from the core, the whole network will quickly fall into several disconnected parts. The Fig.5 shows how the giant cluster size decreases as the nodes are removed in the descending order of the degrees. As shown in the figure, the BA network has hubs therefore are more vulnerable to the attacks on the high degree nodes than the ER networks, but it still has a high threshold (about in the figure) when the giant cluster size has a fast decay. For RIPA and WAN, however, the giant cluster sizes both decrease quickly at the very beginning. So the RIPA network model captures the core-periphery structure as in the WAN network.
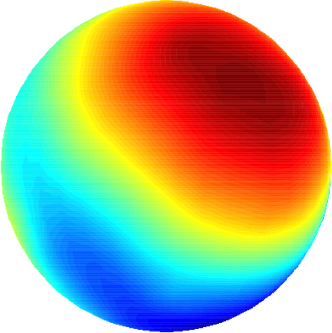
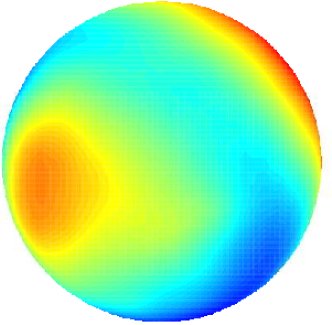
6.1 RIPA on the Sphere
Similarly, we implement the RIPA on the sphere where the metric is given by spherical distance. As shown in Fig.6, the . Interestingly, some qualitative behavior is quite stable in the simulations, eg. the spherical angle between the first two largest hubs are usually around . However, this network is still quite far from the case of the earth. On the earth, city can only locate on the continents, and the metric is not uniform. The oceans, rivers and mountains may affect the effective distance.
7 Discussion
In this paper we investigate a very simple case, RIPA on two dimensional space, corresponding to the scenario of the between-city transportation. WAN fits this case best, since for airlines the relevance of two cities are mainly decided by the geographic distance. But obviously there are other factors affect the relevance of two cities, e.g. the cities belonging to two different countries should have weaker relevance than those of the same country.
For other cases, the underlying metric space of relevance may be even more complicated and hard to describe. For example, in the social networks, the relevance between individuals may involve the geographic distance, the cultural difference, the social stratification, the political stands and so on. Further, this metric can be changed by the development of technologies in transportation and communication. However, previous studies of social networks have shown some evidence for the existence of the underlying metric space[21, 22]. In conclusion, the underlying metric space of the relevance is the main source of the network complexity. Although it is usually hard to give a full description of the metric space in the real world cases, analyzing different metric space and their corresponding RIPA networks will help us to understand the global structure of real world networks.
Acknowledgment
This work was supported in part by the Army Research Laboratory under Cooperative Agreement Number W911NF-09-2-0053, by the Army Research Office Grant Nos W911NF-09-1-0254 and W911NF-12-1-0546, and by the Office of Naval Research Grant No. N00014-09-1-0607. The views and conclusions contained in this document are those of the authors and should not be interpreted as representing the official policies either expressed or implied of the Army Research Laboratory or the U.S. Government.
References
- [1] Erdos, P.; Renyi, A. (1960). "On the evolution of random graphs". Publications of the Mathematical Institute of the Hungarian Academy of Sciences 5: 17-61.
- [2] Barabasi, Albert-Laszlo; Albert, Reka (1999). "Emergence of scaling in random networks". Science 286 (5439): 509-512.
- [3] Watts, Duncan J.; Strogatz, Steven H. (1998). "Collective dynamics of 'small-world' networks". Nature 393 (6684): 440-442.
- [4] Penrose, Mathew: Random Geometric Graphs (Oxford Studies in Probability, 5), 2003.
- [5] De Masi, Giulia; et. al (2006). "Fitness model for the Italian interbank money market". Physical Review E 74: 066112.
- [6] Dangalchev Ch., Generation models for scale-free networks, Physica A 338, 659 (2004).
- [7] S. Fortunato, A. Flammini, F. Menczer, Scale-free network growth by ranking, Phys. Rev. Lett. 96(21):218701 (2006).
- [8] J Leskovec, J Kleinberg, C Faloutsos(2005). Graphs over Time: Densification Laws, Shrinking Diameters and Possible Explanations. Proceedings of the eleventh ACM.
- [9] Alejandro F. Rozenfeld, Reuven Cohen, Daniel ben-Avraham, and Shlomo Havlin(2002). "Scale-Free Networks on Lattices". PRE. VOLUME 89, NUMBER 21.
- [10] Tao Zhou Gang Yan and Bing-Hong Wang. Maximal planar networks with large clustering coefficient and power-law degree distribution
- [11] D. Krioukov, F. Papadopoulos, M. Kitsak, A. Vahdat, and M. Boguna, Hyperbolic Geometry of Complex Networks, Physical Review E, v.82, 036106, 2010
- [12] Daniel ben-Avraham, Alejandro F. Rozenfeld, Reuven Cohen, Shlomo Havlin. Geographical Embedding of Scale-Free Networks
- [13] Albert-Laszlo Barabasi, Zoltan Dezso, Erzsebet Ravasz, Soon-Hyung Yook and Zoltan Oltvai. Scale-free and hierarchical structures in complex networks
- [14] T. Verma, N. A. M. Arujo. and H. J. Herrmann. Revealing the structure of the world airline network.
- [15] M. PUCK ROMBACH, MASON A. PORTER, JAMES H. FOWLER, AND PETER J. MUCHA. "CORE-PERIPHERY STRUCTURE IN NETWORKS". SIAM J. APPL. MATH. Vol. 74, No. 1, pp. 167 C190.
- [16] Paolo Crucitti, Vito Latora, Massimo Marchiori, Andrea Rapisarda (2004). "Error and attack tolerance of complex networks". Physica A: Statistical Mechanics and its Applications. Vol. 340, Issues 1 C3, 388-394.
- [17] J. Janssen, P. Pralat, R. Wilson, Estimating node similarity from co-citation in a spatial graph model, In: Proceedings of 2010 ACM Symposium on Applied Computing-Special Track on Self-organizing Complex Systems, 5pp.
- [18] D. Liben-Nowell, J. Novak, R. Kumar, P. Raghavan, A. Tomkins, Geographic routing in social networks, Proceedings of the National Academy of Sciences 102 (2005) 11623-11628.
- [19] A. Barrat, M. Barthelemy , R. Pastor-Satorras and A. Vespignani. The architecture of complex weighted networks. PNAS vol. 101 no. 11 3747-3752(2004).
- [20] Anthony Bonato, Jeannette Janssen, Pawel Pralat. A Geometric Model for On-line Social Networks.Proceeding MSM '10 Proceedings of the International Workshop on Modeling Social Media. No. 4 (2010).
- [21] J. Travers and S. Milgram, An experimental study of the small world problem, Sociometry, vol. 32, pp. 425 C443, 1969.
- [22] J. Kleinberg, Navigation in a small world, Nature, vol. 406, p. 845, 2000.
- [23] Peter Csermely, Andras London, Ling-Yun Wu, Brian Uzzi. Structure and dynamics of core/periphery networks. Journal of Complex Networks (2013) 1, 93-123.