Examining the Infrared Variable Star Population Discovered in the Small Magellanic Cloud Using the SAGE-SMC Survey
Abstract
We present our study on the infrared variability of point sources in the Small Magellanic Cloud (SMC). We use the data from the Spitzer Space Telescope Legacy Program “Surveying the Agents of Galaxy Evolution in the Tidally Stripped, Low Metallicity Small Magellanic Cloud” (SAGE-SMC) and the “Spitzer Survey of the Small Magellanic Cloud” (S3MC) survey, over three different epochs, separated by several months to three years. Variability in the thermal infrared is identified using a combination of Spitzer‘s IRAC 3.6, 4.5, 5.8, and 8.0 m bands, and the MIPS 24 m band. An error-weighted flux difference between each pair of three epochs (“variability index”) is used to assess the variability of each source. A visual source inspection is used to validate the photometry and image quality. Out of 2 million sources in the SAGE-SMC catalog, 814 meet our variability criteria. We matched the list of variable star candidates to the catalogs of SMC sources classified with other methods, available in the literature. Carbon-rich Asymptotic Giant Branch (AGB) stars make up the majority (61%) of our variable sources, with about a third of all of our sources being classified as extreme AGB stars. We find a small, but significant population of oxygen-rich AGB (8.6%), Red Supergiant (2.8%), and Red Giant Branch (1%) stars. Other matches to the literature include Cepheid variable stars (8.6%), early-type stars (2.8%), young-stellar objects (5.8%), and background galaxies (1.2%). We found a candidate OH maser star, SSTISAGE1C J005212.88-730852.8, which is a variable O-rich AGB star, and would be the first OH/IR star in the SMC, if confirmed. We measured the infrared variability of a rare RV Tau variable (a post-AGB star) that has recently left the AGB phase. Fifty nine variable stars from our list remain unclassified.
1 Introduction
Variability is a common feature of many astronomical objects, among which are pulsating stars, disks around Young-Stellar Objects (YSOs), accreting binary systems, and Active Galactic Nuclei (AGNs). The processes behind variability phenomenon are diverse: they range from sporadic changes in the accretion rate of YSO and AGN disks (see Flaherty et al., 2012 and Peterson et al., 2000, respectively) to the periodic variations of the opacity and ionization states in pulsating stars’ interiors (Ita & Matsunaga 2011; Matsunaga et al. 2011; Madore et al. 2009). Monitoring the brightness variations induced by these processes is a powerful probe to understanding the underlying physical nature of sources.
Systematic long term variability monitoring has been conducted at visible wavelengths since the beginning of the 20th Century, especially following the discovery of the Cepheid Period-Luminosity relation (Leavitt & Pickering, 1912). More recently, the advent of space-based infrared observatories extended these studies to the thermal infrared. At thermal infrared wavelengths emission is mainly due to warm astronomical dust heated by stellar sources or accretion processes. Infrared variability studies offer a unique window to characterize the temporal variations in stellar mass loss and accretion. Indeed, data from the InfraRed Astronomical Satellite (IRAS) and the Infrared Space Observatory (ISO), have been used to correlate the pulsation properties and mass loss rates of evolved stars (e.g., van der Veen & Habing 1990; Omont et al. 1999; Whitelock et al. 1991), as well as the properties of disk accretion in optically variable YSOs (e.g., Juhász et al. 2007; Ábraham et al. 2004). These pioneering studies were, however, limited to bright isolated objects in the Galaxy due to the low sensitivity and spatial resolution of the available thermal infrared instrumentation.
The Spitzer Space Telescope (Werner et al., 2004) and the Wide-field Infrared Survey Explorer (WISE; Wright et al. 2010) for the first time provided the sensitivity required to repeatedly survey large areas of the sky to register the temporal variations of mid-IR sources. The observing strategy of the WISE mission, in particular, allowed the satellite to scan across each object in the sky at least 12 times every 90 minutes. The time series photometry obtained by this observatory are available as part of the recently released AllWISE catalog and have been used to characterize the light curves of short period variables sources in the Galaxy (e.g., Klein et al. 2014). Spitzer, which operates as a facility telescope, allows monitoring with arbitrary timescales, constrained only by on-sky visibility as the observatory orbits around the Sun. Spitzer’s superior sensitivity and angular resolution (as good as 2 arcsec, a factor of three better than WISE) opened the possibility of monitoring the infrared variability of stars and disks in crowded areas like star forming regions in the plane of the Galaxy (e.g., Giannini et al. 2009), globular clusters in the Galactic halo, and the stellar population of the Galactic bulge (e.g., the ongoing Spitzer Carnegie RR Lyrae Program, monitoring stellar variability in 31 Galactic clusters and the bulge). Implementing Spitzer as a research telescope also rendered Local Group galaxies accessible for variability studies at infrared wavelengths.
The Spitzer Legacy Programs “Surveying the Agents of a Galaxy’s Evolution” (SAGE; Meixner et al. 2006) and “Surveying the Agents of Galaxy Evolution in the Tidally Stripped, Low Metallicity Small Magellanic Cloud” (SAGE-SMC; Gordon et al. 2011a), in particular, are ideally suited for studying the infrared variable population in the Magellanic Clouds, two of the closest Milky Way satellites. The scientific goals of these two surveys focus on the life cycle of baryonic matter as traced by dust emission, from its start in the Interstellar Medium (ISM) where new stars form, to the chemical enrichment of the ISM by the dusty winds of evolved stars. The two programs imaged the Magellanic Clouds with both the InfraRed Array Camera (IRAC; Fazio et al. 2004) 3.6, 4.5, 5.8, and 8.0 m bands, and the Multiband Imaging Photometer for Spitzer (MIPS; Rieke et al. 2004) 24, 70, and 160 m bands. Each galaxy was mapped twice in those surveys, allowing the detection of infrared variability over timescales roughly commensurable to the separation (several months to three years) between the two epochs. An analysis of the SAGE Large Magellanic Cloud (LMC) data was presented in Vijh et al. (2009). Using the IRAC 3.6–8.0 m and MIPS 24 m data they found 2000 variable sources (out of over 4 million point sources in the SAGE catalog), the majority of which (87%) were identified as evolved stars in the Asymptotic Giant Branch (AGB) phase. A small population of variable YSO candidates was also detected by Vijh et al. (2009).
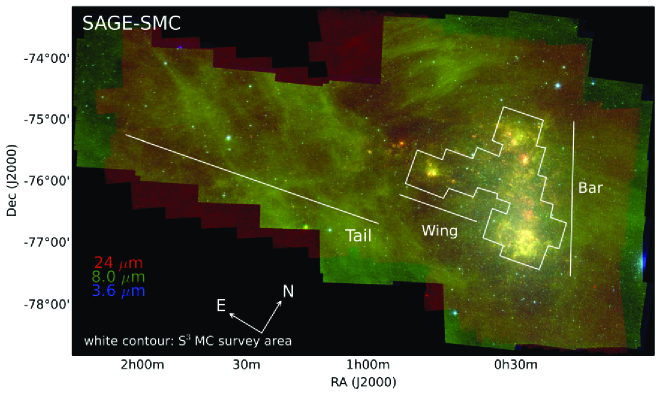
In this work, we focus on the SMC, following a similar approach to that developed by Vijh et al. (2009). The SMC, with a distance of 61 kpc (Haschke et al., 2012; Hilditch et al., 2005), is characterized by an even lower metallicity than the LMC (1/5 solar vs. 1/2 solar; Russell & Dopita 1992; Rolleston et al. 1999, 2003; Lee et al. 2005), below the threshold, where the properties of the ISM are expected to drastically change, as traced by the low dust mass fraction (Engelbracht et al., 2005; Draine et al., 2007; Sandstrom et al., 2010). The morphology of the SMC is characterized by a pronounced “Bar” with a “Wing”, and an extended “Tail” pointing toward the LMC (see Figure 1). The latter structure is part of what is generally known as the Magellanic Bridge, the H i filament connecting SMC with the LMC (e.g., McGee & Newton 1986). The Magellanic Bridge is a clear manifestation of the tidal interaction between the two galaxies and of a possible close encounter 200 Myr ago (Zaritsky & Harris, 2004; Harris, 2007). The SAGE-SMC observations covered the full SMC including the Bar, Wing, and the Tail. We have supplemented this data with the pathfinder “Spitzer Survey of the Small Magellanic Cloud” (S3MC; Bolatto et al. 2007), to provide a third epoch photometry for the portion of the SMC Bar and Wing. While the SMC has been extensively monitored for optical variability as part of the MAssive Compact Halo Objects Project (MACHO; Alcock et al., 1997) and Optical Gravitational Lensing Experiment (OGLE-III; Udalski et al., 2008) microlensing experiments, this work is the first extensive survey of the SMC searching for variability at thermal infrared wavelengths.
This paper is organized as follows. In Section 2, we describe the Spitzer SAGE-SMC and S3MC point source catalogs, as well as other optical and infrared data we used to identify and characterize the SMC variables. Section 3 outlines our methods for selecting and validating candidate variable sources. In Section 4, we compare the list of SMC variables to SMC sources classified with other methods, available in the literature. The demographics of the variables identified in this study is then discussed in Section 5, and a summary of our findings is given in Section 6.
2 The Data
We utilized the data taken in three separate epochs with Spitzer during the cryogenic mission using the IRAC 3.6, 4.5, 5.8, and 8.0 m bands, and the MIPS 24 m band. As mentioned before, the data were collected as part of the SAGE-SMC and S3MC surveys:
-
1.
The Surveying the Agents of Galaxy Evolution in the Tidally Stripped, Low Metallicity Small Magellanic Cloud (SAGE-SMC; Gordon et al. 2011a) mapped the SMC in all IRAC (3.6, 4.5, 5.8, and 8.0 m) and MIPS (24, 70, and 160 m) bands in two separate epochs, which we identify as Epoch 1 and Epoch 2 for the remainder of this paper. These two epochs are separated by 3 months (IRAC, data obtained in June and September 2008) and 9 months (MIPS, acquired in September 2007 and June 2008), respectively. The observations covered the full SMC, including the Bar, Wing, and part of the Magellanic Bridge (the Tail; see Figure 1), for a total coverage of 30 deg2.
-
2.
The Spitzer Survey of the Small Magellanic Cloud (S3MC; Bolatto et al. 2007) only mapped the Bar and Wing of the SMC (8 times smaller coverage than SAGE-SMC, for a total of 4 deg2; see white contour in Figure 1) in one single epoch (November 2004 for MIPS and May 2005 for IRAC), preceding the SAGE-SMC survey by about 3 years. The S3MC IRAC (3.6–8.0 m) and MIPS (70–160 m) data were reprocessed using the SAGE-SMC pipeline as Epoch 0 data, providing a consistently reduced data set for all three epochs. In the following we refer to the reprocessed S3MC data as Epoch 0.
The SAGE-SMC survey provides two catalogs containing the sources’ photometry for individual epochs, i.e. the IRAC Catalog and the IRAC Archive (see Gordon et al. 2011b). For our study, we selected the more reliable Catalog over the Archive, favoring detection reliability and photometric accuracy over completeness. Similarly, we adopted the more restrictive MIPS 24 m Catalog over the more complete, but less reliable Full List (Gordon et al., 2011b). The IRAC Catalog contains 217,000, 1.23 million, and 1.13 million sources in Epoch 0, Epoch 1, and Epoch 2, respectively. The MIPS 24 m Catalog includes 5,600 Epoch 0, and 16,500 Epoch 1 and 2 sources. We did not use photometry from the MIPS 70 and 160 m bands due to the lower spatial resolution (18′′ and 40′′, respectively) relative to the shorter wavelength data. The IRAC and MIPS 24 m data have angular resolution of 17–2′′ and 6′′, respectively. The Epoch 0 IRAC photometry has a limiting sensitivity of 0.045, 0.028, 0.12, and 0.10 mJy in the IRAC 3.6, 4.5, 5.8, and 8.0 µm bands, respectively. The sensitivity of the Epoch 1 and 2 is about a factor of two lower due to the shorter integration time. The MIPS 24 µm sensitivity is instead similar in the three epochs, and is 0.7 mJy.
In addition to the source catalogs, our study also uses the SAGE-SMC Epoch 0–2 IRAC and MIPS 24 m images for source quality validation.
The MIPS data were consistently taken before the IRAC data with a period of no less than three months between observations. The MIPS and IRAC data were taken at different times within each epoch, which can allow us to use the data from MIPS to confirm a source detected as variable based on the IRAC data on a different temporal cadence. Table 1 provides information about when the data were taken by IRAC and MIPS for each epoch. The longest time between observations with IRAC and MIPS is nine months in Epoch 1, contrasted to the shortest time of three months in Epoch 2. Epoch 0 IRAC and MIPS data were taken six months apart from each other, but the time gap between Epochs 0 and 1 is nearly three years.
The time interval between the different measurements is the main limiting factor to the typical period of the sources that we are able to detect in our dataset. The detectability of a source as a variable will depend on how well the sampling of the light curve matches the period of variability: our study is most sensitive to sources which our instruments are able to detect in different phases of their variability period when we collect our data. These types of sources include long period variables that have not completed a full phase of their variability period during our study. Sources that are in the same phase of their variability period when our data were collected, will not be detected as variable. As a consequence, our study is biased toward redder sources with a long period of variability (of the orders of months to years) with high amplitudes of variations in the thermal infrared.
2.1 Ancillary Data: Optical and Near-IR Point Source Catalogs
The near-IR data from the combined Two Micron All-Sky (2MASS; Skrutskie et al. 2006) and the 2MASS 6X Deep (6X2MASS; Cutri & 2MASS Team 2004) Point Source Catalogs are the integral part of the SAGE-SMC IRAC catalogs (see Gordon et al. 2011b). The SAGE-SMC catalog is cross-matched in the SAGE-SMC database with the optical data from the Magellanic Clouds Photometric Survey (MCPS, UBVI bands; Zaritsky et al., 2002) and the Optical Gravitational Lensing Experiment (OGLE-III, VI bands; Udalski et al., 2008). We considered IRAC and optical sources a match when a distance between their positions was 1′′.
The ancillary data were used to construct sources’ spectral energy distributions for a wide wavelength range, from optical to 24 m. We adopt the V- and I-band photometry from OGLE-III when available, from MCPS otherwise.
3 Variable Star Identification
We identified the SMC variable sources following the procedure described in Vijh et al. (2009) for the LMC. We first matched the individual SAGE-SMC Epoch 0, Epoch 1, and Epoch 2 catalogs to extract a time series for each source detected in all epochs. We then applied variability criteria based on the flux change between epochs to select sources with measurable change above the photometric sensitivity. We finally performed quality checks aimed to remove spurious detections in order to have a reliable catalog of SMC infrared variables.
3.1 Interepoch Matching
In the initial step of our variable stars selection process, we cross-matched single epoch IRAC and MIPS 24 m catalogs. Accurate matching between epochs is crucial to ensure that we are measuring changes in flux for the same sources across multiple epochs. The match was performed using the CasJobs interface within the Mikulski Archive for Space Telescopes (MAST). CasJobs is based on a SQL database.
We started by generating a list of all the sources that had coordinates within 1′′ of each other within at least two of the three epochs of the SAGE-SMC IRAC data. We then matched the resulting IRAC lists with their corresponding MIPS 24 m data for each epoch, again requiring a match within 1′′. The requirement to identify common sources across multiple epochs of data significantly reduced the number of sources available for our study. For instance, the largest of our matched lists, containing sources with matches in Epoch 1 and 2 (the largest spatial coverage of the observations), contains just over 800,000 sources with valid 3.6 µm photometry, compared to over 2 million sources in each single epoch (Epoch 1 and Epoch 2) catalog. The source counts for other IRAC and MIPS 24 m bands and pairs of epochs can be found in Table 2. Note that our method of searching for variables would miss novae and supernovae if the progenitor star was not detectable in our survey before the outburst.
3.2 Variability Criteria
We identified candidate variables out of our inter–epoch matched catalogs on the basis of the variability index defined by Vijh et al. (2009) as the error-weighted flux difference between each pair of epochs:
| (1) |
where and are fluxes in a certain band for a single source in epochs and , respectively; and and are respective flux uncertainties. This index was calculated for each possible pair of the three available epochs ( and ) in each band, so that a single source can have up to 15 variability indices if it has valid fluxes in all the IRAC and MIPS 24 m bands across all three epochs of data. Note that a positive would correspond to an increase in flux between the two epochs, while a negative index would indicate that the source decreased in flux from one epoch to the other.
We considered a source to be variable if (equivalent to measuring flux changes with at least sensitivity) in at least two neighboring bands, again following Vijh et al. (2009):
| (2) |
where and are two of the three available epochs. We also required that the variability index among neighboring IRAC bands have the same sign, since all the IRAC bands were observed at essentially the same time within each epoch and we expect the change from one epoch to another to be similar for each band. Failing this condition is an indication that the flux in different bands may come from mismatched sources, sources whose flux is contaminated by a nearby or blended source, or by the presence of an artifact in our data. The exception to this rule is for the 24 m photometry, for which we do not require the same sign variability; the MIPS data were taken at different times than the IRAC data and correspond to a different variability phase. We finally excluded all sources with magnitudes larger than 15 at 3.6 µm and 4.5 µm, 13 at 5.8 µm, and 12 in the 8.0 µm IRAC bands; the photometric uncertainties increase for fainter sources, making flux measurements less reliable (Gordon et al., 2011b).
Note that to be considered as variable star candidates, sources do not need to be variable between all three pairs of epochs (only 6% of all candidate variable sources have in all three epoch pairs). Sources do not need to have valid photometry in necessarily all IRAC and MIPS bands as long as the sources have enough valid fluxes to demonstrate their variability.
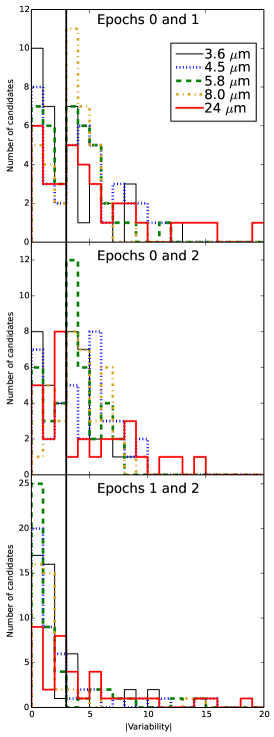
The results of our search for variable stars is summarized in Table 2 and the distributions of the variability indices for all bands and epoch pairs are shown in Figure 2. The variability indices for IRAC bands between Epochs 0 and 1 and Epochs 0 and 2 have a larger width (as shown in Figure 2) than the variability indices between Epochs 1 and 2. This is a consequence of the longer integration time used in the S3MC survey (reprocessed into SAGE-SMC Epoch 0), leading to smaller flux uncertainty and hence a better sensitivity for flux changes measured by the variability index. Conversely, the uncertainly in the MIPS 24 µm photometry (and hence the spread in the variability index distribution) was similar between the SAGE-SMC and S3MC datasets. We found 825 sources that meet our criteria for variability in at least two consecutive bands and pairs of epochs.
3.3 Source Inspection
We have visually inspected each variable star candidate in all available bands and epochs using thumbnail images extracted from the SAGE-SMC IRAC 3.6, 4.5, 5.8, and 8.0 m, and MIPS 24 m band mosaics. The purpose of the visual inspection was to remove candidates whose photometric reliability was compromised by poor pixel quality, optical or electronic artifacts, un-rejected transients such as cosmic rays, or contamination from a neighboring source. At the end of this process we were left with 814 candidates that meet all our criteria for variability, photometry, and image quality.
3.4 The SMC Infrared Variables Catalog
Our final catalog of infrared variables in the SMC is available in full within the online version of this paper. The catalog lists the basic astrometric and photometric properties of each variable candidate, including IRAC and MIPS designations, fluxes and magnitudes with uncertainties in the optical (MCPS and OGLE-III), near-IR (2MASS/6X2MASS), and mid-IR (Spitzer IRAC and MIPS 24 µm) bands, as well as the variability indices for each pair of epochs. The catalog also includes possible classification of each source based on matches with the literature (see Section 4 below). The complete list of columns in the catalog of SMC variables is provided in Table 3.
4 Source Classification
In order to understand the demographics of 814 newly-identified variable star candidates, we have cross-matched our source list with a number of published catalogs of SMC sources. These catalogs were constructed using different methods and include sources classified with varying levels of confidence. We required a distance between a variable source and its matching source from literature to be 1′′. A detailed discussion of the catalogs we used to determine the nature of variable sources and the matching results follows. The summary is provided in Table 4.
For several SAGE-SMC variable sources we found multiple matches in literature. Resolving ambiguity in source classification is out of scope of this paper, thus we provide all available classifications in our catalog (columns 19 to 21 in Table 3).
4.1 Evolved Stars
Over 80% of the LMC infrared variables identified by Vijh et al. (2009) are evolved stars: a similar result is to be expected in our SMC search. Stars of all masses, once they leave the main sequence, enter one or more phases when their convective envelopes expand by several orders of magnitude, while their effective temperatures become as low as 3,000 K. In those conditions, these stars cross the Long Period Variables (LPVs) instability strip in the Hertzsprung-Russell diagram, where radial pulsations are modulated by periodic changes in the opacity and ionization of internal stellar layers. These pulsations are observed as luminosity variations with period ranging from several tens to thousands of days. According to the shapes, amplitudes, and periods of their optical light curves, LPVs are classified as Mira, Semiregular, or Irregular variables (Samus et al., 2012), with Miras typically having larger amplitude luminosity variations. LPVs are also characterized by intense mass loss, which leads to the formation of dusty circumstellar envelopes. The circumstellar envelopes in turn give rise to strong infrared excesses above the photospheric continuum. While the variability properties of LPVs are well characterized in the visible, their mid-infrared variability has only recently been studied in a systematic way (e.g., Riebel et al. 2010 and references therein).
Low and intermediate mass stars () will become LPVs twice in their life: as stars in the Red Giant Branch (RGB, characterized by H nuclear burning in a shell around an inert He core), and in the Asymptotic Giant Branch (AGB, characterized by alternate H and He burning in a shell around an inert C/O core). While the AGB phase is shorter than the RGB phase, AGB stars tend to be more luminous, show larger variability, and have more intense mass loss. As a consequence, our search is biased toward discovering AGB rather than RGB variables. AGB stars are subjected to third dredge-up events, in which elements synthesized during He-shell burning events are transported toward the stellar surface. The end product is the injection of trace elements (the so-called -elements) in the stellar atmosphere, uniquely produced during these He-shell burning events. Third dredge-up events ultimately lead to a gradual increase in the photospheric C/O abundance ratio that, for a star with a main sequence mass in the – range (for solar metallicity; Straniero et al. 1995, 1997), leads to the formation of a so-called carbon star. Carbon stars are characterized by a C-rich atmospheric and circumstellar dust and gas chemistry. Stars below this mass limit never experience enough third dredge-up episodes to become C-rich AGBs, while stars above the upper limit destroy the newly generated C in a process called Hot Bottom Burning (HBB; Smith & Lambert 1985; Boothroyd & Sackmann 1992). Stars that undergo HBB processes remain O-rich AGBs and tend to have much higher luminosities than low mass O-rich AGBs. Note that in the low metallicity environments, like in the Magellanic Clouds, stars have a lower initial O atmosphere abundance, and a smaller number of dredge-up events are required to push the C/O ratio above unity. In this case the lower mass limit for the product of C-rich AGBs is somewhat reduced and a larger population of C-rich AGBs is to be expected (Ferrarotti & Gail, 2006; Ventura et al., 2012).
The mass loss rate dramatically increases toward the end of the AGB phase (Willson, 2000); in this late stage, the circumstellar envelope of AGB stars becomes optically thick and completely obscures the star in optical wavelengths. Stars of this kind are often referred to as extreme AGBs and can be either O-rich (in which case they may show OH/IR maser activity) or C-rich. A handful of the most extreme AGB stars are responsible for the larger fraction of dust injection into the LMC and SMC ISM (Boyer et al., 2012; Riebel et al., 2012), which these dust contributors tending to be prevalently C-rich (Boyer et al., 2011).
High mass stars, on the other hand, cross the LPV instability strip as Red SuperGiant (RSG) stars. RSG stars are characterized by a higher luminosity than low mass AGB stars (but comparable to intermediate mass HBB O-rich AGB stars) and a similar mass loss rate. RSG stars tend to have much smaller populations than AGB and RGB stars due to the Initial Mass Function being biased toward lower masses, and the shorter life span of RSG stars. As such, RSG stars are not large contributors to the ISM and we should not expect to find many of them among our candidate variables.
We matched our SMC variable sources with the color-selected evolved stars from Boyer et al. (2011) and with the LPVs identified in the OGLE-III project by Soszyński et al. (2011) based on the characteristics of their light curves (and then classified as O-rich or C-rich on the basis of their optical and near-IR colors). Boyer et al. (2011) differentiate the stars according to the evolutionary phases (RGBs, O-rich AGBs, C-rich AGBs, extreme AGBs, and RSGs), while Soszyński et al. (2011) only differentiate between RGBs, O-rich AGBs, and C-rich AGBs (along with providing details on the variability type). We also matched our sample of SAGE-SMC variables with the catalog of massive stars from Bonanos et al. (2010) that includes spectroscopically identified RSG stars. As expected, most of the matches with our variable candidates are AGB stars, of which 82 are O-rich and 497 are C-rich AGBs. Of those O- and C-rich AGBs, 251 are classified as extreme AGBs according to Boyer et al. (2011), the vast majority of which (85%) are C-rich according to Soszyński et al. (2011). For the non-extreme AGBs, Boyer et al. (2011) and Soszyński et al. (2011) are generally in agreement, with 16% mismatch within the O-rich category and less than 3% disagreement for the carbon stars. We only found 6 RGB and 23 RSG stars in our study, but it is worth noting that the Boyer et al. (2011) classification scheme cannot distinguish between RGB stars and AGB stars with luminosity below the tip of the RGB.
Boyer et al. (2011) has also three categories that we have not considered in our analysis. Sources labeled as “Far InfraRed objects” (FIR) are characterized by increasing flux at 8 and 24 µm, even larger than what is expected for extreme AGB stars. The fact that the FIR sources are mostly found in proximity of star forming region supports the hypothesis that they may be misclassified YSOs rather than evolved stars, but without spectroscopic analysis it is not possible to rule out the possibility that our FIR sources are evolved stars with unusually thick dusty envelopes. For this reason we have left FIR sources as unclassified in our survey. The “anomalous” aO-rich and aC-rich AGBs are O-rich and C-rich star, respectively, with peculiar colors in the Boyer et al. (2011) analysis. Rather than keeping these intermediate classes, we have relied on the chemical classification provided by the OGLE-III analysis in Soszyński et al. (2011), which is based on a combination of optical and near-IR colors. We found that most (18 out of 27) aO-rich AGBs are confidently described as O-rich AGBs in the OGLE-III catalog, with the remaining being classified as C-rich AGB stars, while the two aC-rich AGBs are evenly split between C- and O-rich AGBs in OGLE-III.
Due to their lower brightness, we were unable to calculate the index of RGB stars for any of our intervals of variability. RGB stars also have across all variability intervals. One source, SSTISAGE1C J004906.89-724309.7, has contrasting classifications among different catalogs. Soszyński et al. (2011) lists the source as a RGB star with O-rich chemistry and Boyer et al. (2011) classifies the source as a C-rich AGB star. This source is the only RGB candidate we found that varies in the 5.8 m band (all other RGB stars show variability in the 3.6 and 4.5 µm IRAC bands and have within all epochs).
Two RSGs have contrasting matches in literature. SSTISAGE1C J010302.41-720152.9 is classified as RSG by Bonanos et al. (2010) and as O-rich AGB star by Boyer et al. (2011). Given the higher reliability of the Bonanos et al. (2010) classification that used full spectra rather than broadband colors, SSTISAGE1C J010302.41-720152.9 is likely to be an under-luminous RSG star. This source meets our variability criteria primarily in the IRAC bands between Epochs 0 and 1, but the MIPS 24 µm band has the largest variability of all RSG sources with (between Epochs 0 and 2) and (between Epochs 1 and 2). Note, however, that Soszyński et al. (2011) is not attempting to differentiate AGB from RSG stars. RSG stars appear in the OGLE-III catalog as Semiregular LPVs with O-rich chemistry. This suggests that this source may be a RSG based on the luminosity cut in Boyer et al. (2011). Interestingly, this source is the most variable source between Epochs 1 and 2 in terms of consecutive neighboring bands with .
Finally, we have identified a candidate planetary nebula (PN), matched from a catalog kindly provided by G. Jacoby (2014, private communication). However, this same source (SSTISAGE1C J005530.37-725021.9) is also cross-matched with a YSO from Bolatto et al. (2007) and a background AGN from Kozłowski et al. (2011). The variability of this source is detected only between Epochs 0 and 1 and Epochs 0 and 2 in the 5.8 and 8.0 m bands. This suggests that this object may be changing brightness on very long time scales (comparable to the 3 years separation between the S3MC and SAGE-SMC surveys), pointing toward changes in accretion rate as a possible mechanism for the infrared variability.
4.2 Cepheids
Intermediate mass stars (4–) cross the Cepheid instability strip during the He-core burning stage, while they describe a pronounced “blue loop” on the Hertzsprung-Russell diagram. Cepheids are radial pulsators similar to LPVs, but their typical variability period is between 1 and 80 days. Cepheids have F and G spectral types; typically they do not have substantial mass loss (but see Marengo et al. 2010; Barmby et al. 2011; Matthews et al. 2012) and their intrinsic brightness makes them easily detectable in the SAGE-SMC survey. Given their importance as distance indicators, thanks to their period-luminosity relation (Leavitt law, Leavitt & Pickering 1912), Cepheid variables have been extensively studied not just in the Milky Way, but also in local group galaxies (including the SMC) at visible wavelengths (e.g., Freedman et al. 2001), as well as in the infrared (Ngeow & Kanbur, 2008, 2010; Scowcroft et al., 2011, 2013).
To search for Cepheids, we matched our catalog of candidate variables with the source lists in the OGLE-III database (where, again, the classification is based on the characteristics of the light curves). We matched both Classical Cepheids (Soszyński et al., 2010a) and the lower mass Type II Cepheids (Soszyński et al., 2010b). We found 70 Cepheids in our catalog (9% of our sample), with 67 of sources being classified as Classical Cepheids, and the remaining 3 being classified as Type II Cepheids. Our Cepheids show the highest variability index in the 3.6 and 4.5 µm bands, but generally have across all intervals of variability in all bands.
4.3 Early Type Stars
Early type stars (high mass stars with typically O and B spectral types) are characterized by several different kinds of variability, in some cases due to periodic pulsations (e.g., radially pulsating Cephei and non-radially pulsating Cygni stars), in others due to episodic outbursts (e.g., Luminous Blue Variables, whose prototype is Dor in the LMC). In other cases, variability in early type stars is caused by accretion in binary systems and can manifest itself at wavelengths ranging from the X-rays to the infrared (e.g., X-ray binaries). Early type stars tend to be rare, even more so the ones that show detectable variability.
To search for early type variables in the SMC, we have cross matched our variable star candidates list with the catalog of spectroscopically confirmed massive stars from Bonanos et al. (2010) and dusty OB stars from Sheets et al. (2013). We found a total of 23 sources (3% of our sample), 16 of which are early B stars, and one is also classified as a “dusty OB star” in Sheets et al. (2013). Four of the early spectral type stars identified by Bonanos et al. (2010) are also matched with the Sturm et al. (2013) catalog of SMC X-ray sources. Those sources are likely accreting X-ray binaries.
4.4 Young Stellar Objects
According to the Hartmann & Kenyon (1985) model of accretion outbursts in FU Orionis objects, infrared variability in YSOs is generally associated with changes in the accretion rate modulated by the protostellar disk rather than precessing jets (Herbig et al., 2003), which are rather invoked to explain optical variability.
Observations at different wavelength regimes allow a detection of YSOs at different stages of their evolution. The SED of a YSO changes when it evolves. Stage 0 protostars are in the early protostellar collapse stage with the majority of the source mass residing in the infalling envelope. The SED is dominated by the far-IR, because the protostar and possibly a disk are deeply embedded in a circumstellar envelope that absorbs the forming star’s photospheric emission, warms the dust and re-emits it in the far-IR. Stage I is a later stage of protostellar collapse. Stage I YSOs display very broad SEDs that peak near 100 m; they emit the bulk of their radiation at the mid-IR to far-IR wavelengths. The envelope mass is similar to the mass of the central protostellar object. Stage I YSOs have well-developed accretion disks and their envelopes have bipolar cavities excavated by outflows. Stage II YSOs are characterized by the presence of optically thick disks, bipolar outflows, and possibly the remains of a tenuous infalling envelope. Stage II YSOs emit mostly in the near-IR to mid-IR. Stage III YSOs, which are mostly detected at optical to near-IR wavelengths, have optically thin disks or no disks, and may still have optical bipolar jets.
The mid-IR Spitzer data are sensitive to Stage I and Stage II YSOs. Prior to Spitzer, there was only one YSO identified in the SMC (Gatley et al., 1982). In the galaxy-wide study based on the Spitzer SAGE-SMC data, Sewiło et al. (2013) identified 1000 YSO candidates which are categorized into “possible YSO candidates” and “high-reliability YSO candidates.” An earlier study by Bolatto et al. (2007) that used the S3MC data (and thus concentrated on the main body of the SMC) found 300 YSO candidates; this list is less vetted than that of Sewiło et al. (2013) and potentially more contaminated by non-YSOs. Chen et al. (2014) used the SAGE-SMC data to conduct a photometric search for YSOs in the SMC Tail and identified 26 massive YSO candidates. More detailed studies on YSOs in the SMC concentrated on individual star-forming regions: NGC 346 (Simon et al., 2007) and NGC 602 (Carlson et al., 2007, 2011; Gouliermis et al., 2007), identifying 150 additional YSO candidates; their YSO lists include low luminosity sources missed by galaxy-wide studies. Sewiło et al. (2013) used the relatively conservative brightness cuts to remove typically dimmer background galaxies from their YSO list, and thus selecting the brightest, most massive YSOs. The detailed inspection of source morphology that would help to distinguish between background galaxies and YSOs can only be done on smaller scales. To date, Spitzer studies identified over 1,200 individual YSO candidates in the SMC; 33 sources are confirmed spectroscopically as bona fide YSOs (van Loon et al., 2008, 2010; Oliveira et al., 2011, 2013).
Operating at longer wavelengths, the Herschel Space Observatory (Pilbratt et al., 2010) is sensitive to lower dust temperatures than Spitzer, allowing a detection of YSOs at the earliest evolutionary stages that had been missed by Spitzer. Herschel is sensitive to Stage 0 and Stage I YSOs. Seale et al. (2014) used the data from the Herschel Key Project HERITAGE (“Herschel Inventory of the Agents of Galaxy Evolution”; Meixner et al. 2013), which imaged the Magellanic System at 100, 160, 250, 350, and 500 m, to identify populations of sources in the LMC and SMC. In the SMC, Seale et al. (2014) identified 700 YSO candidates, which are categorized into “probable YSO candidates” and “possible YSO candidates”; 24% of these are newly-identified YSO candidates.
We cross–matched our list of candidate SMC variables with the YSO candidate lists from literature to identify infrared variable YSOs. We found 44 matches in Sewiło et al. (2013), 13 in Bolatto et al. (2007), 10 in Seale et al. (2014), 4 in Oliveira et al. (2013), 3 in Carlson et al. (2011), and one match in each van Loon et al. (2008), van Loon et al. (2010), and Oliveira et al. (2011) (all 3 refer to the same source). Many sources appear on more than one YSO list from literature; our list of candidate SMC variables includes 47 individual YSO candidates.
However, out of 47 sources matched to YSO candidates, 11 were also matched to other classes of sources. Five sources were matched to extreme AGB stars (Boyer et al., 2011), tending to have very high variability indices at the 24 m band () between Epochs 1 and 2. The remaining sources were matched to the early type stars from Bonanos et al. (2010), and the multiple-match PN described in Section 4.1 above.
Of the 984 YSOs in Sewiło et al. (2013), we match 44, suggesting a lower limit of 4.5% SMC YSOs that are variable in the infrared with our sensitivity and timescale coverage. Sewiło et al. (2013) estimated physical parameters of 22 of these sources based on the results of the SED fitting with the YSO radiative transfer models of (Robitaille et al., 2006). All 22 sources are classified as Stage I YSOs, indicating that the infrared variability may be tracing the accretion variability.
4.5 Background Galaxies
The OGLE-III survey has been used to search for optical variability of AGNs and quasars (QSOs) as part of the Magellanic Quasars Survey (Kozłowski et al., 2011, 2013). These sources are clearly background objects and not part of the SMC stellar population. Still, finding background galaxies within our survey is a useful complement to AGN and QSO optical studies, which typically show flux changes between 3–30% in the visible, over a period of 10–100 days (Kelly et al., 2009). The detection of variability at Spitzer wavelengths would indicate the presence of a non-thermal component in the characteristic active galaxies’ mid-IR spectral “bump” (e.g., Impey & Neugebauer 1988; Neugerbauer & Matthews 1999, and references therein). Furthermore, identification of distant quasars projected within the field of view of the SMC can be a useful tool to determine the proper motion of this galaxy.
We matched our catalog with Kozłowski et al. (2011, 2013) lists of AGNs and QSOs, which have been identified through spectroscopy and light curve morphology collected over a time span of 12 years. We found 8 sources matching the Kozłowski et al. (2011) AGN list, and one matching the Kozłowski et al. (2013) QSO sample. The latter source is also matched to an X-ray source from the Sturm et al. (2013) catalog (SSTISAGE1C J011139.57-725031.6). As mentioned above, one of the variable sources matched to the AGN (SSTISAGE1C J005530.37-725021.9) is also matched to a PN (G. Jacoby 2014, private communication), and a YSO (Bolatto et al. 2007).
4.6 Other Catalogs
Finally, we have also matched our sample of variable candidates with other source lists with peculiar spectral properties, namely 3,000 X-ray sources from Sturm et al. (2013) and a catalog of radio sources from Wong et al. (2012) (457 sources detected at 3 cm and 601 sources at 6 cm). We found a match for 6 X-ray sources, the majority of which are associated with early type stars (hence most likely X-ray binaries), and one (SSTISAGE1C J011139.57-725031.6) in common with Kozłowski et al. (2013) QSOs. We only identified one 6 cm radio source as an infrared variable (less than 1% of Wong et al. 2012 catalog); this variable Spitzer source (SSTISAGE1C J005212.88-730852.8) is also matched to the evolved stars from the Boyer et al. (2011) and Soszyński et al. (2011) catalogs (see discussion in Section 5.3).
4.7 Unclassified Objects
At the end of our classification process, we remained with 59 sources (7% of the total) that are not matched to any of the catalogs described above. These unclassified sources tend to be fainter (by 1 magnitude on average) than the classified variables and lack 24 µm photometry (less than 20% of the unclassified sources have 24 µm photometry in at least two epochs). The unclassified sources that do have at least one epoch detection at 24 µm in most cases possess an SED resembling the one of YSOs (see discussion in Section 5.2).
Many of the unclassified sources are located in the SMC Tail (see Section 5), as expected since the Magellanic Bridge is not covered by many of the surveys we used for source classification.
5 Discussion
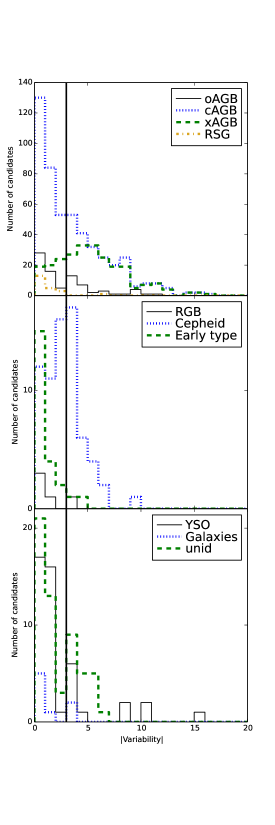
Figure 3 shows the distribution of the absolute values of variability indices in the 3.6 µm band between Epochs 1 and 2, separately for each class of sources. We chose this wavelength and pair of epochs because this is the combination providing the largest number of sources for which a variability index is available (mainly due to the higher sensitivity of this band and full coverage of the SMC in Epochs 1 and 2). The histograms for other bands and combinations of epochs are similar.
Figure 3 shows that most of the sources identified as variables according to the criteria delineated in Section 3.2, have a 3.6 µm variability index below the minimum threshold of 3. The fact that these sources are still classified as variables indicates that high variability is still detected in at least two other bands or in another pair of epochs. The exception are extreme AGBs with an average variability of 5.06, well above the threshold, and Cepheids, that have a median absolute variability index of 2.85, still significantly higher than other classes. It should be noted that these sources are the ones with the longest (extreme AGBs) and shortest (Cepheids) periods of variability among the type of variables we matched: this increases the chances of detection by our method by reducing the possibility of temporal aliases with the inter-epoch matching in our datasets.
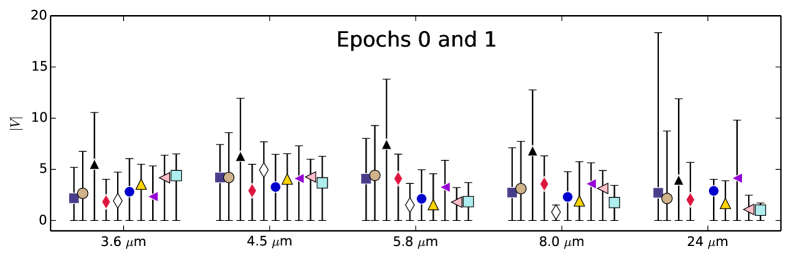
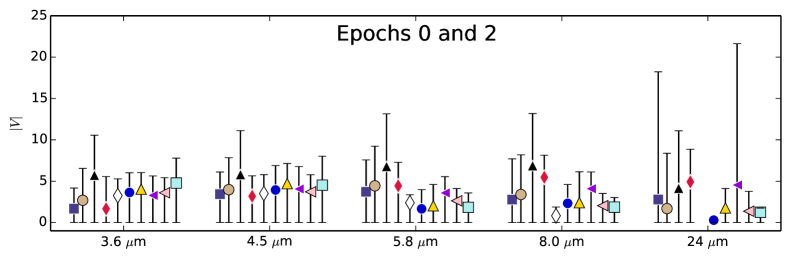
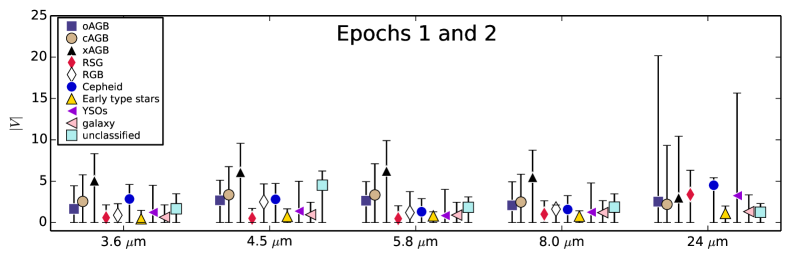
A different way to look at the same behaviors is shown in Figure 4. This figure plots the median value of the absolute variability index for each class, each band, and each pair of epochs, separately. The vertical bars represent the standard deviation in the distribution of . The variability indices tend to be larger when calculated with respect to Epoch 0, in part because this epoch corresponds to the more sensitive observations obtained with the S3MC survey. The much shorter time interval between the two SAGE-SMC epochs (Epochs 1 and 2), however, does play a role for some classes of sources. Cepheid stars, for example, show almost the same variability index between Epochs 1 and 2 as in the other two intervals, possibly because of their very short period which is equally sampled in all three intervals. RSGs, early type stars, YSOs, and galaxies, on the other hand, show very little variability between Epochs 1 and 2, even in bands (3.6 and 4.5 µm in particular) where they have high variability in the other two intervals (Epochs 0 and 1 and Epochs 0 and 2). O-rich AGBs and YSOs have the largest spread in variability indices in the 24 µmband; in all other bands the sources showing the largest standard deviation are instead the extreme AGB stars.
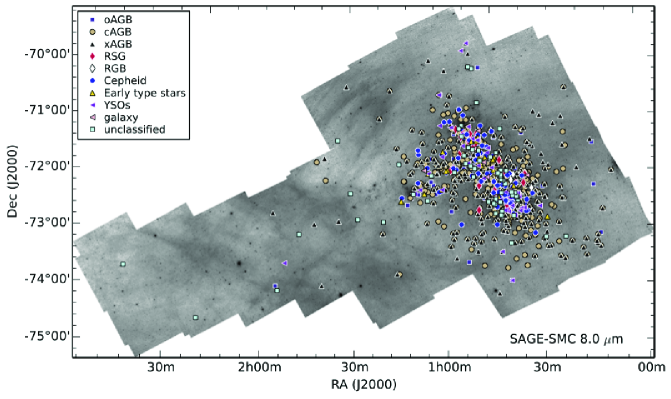
Figure 5 shows the spatial distribution of the individual variables over the SAGE-SMC 8.0 µm map. The figure shows that most of the variables are concentrated in the SMC Bar and Wing, due to the larger stellar density in these parts of the galaxy. Young sources (YSOs and moderately massive objects such as early type stars, RSGs, and Cepheids) are over-represented in the Bar, which is where most star formation is observed to occur. However, one YSO is detected in the Tail (SSTISAGE1C J014915.82-743225.5), which indicates the presence of active star formation sites in the bridge connecting the LMC with the SMC, as suggested by Harris (2007) and recently confirmed by Chen et al. (2014). Evolved stars are found at larger distances from the Bar, including the Tail, as expected for their lower mass and longer life span, which allows them to diffuse farther from the areas where they are born. Note a large number of symbols for extreme AGB stars overlapping with C-rich AGBs, which indicates that the extreme AGB stars in the SMC have in most cases a carbon-rich chemistry (at least in the areas of the Bar and Wing, where OGLE-III survey data are available). Finally, it should be noted that a large fraction of the variable sources in the SMC Tail are unclassified: this is a consequence of the lack of coverage in that area in the various source catalogs that we have used for source classification.
5.1 Color-Magnitude Diagrams
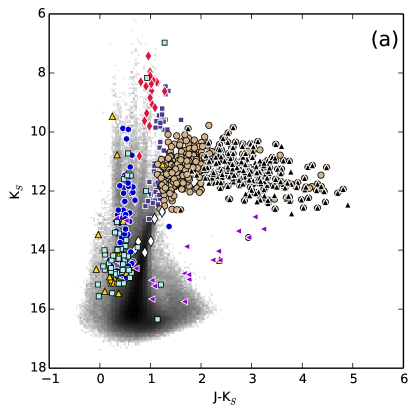
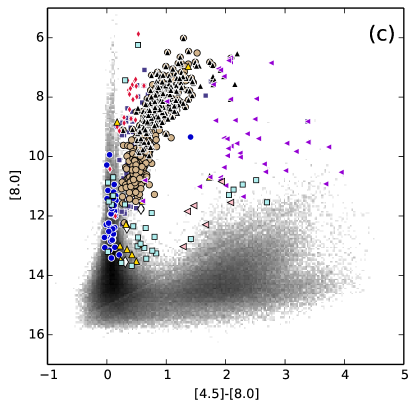
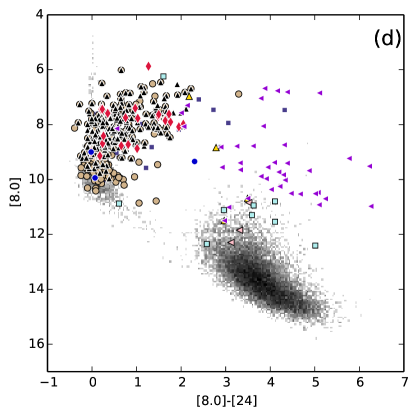
In Figures 6a-d, we have plotted our candidate infrared variables in a number of color-magnitude diagrams (CMDs), which allow a better understanding of the nature of these objects and can be used to search for anomalies (sources with an assigned class that show unique spectral properties for sources of that type). In all plots, the entire SAGE-SMC Epoch 1 catalog is shown in greyscale as a source density plot (a Hess diagram).
Figure 6a shows the near-IR CMD used for source selection by Boyer et al. (2011). Indeed, in this diagram the evolved variable stars of different classes appear well separated, as a consequence of our source classification process heavily relying on the Boyer et al. (2011) catalog for evolved stars. In particular, the diagram demonstrates the neat color separation of extreme AGB stars from “regular” carbon stars (again a consequence of using the Boyer et al. 2011 catalog for source classification): note, however, how many of these sources are still classified as C-stars by Soszyński et al. (2011). Another prominent feature in this diagram is the vertical sequence of Cepheid stars (blue circles), which is well isolated from the redder evolved stars, and from the much bluer early type stars. The YSO sequence is also well separated and shows how sources with larger infrared excesses are also brighter in the band. Of particular interest among the outliers in this diagram is a very red () source (SSTISAGE1C J005107.19-734133.3) classified as a Type II Cepheid in the OGLE-III database. This source is discussed in detail in Section 5.4. Figure 6a also shows a variable source (SSTISAGE1C J010921.65-712435.0) along the YSO sequence that is matched to both the YSO and C-rich AGB catalogs. The OGLE-III light curve for this variable is consistent with being a Mira, which would support its classification as a carbon star, despite its infrared colors being more consistent with the source being a YSO. The anomalous colors of this source could be explained by a photometric blend of two different sources, or by the presence of a circumstellar disk around a pulsating AGB star, which would mimic the spectral energy distribution of a YSO. Further analysis is required to confirm the nature of this source.
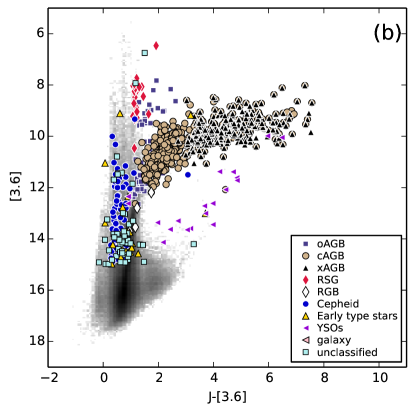
A similar separation between different classes of SAGE-SMC infrared variables is shown in panels b and c of Figure 6. The low and intermediate mass evolved star sequence is dominated by (in order of increasing brightness and redder colors) RGBs, O-rich AGBs, C-rich AGBs, and extreme AGBs (most of them classified as having a C-rich chemistry). The RSGs have infrared colors similar to O-rich AGBs (due to the similar dust composition), but generally higher luminosity. Note an isolated group of O-rich AGBs with , having a comparable brightness to RSGs, but moderately redder colors (by up to mag, indicating higher mass loss rate): these are likely candidate intermediate mass AGB stars undergoing HBB. In these diagrams, the YSOs are better isolated from the main sequence and the lower giant branch, but the brightest members of this group (likely high mass YSOs) still have infrared colors and magnitudes analogous to the reddest extreme AGB stars.
Figure 6d is the CMD with the smallest number of sources due to the lower sensitivity of the MIPS 24 µm band. However, it provides a better separation of the YSOs from all other classes, including background galaxies (the latter being concentrated in the large clump with and ). Of all the infrared variable active galaxies identified in our search, two are detected at 24 µm and are located at the upper end of this clump.
We further investigate the infrared properties of candidate variables identified in our study by analyzing in detail their complete SEDs. This is discussed in the following sections.
5.2 Spectral Energy Distribution
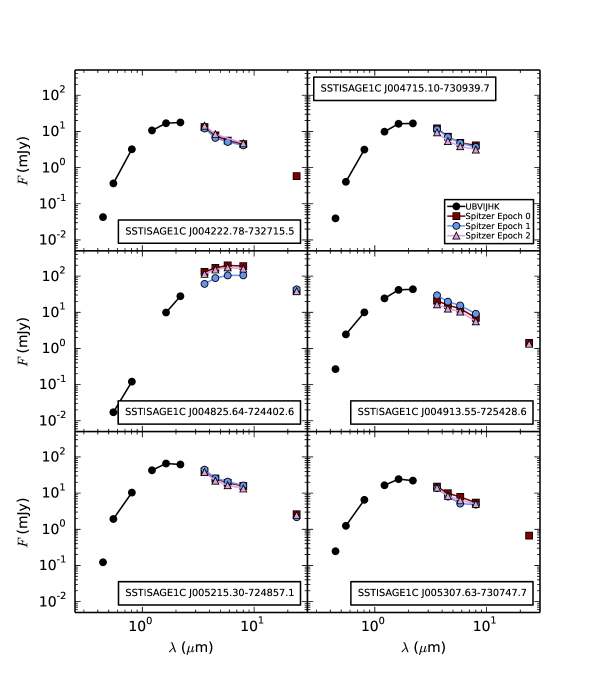
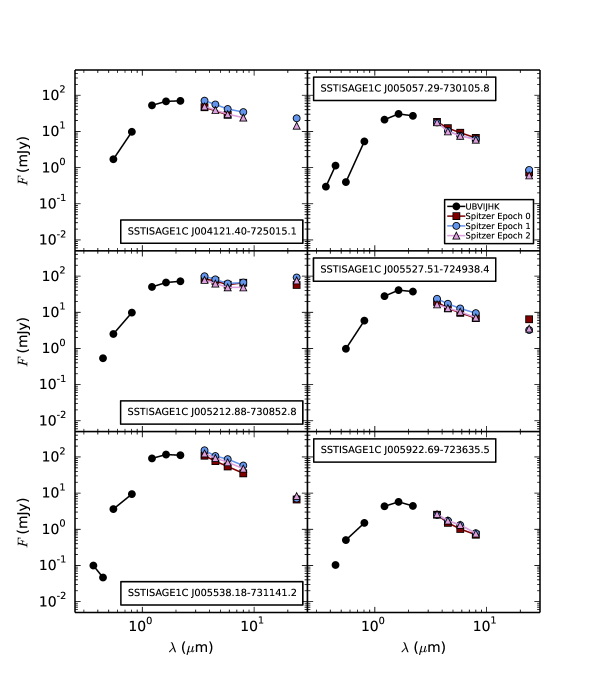
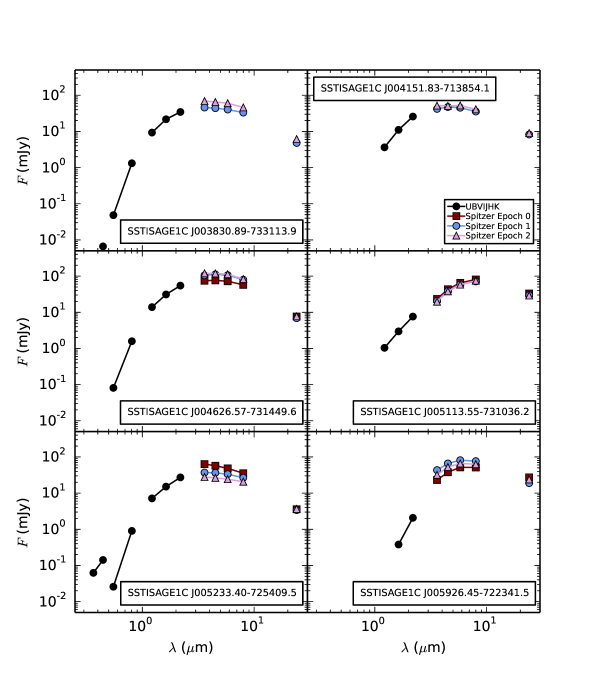
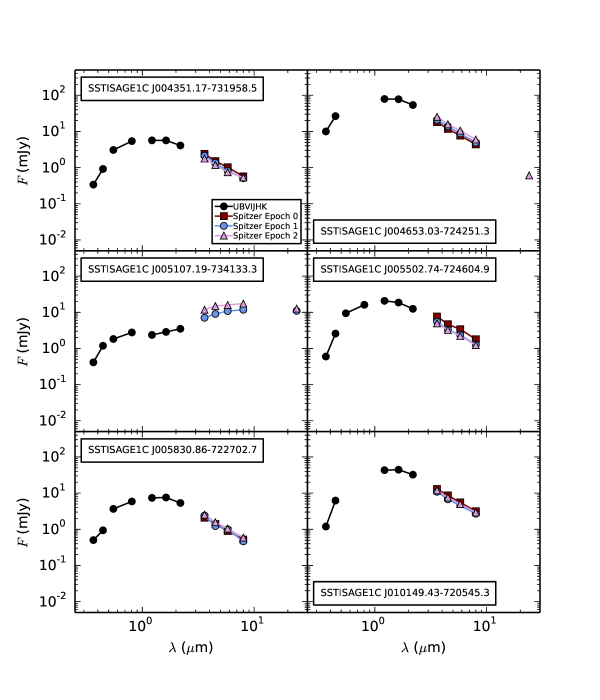
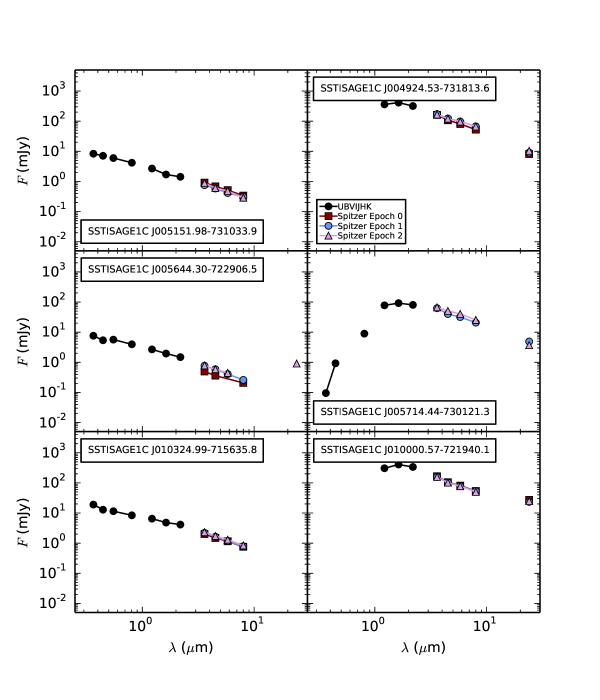
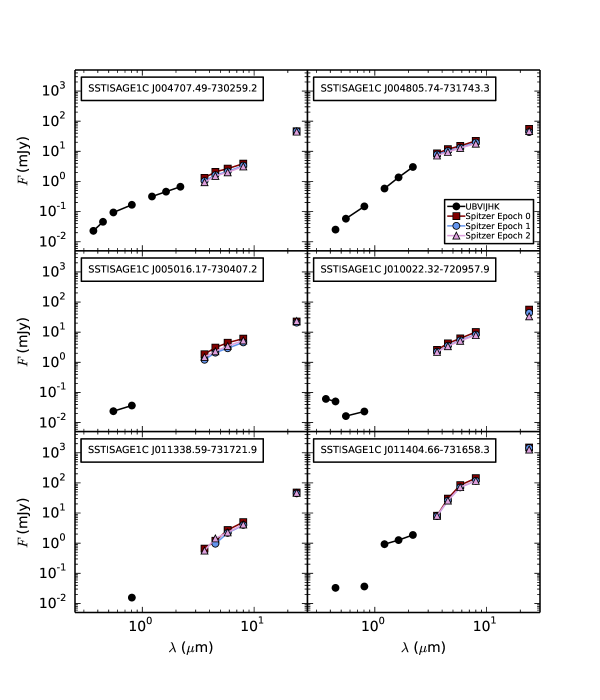
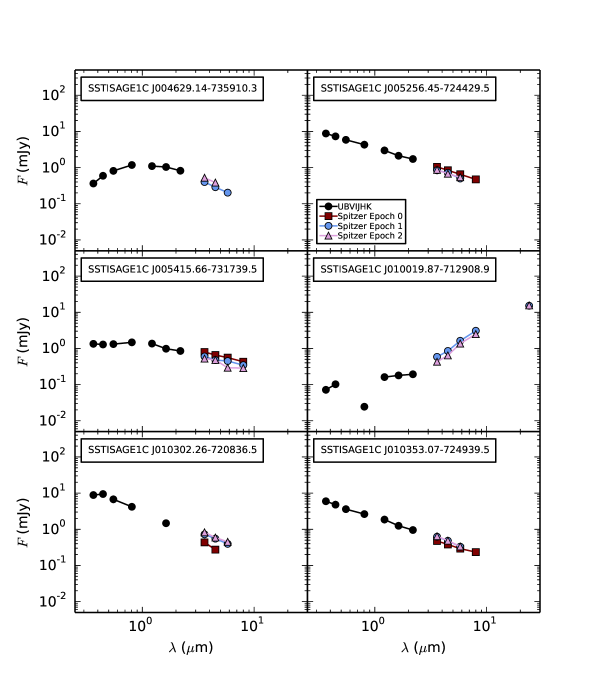
Figures 7 to 13 show SEDs of a representative sample of variable sources of different types. The UB (MCPS), VI (OGLE-III if available, MCPS otherwise), and JHKs (2MASS/6X2MASS) data are plotted as black circles. All three-epoch IRAC and MIPS 24 m photometric data are plotted and color-coded as indicated in the plots. The data points from individual surveys (representing separate epochs of observations) are connected by solid lines. The IRAC and MIPS 24 m data points are not connected since the IRAC and MIPS data were not taken at the same time within each epoch.
Figures 7, 8, and 9 show typical SEDs of evolved stars. The SEDs of O-rich and C-rich stars are very similar, both in the shape and in the amount of flux variations observed in the IRAC and MIPS 24 µm bands. The O-rich AGBs tend to have brighter 24 µm fluxes, possibly due to the presence of the broad 18 µm silicate band. The SEDs of the extreme AGB stars tend to peak at longer wavelengths. Extreme AGBs are very bright at 24 µm and some of them show very large variability in all IRAC and MIPS bands.
Cepheid stars present typical SEDs of stellar photospheres with no evidence for an infrared excess (Figure 10). Among the massive stars in our sample, early type stars similarly show the characteristic SEDs of stellar photospheres, while RSGs have SEDs similar to the ones of O-rich AGBs, with generally small brightness changes in the IRAC and MIPS bands (see Figure 11). The SEDs of YSOs (Figure 12) are the reddest in our sample, steeply increasing from optical to thermal infrared wavelengths.
Figure 13 shows SEDs of a representative sample of our unclassified sources. Most of the unclassified sources appear to be near or on the main sequence in Figure 6, panels a and b. However, Figure 6c shows that some of these sources appear to be slightly redder (0.5 mag in ) than main sequence stars. It is possible that a fraction of the unclassified sources are older YSOs approaching the T Tauri phase, without protostellar envelopes and a vestigial disk. Some unclassified sources, however, have SEDs very similar to those of very red YSOs, and indeed are found in the same CMD space where variable sources with matches in the YSO catalogs are located.
5.3 SSTISAGE1C J005212.88-730852.8: a Candidate SMC OH/IR Star
SSTISAGE1C J005212.88-730852.8 has one of the highest variability indices at 24 µm in our sample: between Epochs 0 and 1. The negative sign indicates that the source has been declining in brightness between November 2004 (S3MC) and September 2007 (SAGE-SMC Epoch 1). The variability index in the 24 µm band between Epochs 0 and 2 (June 2008) is less negative (), suggesting that the source has been brightening in the 9 months between the two SAGE-SMC MIPS 24 µm epochs. This is confirmed by the variability index we measure in all IRAC bands, which is positive between Epochs 1 and 2, indicating that the source has continued brightening in the three months between June and September 2008 (when the IRAC SAGE-SMC data were collected).
SSTISAGE1C J005212.88-730852.8 is classified by both Boyer et al. (2011) and Soszyński et al. (2011) as an O-rich AGB star. The OGLE-III catalog, in particular, classifies the source as a Mira with a long secondary period of 1,453 days, favoring its classification as an AGB star rather than a RSG (the latter being typically a Semiregular variable). The O-rich chemistry is confirmed by van Loon et al. (2008), who note that in the past the star has been confused with a carbon star. The optical spectral classification by Blanco et al. (1980) as an M6 giant, however, is in agreement with the Spitzer and ISO spectra showing a silicate feature in emission (Cioni et al., 2003). The source is peculiar also because it is the only stellar object in our catalog that has a match in the Wong et al. (2012) catalog of radio sources: the star is detected in the 6 cm band, which is known for the presence of OH masers (the source is not detected in the 3 cm band, as expected if the emission is not radio continuum). These characteristics suggest that SSTISAGE1C J005212.88-730852.8 may be an OH/IR star: if confirmed, this could be the first OH/IR star in the SMC (none are currently known, according to van Loon 2012).
The source is very bright ( mag and mag), suggesting that it may be one of the intermediate mass O-rich AGBs undergoing HBB. It is also very red ( mag), indicative of a large amount of cold circumstellar dust. In fact, the SED of this source (see Figure 8), is quite similar to the flat, red spectra of extreme AGBs. The spectral characteristics suggest that SSTISAGE1C J005212.88-730852.8 may be one of the O-rich AGB stars with highest mass loss rate in the SMC, comparable to the one typically observed in the C-rich extreme AGB stars. Finding sources of this kind is important to explain the overall dust budget in the Magellanic Clouds. As mentioned in Section 4.1, the large dust producers in both the LMC and SMC tend to be extreme carbon stars (Boyer et al., 2012; Riebel et al., 2012), making it difficult to explain the average composition of the Magellanic Clouds’ ISM (which has similar fraction of O-rich and C-rich dust). Stars like SSTISAGE1C J005212.88-730852.8 may help to reduce the observed deficit in silicate dust production.
5.4 SSTISAGE1C J005107.19-734133.3: an RV Tau Variable
SSTISAGE1C J005107.19-734133.3 is a very red star classified as an extreme AGB by Boyer et al. (2011) and as a Type II Cepheid (with a period of 39.52 days) in the OGLE-III database (Soszyński et al., 2010b). As noted in Section 4.2, the star is much redder than all other Cepheids, and its SED is dominated by a strong infrared excess indicative of copious amounts of circumstellar dust. The absolute variability index of this source at 24 µm between Epochs 1 and 2 is larger than 5, the highest for all sources in the OGLE-III Cepheid class, and larger than 7 in all IRAC bands.
SSTISAGE1C J005107.19-734133.3 is in fact among the post-AGB stars spectrally classified by Kamath et al. (2014) in the SMC. In their analysis, Kamath et al. (2014) confirms that the source shows an RV Tau type variability with alternating shallow and deep minima, and an infrared excess consistent with the presence of a circumbinary disk, as common in post-AGB stars. As noted by Soszyński et al. (2010b), RV Tau variables are matched with Type II Cepheids in the OGLE-III automatic classification light curve scheme. Visual inspection of the optical spectra of this source suggests -process enrichment, evidence that the star has recently gone through the third dredge-up, and thus may have only recently left the AGB phase.
6 Conclusions
We have identified and characterized a population of candidate infrared variables in the SMC using the data from the Spitzer SAGE-SMC and S3MC surveys. We found 814 sources showing variability in two or more adjacent mid-infrared bands. The variable source population is dominated by evolved stars (75%), specifically C-rich AGBs (60%). Around 10% of our variable sources are O-rich AGB stars, with one variable star candidate thought to be a rare OH/IR source. We find that 3% and 1% of our variable sources are RSG and RGB stars, respectively. Our list of candidate infrared variables include a small, but significant population of Cepheid variables (9%), as well as early type variable stars (3%), and variable YSOs (5%). A little over 1% of our sources are background galaxies that vary in the infrared. Around 7% of sources in our catalog are currently unclassified, but may be further examined through future studies.
References
- Ábraham et al. (2004) Ábraham, P., Kósp\ ́al, Á., Csizmadia, et al. 2004, A&A, 428, 89
- Alcock et al. (1997) Alcock, C., Allsman, R. A., Axelrod, T. S. et al. 1996, ApJ, 461, 84
- Barmby et al. (2011) Barmby, P., Marengo, M., Evans, N. R., et al. 2011, ApJ, 141, 42
- Blanco et al. (1980) Blanco, V. M., Blanco, B. M., & McCarthy, M. F. 1980, ApJ, 242, 938
- Blum et al. (2006) Blum, R. D., Mould, J. R., Olsen, K. A., et al. 2006, AJ, 132, 2034
- Bolatto et al. (2007) Bolatto, A. D., Simon, J. D., Stanimirović, S., et al. 2007, ApJ, 655, 212
- Bonanos et al. (2010) Bonanos, A. Z., Lennon, D. J., Köhlinger, F., et al. 2010, AJ, 140, 416
- Boyer et al. (2011) Boyer, M. L., Srinivasan, S., van Loon, J. T., et al. 2011, AJ, 142, 103
- Boyer et al. (2012) Boyer, M. L., Srinivasan, S., Riebel, D., et al. 2012, ApJ, 748, 40
- Boothroyd & Sackmann (1992) Boothroyd, A. I., & Sackmann, I.-J. 1992, ApJ, 393, 21
- Caldwell & Coulson (1986) Caldwell, J. A. R., & Coulson, I. M. 1986, MNRAS, 218, 223
- Carlson et al. (2007) Carlson, L. R., Sabbi, E., Sirianni, M., et al. 2007, ApJ, 665, L109
- Carlson et al. (2011) Carlson, L. R., Sewiło, M., Meixner, M., et al. 2011, ApJ, 730, 78
- Chen et al. (2014) Chen, C.-H. R., Indebetouw, R., Muller, E., et al. 2014, ApJ, 785, 162
- Cioni et al. (2003) Cioni, M.-R. L., Blommaert, J. A. D. L., Groenewegen, M. A. T., et al. 2003, A&A, 406, 51
- Cutri & 2MASS Team (2004) Cutri, R. M., & 2MASS Team 2004, Bulletin of the American Astronomical Society, 36, 1487
- Draine et al. (2007) Draine, B. T., Dale, D. A., Bendo, G., et al. 2007, ApJ, 663, 866
- Engelbracht et al. (2005) Engelbracht, C. W., Gordon, K. D., Rieke, G. H., et al. 2005, ApJ, 628, L29
- Fazio et al. (2004) Fazio, G. G., Hora, J. L., Allen, L. E., et al. 2004, ApJS, 154, 10
- Ferrarotti & Gail (2006) Ferrarotti, A. S., & Gail, H.-P. 2006, A&A, 447, 553
- Flaherty et al. (2012) Flaherty, K. M., Muzerolle, J., Rieke, G., et al. 2012, ApJ, 748, 71
- Freedman et al. (2001) Freedman, W. L., Madore, B. F., Gibson, B. K. et al. 2001, ApJ, 553, 47
- Gatley et al. (1982) Gatley, I., Hyland, A. R., & Jones, T. J. 1982, MNRAS, 200, 521
- Giannini et al. (2009) Giannini, T., Lorenzetti, D., Elia, D., et al. 2009, ApJ, 704, 606
- Gordon et al. (2011a) Gordon, K. D., Meixner, M., Meade, M. R., et al. 2011a, AJ, 142, 102
- Gordon et al. (2011b) Gordon, K. D., Babler, B., Block, M., et al. 2011b, “The SAGE-SMC Data Description: Delivery 3” document available in the NASA/IPAC Infrared Science Archive: http://irsa.ipac.caltech.edu/data/SPITZER/SAGE-SMC/docs/sage-smc_delivery_apr11.pdf
- Gouliermis et al. (2007) Gouliermis, D. A., Quanz, S. P., & Henning, T. 2007, ApJ, 665, 306
- Harris (2007) Harris, J. 2007, ApJ, 658, 345
- Hartmann & Kenyon (1985) Hartmann, L., & Kenyon, S. J. 1985, ApJ, 299, 462
- Haschke et al. (2012) Haschke, R., Grebel, E. K., & Duffau, S. 2012, AJ, 144, 107
- Herbig et al. (2003) Herbig, G. H., Petrov, P. P., & Duemmler, R. 2003, ApJ, 595, 384
- Herbst et al. (1994) Herbst, W., Herbst, D. K., Grossman, E. J., & Weinstein, D. 1994, AJ, 108, 1906
- Hilditch et al. (2005) Hilditch, R. W., Howarth, I. D., & Harries, T. J. 2005, MNRAS, 357, 304
- Impey & Neugebauer (1988) Impey, C. D., & Neugebauer, G. 1988, AJ, 95, 307
- Ita & Matsunaga (2011) Ita, Y., & Matsunaga, N. 2011, MNRAS, 412, 2345
- Juhász et al. (2007) Juhász , A. , Prusti , T. , Ábrahám , P. , & Dullemond , C. P. 2007, MNRAS, 374, 1242
- Kamath et al. (2014) Kamath, D., Wood, P. R., & Van Vinckel, H. 2014, MNRAS, 439, 2211
- Kelly et al. (2009) Kelly, B. C., Bechtold, J., & Siemiginowska, A. 2009, ApJ, 698, 895
- Klein et al. (2014) Klein, C. R., Richards, J. W., Butler, N. R., & Bloom, J. S. 2014, MNRAS, 440, L96
- Kozłowski et al. (2011) Kozłowski, S., Kochanek, C. S., & Udalski, A. 2011, ApJS, 194, 22
- Kozłowski et al. (2013) Kozłowski, S., Onken, C. A., Kochanek, C. S., et al. 2013, ApJ, 775, 92
- Leavitt & Pickering (1912) Leavitt, H. S., & Pickering, E. C. 1912, Harvard College Observatory Circular, 173, 1
- Lee et al. (2005) Lee, J.-K., Rolleston, W. R. J., Dufton, P. L., & Ryans, R. S. I. 2005, A&A, 429, 1025
- Madore et al. (2009) Madore, B. F., Freedman, W. L., Rigby, J., et al. 2009, ApJ, 695, 988
- Madore et al. (2013) Madore, B. F., Hoffman, D., Freedman, W. L. et al. 2013, ApJ, 776, 135
- Marengo et al. (2010) Marengo, M., Evans, N. R., Barmby, P., et al. 2010, ApJ, 725, 2392
- Matsunaga et al. (2011) Matsunaga, N., Feast, M. W., & Soszyński, I. 2011, MNRAS, 413, 223
- Matthews et al. (2012) Matthews, L. D., Marengo, M., Evans, N. R., & Bono, G. 2012, ApJ, 744, 53
- McGee & Newton (1986) McGee, R. X., & Newton, L. M. 1986, Proceedings of the Astronomical Society of Australia, 6, 471
- Meixner et al. (2006) Meixner, M., Gordon, K. D., Indebetouw, R., et al. 2006, AJ, 132, 2268
- Meixner et al. (2013) Meixner, M., Panuzzo, P., Roman-Duval, J., et al. 2013, AJ, 146, 62
- Meyssonnier & Azzopardi (1993) Meyssonnier, N., & Azzopardi, M. 1993, A&AS, 102, 451
- Neugerbauer & Matthews (1999) Neugerbauer, G, & Matthews, K. 1999, AJ, 18, 35
- Ngeow & Kanbur (2008) Ngeow, C.-C., & Kanbur, S. M. 2008, ApJ, 679, 76
- Ngeow & Kanbur (2010) Ngeow, C.-C., & Kanbur, S. M. 2010, ApJ, 720, 626
- Oliveira et al. (2011) Oliveira, J. M., van Loon, J. T., Sloan, G. C., et al. 2011, MNRAS, 411, L36
- Oliveira et al. (2013) Oliveira, J. M., van Loon, J. T., Sloan, G. C., et al. 2013, MNRAS, 428, 3001
- Omont et al. (1999) Omont, A. et al. 1999, A&A, 348, 755
- Paczynski et al. (1994) Paczynski, B., Stanek, K. Z., Udalski, A., et al. 1994, arXiv:astro-ph/9411004
- Peterson et al. (2000) Peterson, B. M., McHardy, I. M., & Wilkes, B. J. 2000, New A Rev., 44, 491
- Pilbratt et al. (2010) Pilbratt, G. L., Riedinger, J. R., Passvogel, T., et al. 2010, A&A, 518, L1
- Rieke et al. (2004) Rieke, G. H., Young, E. T., Engelbracht, C. W., et al. 2004, ApJS, 154, 25
- Riebel et al. (2010) Riebel, D., Meixner, M., Fraser, O., et al. 2010, ApJ, 723, 1195
- Riebel et al. (2012) Riebel, D., Srinivasan, S., Sargent, B., & Meixner, M. 2012, ApJ, 753, 71
- Robitaille et al. (2006) Robitaille, T. P., Whitney, B. A., Indebetouw, R., Wood, K., & Denzmore, P. 2006, ApJS, 167, 256
- Rolleston et al. (1999) Rolleston, W. R. J., Dufton, P. L., McErlean, N. D., & Venn, K. A. 1999, A&A, 348, 728
- Rolleston et al. (2003) Rolleston, W. R. J., Venn, K., Tolstoy, E., & Dufton, P. L. 2003, A&A, 400, 21
- Russell & Dopita (1992) Russell, S. C. & Dopita, M. A. 1992, ApJ, 384, 508
- Samus et al. (2012) Samus, N. N. et al. 2012, General Catalog of Variable Stars (GCVS database, Version April 2012)
- Sandstrom et al. (2010) Sandstrom, K. M., Bolatto, A. D., Draine, B. T., Bot, C., & Stanimirovi/’c 2010, ApJ, 715, 710
- Scowcroft et al. (2011) Scowcroft, V., Freedman, W. L., Madore, B., et al. 2011, ApJ, 743, 76
- Scowcroft et al. (2013) Scowcroft, V., Freedman, W. L., Madore, B. F/, et al. 2013, ApJ, 777, 106
- Seale et al. (2014) Seale, J., Meixner, M., Babler, B., & Sewilo, M. 2013, Protostars and Planets VI, Heidelberg, July 15-20, 2013. Poster #1S061, 61
- Sewiło et al. (2013) Sewiło, M., Carlson, L. R., Seale, J. P., et al. 2013, ApJ, 778, 15
- Sheets et al. (2013) Sheets, H. A., Bolatto, A. D., van Loon, J. T., et al. 2013, ApJ, 771, 111
- Simon et al. (2007) Simon, J. D., Bolatto, A. D., Whitney, B. A., et al. 2007, ApJ, 669, 327
- Skrutskie et al. (2006) Skrutskie, M. F., Cutri, R. M., Stiening, R., et al. 2006, AJ, 131, 1163
- Smith & Lambert (1985) Smith, V. V., & Lambert, D. L. 1985, ApJ, 194, 326
- Soszyński et al. (2010a) Soszyński, I., Poleski, R., Udalski, A., et al. 2010, Acta Astron., 60, 17
- Soszyński et al. (2010b) Soszyński, I., Udalski, A., Szymañski, M. K., et al. 2010, Acta Astron., 60, 91
- Soszyński et al. (2010c) Soszyński, I., Udalski, A., Szymański, M. K. et al. 2010c, Acta Astron., 60, 165
- Soszyński et al. (2011) Soszyński, I., Udalski, A., Szymański, M. K., et al. 2011, Acta Astron., 61, 217
- Straniero et al. (1995) Straniero, O., Gallino, R, Busso, M., et al. 1995, ApJ, 440, 85
- Straniero et al. (1997) Straniero, O., Chieffi, A., Limongi, M., et al. 1997, ApJ, 478, 332
- Sturm et al. (2013) Sturm, R., Haberl, F., Pietsch, W., et al. 2013, A&A, 558, A3
- Terrazas et al. (2010) Terrazas, M., Whitney, B., Meade, M., et al. 2010, Bulletin of the American Astronomical Society, 42, #459.03
- Udalski et al. (2008) Udalski, A., Szymánski, M. K., Soszyński, I., & Poleski, R. 2008, Acta Astron., 58, 69
- Ventura et al. (2012) Ventura, P., et al. 2012, MNRAS, 424, 2345
- van der Veen & Habing (1990) van der Veen, W. E. C. J., & Habing, H. J. 1990, A&A, 231, 404
- van Loon et al. (2008) van Loon, J. T., Cohen, M., Oliveira, J. M., et al. 2008, A&A, 487, 1055
- van Loon et al. (2010) van Loon, J. T., Oliveira, J. M., Gordon, K. D., Sloan, G. C., & Engelbracht, C. W. 2010, AJ, 139, 1553
- van Loon (2012) van Loon, J.-Th. 2012, in proc. “Science with Parkes at 50 Years Young”, Ed. Robert Young, electronic publication.
- Vijh et al. (2009) Vijh, U. P., Meixner, M., Babler, B., et al. 2009, AJ, 137, 3139
- Werner et al. (2004) Werner, M. W., Roellig, T. L., Low, F. J., et al. 2004, ApJS, 154, 1
- Whitelock et al. (1991) Whitelock, P., Feast, M., & Catchpole, R. 1991, MNRAS, 248, 276
- Willson (2000) Willson, L. A. 2000, ARA&A, 38, 573
- Wong et al. (2012) Wong, G. F., Crawford, E. J., Filipovic, M. D., et al. 2012, Serbian Astron. Journal, 184, 93
- Wright et al. (2010) Wright, E. L., Eisenhardt, P. R. M., Mainzer, A. K., et al. 2010, ApJ, 140, 1868
- Zaritsky & Harris (2004) Zaritsky, D. & Harris, J. 2004, ApJ, 604, 167
- Zaritsky et al. (2002) Zaritsky, D., Harris, J., Thompson, I. B., Grebel, E. K., & Massey, P. 2002, AJ, 123, 855
| Epoch | Survey name | IRAC observation date | MIPS observation date | Sky area (deg2) |
|---|---|---|---|---|
| 0 | S3MC | 2005 May 7-9 | 2004 November 6-8 | 3.7 |
| 1 | SAGE-SMC | 2008 June 12-19 | 2007 September 17-25 | 30 |
| 2 | SAGE-SMC | 2008 September 15-23 | 2008 June 25-28 | 30 |
| Criteria | 3.6 m | 4.5 m | 5.8 m | 8.0 m | 24 m |
|---|---|---|---|---|---|
| Epochs 0 and 1 | |||||
| # of sources with valid fluxes | 169424 | 120190 | 27052 | 10172 | 1425 |
| # with v band 3 | 1939 | 1708 | 570 | 409 | 189 |
| % with v band 3 | 1.14 | 1.42 | 2.11 | 4.03 | 13.26 |
| # of sources with valid fluxes | |||||
| in neighboring bands | 115308a | 116101b | 23885c | 11294d | 1083e |
| # meet variability criterion | 194 | 407 | 466 | 617 | 623 |
| % meet variability criterion | 0.17 | 0.35 | 1.95 | 5.46 | 57.53 |
| Epochs 0 and 2 | |||||
| # of sources with valid fluxes | 175714 | 123027 | 27066 | 12129 | 1551 |
| # with v band 3 | 1963 | 1742 | 571 | 421 | 189 |
| % with v band 3 | 1.12 | 1.42 | 2.11 | 3.47 | 12.19 |
| # of sources with valid fluxes | |||||
| in neighboring bands | 112696a | 113568b | 23917c | 9552d | 976e |
| # meet variability criterion | 196 | 411 | 483 | 645 | 646 |
| % meet variability criterion | 0.17 | 0.36 | 2.02 | 6.75 | 66.19 |
| Epochs 1 and 2 | |||||
| # of sources with valid fluxes | 812930 | 551722 | 87886 | 36444 | 6544 |
| # with v band 3 | 3561 | 3252 | 582 | 435 | 277 |
| % with v band 3 | 0.44 | 0.59 | 0.66 | 1.19 | 4.23 |
| # of sources with valid fluxes | |||||
| in neighboring bands | 496470a | 500512b | 81995c | 32302d | 4092e |
| # meet variability criterion | 446 | 446 | 390 | 374 | 227 |
| % meet variability criterion | 0.09 | 0.09 | 0.48 | 1.16 | 5.55 |
| Column | Name | Description |
|---|---|---|
| 1 | varid | The identification name of the variable star candidates |
| 2 | R.A. (J2000) | Right Ascension, J2000 (deg) |
| 3 | Decl. (J2000) | Declination, J2000 (deg) |
| 4-6 | IRACdesignations_ei | SAGE-SMC IRAC designations for Epoch 0 (i=0), |
| Epoch 1 (i=1), and Epoch 2 (i=2) | ||
| 7-9 | MIPSdesignations_ei | SAGE-SMC MIPS designations for Epoch 0 (i=0), |
| Epoch 1 (i=1), and Epoch 2 (i=2) | ||
| 10-12 | IRACdistance_i | Distance between SAGE-SMC IRAC Epochs 0 and 1 (i=01), |
| Epochs 0 and 2 (i=02), Epochs 1 and 2 (i=12) (arcsec) | ||
| 13-15 | MIPSdistance_ei | Distance between SAGE-SMC IRAC and MIPS for Epoch 0 (i=0), |
| Epoch 1 (i=1), and Epoch 2 (i=2) | ||
| 16 | E01aaValid fluxes at 3.6 and 4.5 m. | Variability flag between Epochs 0 and 1 |
| 17 | E02aaFlags indicating if a given source has been identified as a candidate infrared variable based on the data from two epochs (E01 - Epochs 0 and 1; E02 - Epochs 0 and 2; E12 - Epochs 1 and 2): 1 – a source is a variable, i.e., its absolute variability index is larger than 3 in at least 2 consecutive bands; 0 – a source does not vary or there is not enough photometric data available. | Variability flag between Epochs 0 and 2 |
| 18 | E12aaFlags indicating if a given source has been identified as a candidate infrared variable based on the data from two epochs (E01 - Epochs 0 and 1; E02 - Epochs 0 and 2; E12 - Epochs 1 and 2): 1 – a source is a variable, i.e., its absolute variability index is larger than 3 in at least 2 consecutive bands; 0 – a source does not vary or there is not enough photometric data available. | Variability flag between Epochs 1 and 2 |
| 19-21 | classificationj | Classification of sources (j=1-3) |
| 22-26 | Vk_01 | Variability indices between Epochs 0 and 1 for the |
| IRAC 3.6, 4.5, 5.8, 8.0 m (k=1-4) and MIPS 24 m (k=5) bands. | ||
| 27-31 | Vk_02 | Variability indices between Epochs 0 and 2 for the |
| IRAC 3.6, 4.5, 5.8, 8.0 m (k=1-4) and MIPS 24 m (k=5) bands. | ||
| 32-36 | Vk_12 | Variability indices between Epochs 1 and 2 for the |
| IRAC 3.6, 4.5, 5.8, 8.0 m (k=1-4) and MIPS 24 m (k=5) bands. | ||
| 37-46 | fluxk, dfluxk | Fluxes and flux uncertainties (mJy) for MCPS UBVIbbValid fluxes at 3.6 and 4.5 m or at 4.5 and 5.8 m. (k=1-8), |
| OGLE-III VIc,dc,dfootnotemark: (k=9-10), 2MASS JHKs (k=11-16) | ||
| 47-62 | e0_fluxk, e0_dfluxk | Fluxes and flux uncertainties (mJy) for Epoch 0: |
| Spitzer IRAC 3.6, 4.5, 5.8, 8.0 m (k=1-4) and MIPS 24 m (k=5) bands. | ||
| 63-72 | e1_fluxk, e1_dfluxk | Fluxes and flux uncertainties (mJy) for Epoch 1: |
| Spitzer IRAC 3.6, 4.5, 5.8, 8.0 m (k=1-4) and MIPS 24 m (k=5) bands. | ||
| 73-82 | e2_fluxk, e2_dfluxk | Fluxes and flux uncertainties (mJy) for Epoch 2: |
| Spitzer IRAC 3.6, 4.5, 5.8, 8.0 m (k=1-4) and MIPS 24 m (k=5) bands. | ||
| 83-96 | magk, dmagk | Magnitudes and magnitude uncertainties (mag) |
| for MCPS UBVI (k=1-8) and 2MASS JHKs (k=9-14) | ||
| 97-106 | e0_magk, e0_dmagk | Magnitudes and magnitude uncertainties (mag) for Epoch 0: |
| Spitzer IRAC 3.6, 4.5, 5.8, 8.0 m (k=1-4) and MIPS 24 m (k=5) bands. | ||
| 107-116 | e1_magk, e1_dmagk | Magnitudes and magnitude uncertainties (mag) for Epoch 1: |
| Spitzer IRAC 3.6, 4.5, 5.8, 8.0 m (k=1-4) and MIPS 24 m (k=5) bands. | ||
| 117-126 | e2_magk, e2_dmagk | Magnitudes and magnitude uncertainties (mag) for Epoch 2: |
| Spitzer IRAC 3.6, 4.5, 5.8, 8.0 m (k=1-4) and MIPS 24 m (k=5) bands. |
| Literature | Matched contents | # of sources |
|---|---|---|
| Bolatto et al. (2007) | YSOs | 13 |
| Bonanos et al. (2010) | Massive starsa | 43 |
| Boyer et al. (2011) | Evolved starsb,f | 600 |
| Carlson et al. (2011) | YSOs | 3 |
| G. Jacoby (private communication) | PNe | 1 |
| Kozłowski et al. (2011) | AGNc | 8 |
| Kozłowski et al. (2013) | QSOsc | 1 |
| Oliveira et al. (2011) | YSOs | 1 |
| Oliveira et al. (2013) | YSOs | 4 |
| Seale et al. (2014) | YSOs | 10 |
| Sewiło et al. (2013) | YSOs | 44 |
| Sheets et al. (2013) | dustyOBd | 1 |
| Simon et al. (2007) | YSOs | 3 |
| Soszyński et al. (2010a) | Classic Cepheidse | 67 |
| Soszyński et al. (2010b) | Type II Cepheidse | 3 |
| Soszyński et al. (2011) | Evolved starsf | 539 |
| Sturm et al. (2013) | X-ray sources | 6 |
| van Loon et al. (2008) | YSOs | 1 |
| van Loon et al. (2010) | YSOs | 1 |
| Wong et al. (2012) | Radio | 1 |
 |
 |
 |
|
|