Nature of the Insulating Ground State of the 5 Post-Perovskite CaIrO3
Abstract
The insulating ground state of 5 transition metal oxide CaIrO3 has been classified as a Mott-type insulator. Based on a systematic density functional theory (DFT) study with local, semilocal, and hybrid exchange-correlation functionals, we reveal that the Ir states exhibit large splittings and one-dimensional electronic states along the axis due to a tetragonal crystal field. Our hybrid DFT calculation adequately describes the antiferromagnetic (AFM) order along the direction via a superexchange interaction between Ir4+ spins. Furthermore, the spin-orbit coupling (SOC) hybridizes the states to open an insulating gap. These results indicate that CaIrO3 can be represented as a spin-orbit Slater insulator, driven by the interplay between a long-range AFM order and the SOC. Such a Slater mechanism for the gap formation is also demonstrated by the DFT + dynamical mean field theory calculation, where the metal-insulator transition and the paramagnetic to AFM phase transition are concomitant with each other.
pacs:
71.20.Be, 71.70.Ej, 75.10.Lp, 71.15.MbOne of the most important phenomena in condensed matter physics is the Mott transition driven by electron-electron correlations Mott ; Imada . In 3 transition-metal oxides (TMOs), the localized 3 orbitals are responsible for the strong on-site Coulomb repulsion (), leading to a Mott-Hubbard insulator where splits a half-filled band into lower and upper Hubbard bands. Surprisingly, despite weaker in 5 TMOs due to the very delocalized 5 orbitals, a series of Ir oxides such as Sr2IrO4 BJKim ; BJKim2 ; SJMoon ; Arita ; li , Na2IrO3 Shitade ; Comin ; Gretarsson , and CaIrO3 Ohgushi2 ; Subedi ; Bogdanov ; Ohgushi ; Sala including Ir4+ ions with five valence electrons exhibit an insulating ground state. For this unusual insulating behavior of the 5 iridates, it was proposed that spin-orbit coupling (SOC) splits the Ir states into completely filled = 3/2 bands and a narrow half-filled = 1/2 band at the Fermi level (), and the latter band is further split into two Hubbard subbands by moderate Coulomb repulsion BJKim ; BJKim2 ; SJMoon . Such a = 1/2 Mott-Hubbard scenario has, however, been challenged by an alternative scenario of Slater mechanism Slater based on the single-particle band picture, where the opening of insulating gap in 5 TMOs is driven by a long-range magnetic ordering Arita ; li ; Calder ; HJKim .
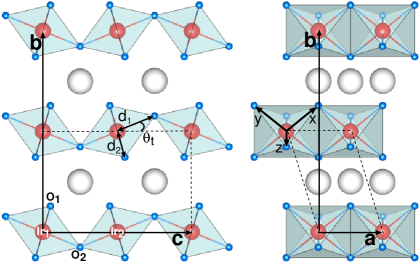
Here we focus on the post-perovskite CaIrO3 with a highly anisotropic geometry where IrO6 octahedra share corners along the axis and have common edges along the axis (see Fig. 1). Recently, the nature of the ground state in CaIrO3 has been an object of hot debate Ohgushi2 ; Ohgushi ; Sala ; Subedi ; Bogdanov . On the basis of resonant x-ray magnetic scattering (RMXS) experiment, Ohgushi Ohgushi claimed the robustness of the = 1/2 ground state against structural distortions. However, a resonant inelastic x-ray scattering (RIXS) experiment of Sala . Sala concluded that CaIrO3 is not a = 1/2 iridate by showing that the = 1/2 state is severely altered by a large tetragonal crystal field splitting, therefore proposing the existence of Mott insulator beyond the = 1/2 ground state. On the theoretical side, using density-functional theory (DFT) calculations within the local density approximation (LDA) including SOC, Subedi Subedi interpreted the states in terms of the = 1/2 and = 3/2 states, and further showed that the introduction of splits the = 1/2 bands into fully occupied lower and unoccupied upper Hubbard bands, thereby supporting the Mott-Hubbard scenario. Contrasting with the = 1/2 ground state generated by equally hybridizing the three , , and orbitals Ohgushi , wave-function quantum chemical calculation Bogdanov predicted the highly uneven admixture of , , and characters for the relativistic states. Therefore, previous experimental and theoretical studies of CaIrO3 have not reached a consensus on the presence of the = 1/2 ground state, but concluded in the same way that CaIrO3 belongs to a Mott-Hubbard insulator. Despite such a contradiction for the nature of the ground state, it is well established Ohgushi ; Sala ; Subedi ; Bogdanov that the insulating ground state of CaIrO3 exhibits the stripe-type magnetic order with a strong antiferromagnetic (AFM) coupling along the axis and a weak ferromagnetic one along the axis (hereafter designated as the AFM structure).
In this Letter, we investigate the nature of the ground state of CaIrO3 by using comprehensive DFT calculations with local, semilocal, and hybrid exchange-correlation functionals as well as by including dynamical mean field theory (DMFT). We find that the states are significantly split by a compression of IrO6 octahedra along the axis and particularly two states (designated as and ) have dominant and characters with large band dispersions, indicating one-dimensional (1D) electronic states along the axis. Our hybrid DFT calculation adequately describes the delocalized and states to stabilize the AFM order along the axis via superexchange interaction between Ir4+ spins. Moreover, the SOC is found to hybridize the and states with other states to open an insulating gap. It is thus elucidated that the gap formation in CaIrO3 is driven by the interplay between a long-range AFM order and the SOC, representing a spin-orbit Slater insulator. This Slater mechanism for the gap formation in CaIrO3 is further supported by the DFT+DMFT calculation.
We first study the ground state of CaIrO3 using the LDA, GGA, and hybrid DFT calculations method without SOC. Interestingly, the different ground states are predicted depending on the employed exchange-correlation functionals: i.e., the CA functional predicts the nonmagnetic (NM) ground state, while the PBE and HSE functionals favor the AFM structure over the NM structure by = 21.1 and 85.8 meV per primitive unit cell, respectively. The calculated structural parameters of Ir-O bond lengths ( and in Fig. 1) and tilt angle ( in Fig. 1) change little depending on the employed exchange-correlation functionals. Our values of / 0.96 and 23∘ indicate that the IrO6 octahedra are compressed along the axis with a large tilt, in good agreement with an XRD analysis Hirai and a previous LDA calculation Subedi (see Table IIS of the Supplemental Material Supple ). Figure 2(a) shows the LDA band structure of the NM structure together with -orbitals projected bands and the charge characters of the states. There are six bands originating from two different Ir atoms within the primitive unit cell, which are grouped into two doublets ( and ) and two singlets ( and ). We find the presence of partially occupied states crossing , indicating a metallic feature. It is seen in Fig. 2(a) that (i) the and doublets are significantly separated by 1.5 eV at the point and (ii) the low(high)-lying () states involve dominantly ( and ) component(s). These different orbital characters of and can be attributed to a tetragonal crystal field due to the compressed IrO6 octahedra along the axis. In addition, the and states also have dominant and characters with a large band width of 2.5 eV, indicating 1D electronic states along the axis. As shown in the inset in Fig. 2(a), the charge character of (or ) shows a strong hybridization with O 2 orbitals along the axis, reflecting its 1D band feature. This 1D features of the and states play an important role in determining the electronic and magnetic properties of CaIrO3, as discussed below.
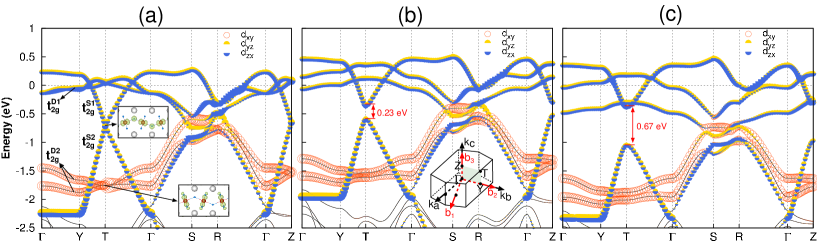
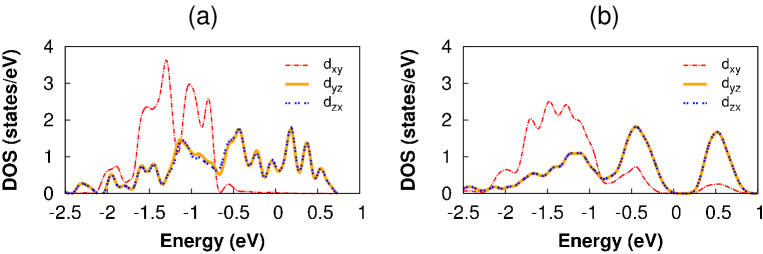
Figure 2(b) and 2(c) show the PBE and HSE band structures of the AFM structure, respectively. Here, the overall band dispersion of the AFM structure is similar to that [Fig. 2(a)] of the NM structure. However, there are two conspicuous changes in the AFM band structure: i.e., one is a gap opening of the and singlets at the point and the other is some separation of the two bands in the doublet. We obtain = 0.23 eV [Fig. 2(b)] and 0.67 eV [Fig. 2(c)] from PBE and HSE, respectively. To understand the microscopic mechanism for these changes in the AFM band structure, we plot the spin-polarized -orbitals projected bands (see Fig. 5S of the Supplemental Material Supple ). We find that the and states (or the two states in ) with the same spin direction, localized at two different Ir sites, hybridize with each other, yielding an energy gain from the exchange kinetic energy and the formation of Sato . This so-called superexchange interaction Goodenough ; Kanamori between Ir4+ spins results in the stabilization of the AFM order along the axis. Our finding that the , , and states with and characters are associated with the AFM order does not support the interpretation of previous RMXS experiment Ohgushi that the = 1/2 state stabilizes the AFM order. In Table I, we list the calculated magnetic moments of Ir and O atoms in the AFM structure. Our HSE calculation gives a spin magnetic moment = 0.48 (0.07) for Ir (O1) atoms, larger than = 0.31 (0.05) computed using PBE. We note that the LDA and GGA tend to stabilize artificially delocalized electronic states due to their inherent self-interaction error because delocalization reduces the spurious self-repulsion of electrons SIE1 ; SIE2 . This aspect of LDA and GGA may account for why our LDA calculation predicts a metallic NM ground state and our PBE values of and are relatively smaller than the corresponding HSE ones (see Table I).
Next, we examine the effect of SOC on the geometry and band structure of the AFM structure using PBE+SOC and HSE+SOC method . As shown in Table IIS of the Supplemental Material, the inclusion of SOC changes little / and by less that 0.01 and 1∘, respectively. Figures 3(a) and 3(b) show the PBE+SOC and HSE+SOC band structures of the AFM structure, respectively. Compared to the PBE [Fig. 2(b)] and HSE [Fig. 2(c)] results, -orbitals projected bands clearly show that the inclusion of SOC does not change the , , and characters of the , , and states, but gives rise to their strong hybridizations leading to well-separated bands with hybridization gaps. This result doesn’t support the = 1/2 ground-state picture proposed by RMXS experiment Ohgushi , where SOC can dramatically affect the states to produce the = 1/2 state by equally mixing up the , , and orbitals. We note that for the state near , the partial densities of states (PDOS) of the , , and orbitals obtained using HSE give a ratio of 0%:50%:50%, but change into 8%:46%:46% for the HSE+SOC calculation [see Fig. 6S of the Supplemental Material]. The latter PDOS ratio of , , and is very consistent with the interpretation of RIXS experiment Sala that the state near was estimated as + 0.67 ((). As a consequence of the SOC-induced hybridization, PBE+SOC still does not open an insulating gap [Fig. 3(a)], but HSE+SOC opens = 0.32 eV [Fig. 3(b)], close to the experimental data of 0.34 eV Ohgushi2 . Especially, the DOS [see Fig. 3(b)] obtained using HSE+SOC explains well the two - interband transitions observed in RIXS experiment DOS . It is noteworthy that the gap opening in HSE+SOC can be realized by the strong interplay between a long-range AFM order and the SOC: i.e., the enhanced separation of the and bands in the AFM structure [see Fig. 2(c)] and the SOC-induced hybridization are combined to yield the opening of an insulating gap. Thus, we can say that the single-particle band theory within the HSE+SOC scheme predicts well the magnetic-insulating ground state of CaIrO3, being represented as a spin-orbit Slater insulator.
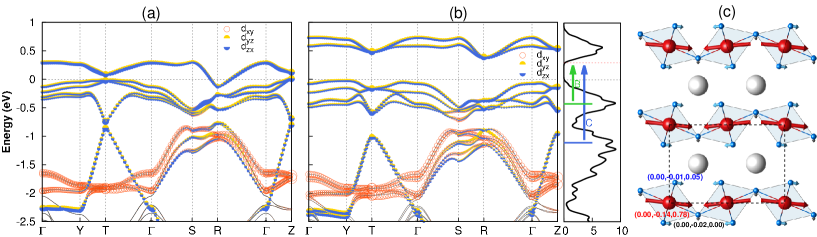
Figure 3(c) shows the sum of the spin and orbital magnetic moments of Ir and O atoms, obtained using HSE+SOC. The total magnetic moment for Ir, O1, and O2 atoms is (0.00, 0.14, 0.78), (0.00, 0.01, 0.05), and (0.00, 0.02, 0.00) in units of , respectively, showing an antiparallel alignment of magnetic moments along the c axis. Here, the Ir magnetic moments are canted along the axis with 11∘, comparable with those (24∘) reported from RMXS Ohgushi and RIXS Sala experiments.
| Ir | O1 | O2 | |
|---|---|---|---|
| PBE | 0.31 | 0.05 | 0.00 |
| HSE | 0.48 | 0.07 | 0.00 |
| PBE+SOC | 0.16(0.08) | 0.02(0.00) | 0.00(0.00) |
| HSE+SOC | 0.45(0.34) | 0.05(0.01) | 0.01(0.01) |

Finally, in order to confirm the Slater mechanism for the gap formation in CaIrO3, we perform the DFT+DMFT calculation Supple ; DMFT for the AFM and paramagnetic phases. Figure 4(a) shows the DFT+DMFT results for the one-particle spectra. It is seen that the AFM insulating phase is transformed into a paramagnetic metallic phase PM around 230 K. Below this metal-insulator transition (MIT) temperature, the magnetic moment of Ir atom sharply increases [see Fig. 4(b)], indicating that the MIT and the paramagnetic to AFM phase transition are concomitant with each other. The calculated spectral function for the AFM ground state is displayed in Fig. 7S of the Supplemental Material Supple , together with the superimposition of the HSE+SOC band structure. Both results are in good agreement with each other. Therefore, both the comprehensive DFT calculations and the DFT+DMFT calculation reach a consistent conclusion that the gap opening is induced by the AFM order, representing a Slater-type insulator.
In conclusion, our comprehensive DFT calculations with local, semilocal, and hybrid exchange-correlation functionals clarified the effects of tetragonal crystal field, AFM order, and SOC on the states of CaIrO3. We found the large tetragonal crystal field splitting of the states, resulting in the formations of doublet (with and characters), doublet (with character), and and singlets (with and characters). We also found that the insulating-gap opening is formed by the interplay between a long-range AFM order and the SOC, representing a spin-orbit Slater insulator. This single-particle based Slater picture is further supported by the DFT+DMFT calculation. Our findings are anticipated to stimulate further experimental and theoretical studies for other iridates such as Sr2IrO4 BJKim ; BJKim2 ; SJMoon and Na2IrO3 Shitade ; Comin ; Gretarsson which have been proposed to be a = 1/2 Mott-Hubbard insulator.
Acknowledgement. This work was supported by National Research Foundation of Korea (NRF) grant funded by the Korea Government (2015R1A2A2A01003248). The calculations were performed by KISTI supercomputing center through the strategic support program (KSC-2014-C3-011) for the supercomputing application research. Research at Ames Laboratory was supported by the U.S. DOE, Office of Basic Energy Sciences, Division of Materials Sciences and Engineering. Ames Laboratory is operated for the U.S. Department of Energy by Iowa State University under Contract No. DE-AC02-07CH11358.
Corresponding authors: ∗chojh@hanyang.ac.kr, †ykent@iastate.edu
References
- (1) N. F. Mott, Metal-Insulator Transitions (Taylor Francis, London/Philadelphia, 1990).
- (2) M. Imada, A. Fujimori, and Y. Tokura, Rev. Mod. Phys. 70, 1039 (1998).
- (3) B. J. Kim, H. Jin, S. J. Moon, J.-Y. Kim, B.-G. Park, C. S. Leem, J. Yu, T. W. Noh, C. Kim, S.-J. Oh, J.-H. Park, V. Durairaj, G. Cao, and E. Rotenberg, Phys. Rev. Lett. 101, 076402 (2008).
- (4) B. J. Kim, H. Ohsumi, T. Komesu, S. Sakai, T. Morita, H. Takagi, and T. Arima, Science 323, 1329 (2009).
- (5) S. J. Moon, H. Jin, W. S. Choi, J. S. Lee, S. S. A. Seo, J. Yu, G. Cao, T. W. Noh, and Y. S. Lee, Phys. Rev. B 80, 195110 (2009).
- (6) R. Arita, J. Kuneš, A. V. Kozhevnikov, A.G. Eguiluz, and M. Imada, Phys. Rev. Lett. 108, 086403 (2012).
- (7) Q. Li, G. Cao, S. Okamoto, J. Yi, W. Lin, B. C. Sales, J. Yan, R. Arita, J. Kuneš, A. V. Kozhevnikov, A. G. Eguiluz, M. Imada, Z. Gai, M. Pan, and D. G. Mandrus, Sci. Rep. 3, 3073 (2013).
- (8) A. Shitade, H. Katsura, J. Kuneš, X.-L Qi, S.-C. Zhang, and N. Nagaosa, Phys. Rev. Lett. 102, 256403 (2009).
- (9) R. Comin, G. Levy, B. Ludbrook, Z.-H. Zhu, C. N. Veenstra, J. A. Rosen, Y. Singh, P. Gegenwart, D. Stricker, J. N. Hancock, D. van der Marel, I. S. Elfimov, and A. Damascelli, Phys. Rev. Lett. 109, 266406 (2012).
- (10) H. Gretarsson, J. P. Clancy, X. Liu, J. P. Hill, E. Bozin, Y. Singh, S. Manni, P. Gegenwart, J. Kim, A. H. Said, D. Casa, T. Gog, M. H. Upton, H.-S. Kim, J. Yu, V. M. Katukuri, L. Hozoi, J. van den Brink, and Y.-J. Kim, Phys. Rev. Lett. 110, 076402 (2013).
- (11) K. Ohgushi, H. Gotou, T. Yagi, Y. Kiuchi, F. Sakai and Y. Ueda, Phys. Rev. B 74, 241104 (2006).
- (12) K. Ohgushi, J.-I. Yamaura, H. Ohsumi, K. Sugimoto, S. Takeshita, A. Tokuda, H. Takagi, M. Takata, and T.-H. Arima, Phys. Rev. Lett. 110, 217212 (2013).
- (13) M. M. Sala, K. Ohgushi, A. Al-Zein, Y. Hirata, G. Monaco, and M. Krisch, Phys. Rev. Lett. 112, 176402 (2014).
- (14) A. Subedi, Phys. Rev. B 85, 020408 (2012).
- (15) N. A. Bogdanov, V.M. Katukuri, H. Stoll, J. van den Brink, and L. Hozoi, Phys. Rev. B 85, 235147 (2012).
- (16) J. C. Slater, Phys. Rev. 82, 538 (1951).
- (17) S. Calder, V. O. Garlea, D. F. McMorrow, M. D. Lumsden, M. B. Stone, J. C. Lang, J.-W. Kim, J. A. Schlueter, Y. G. Shi, K. Yamaura, Y. S. Sun, Y. Tsujimoto, and A. D. Christianson, Phys. Rev. Lett. 108, 257209 (2012).
- (18) H.-J. Kim, J.-H. Lee, and J.-H. Cho, Sci. Rep. 4, 5253 (2014).
- (19) We have performed not only the local (LDA), semilocal (GGA), and hybrid DFT calculations using the Vienna simulation package (VASP) with the projector augmented wave method [Kresse and Hafner, Phys. Rev. B 48, 13115 (1993); Kresse and Furthmüller, Comput. Mater. Sci. 6, 15 (1996)] but also the DFT+DMFT calculation using the WIEN2K package (see Supplemental Material). For the exchange-correlation energy, we employed the LDA functional of Ceperley-Alder (CA) [Ceperley and Alder, Phys. Rev. Lett. 45, 566 (1980)], the GGA functional of Perdew-Burke-Ernzerhof (PBE) [Perdew, Burke, and Ernzerhof, Phys. Rev. Lett. 77, 3865 (1996);78, 1396(E) (1997)], and the hybrid functional of Heyd-Scuseria-Ernzerhof (HSE) [Heyd, Scuseria, and Erzerhof, J. Chem. Phys. 118, 8207 (2003); Krukau , J. Chem. Phys. 125, 224106 (2006)]. Since the HSE+SOC calculation with a mixing factor of = 0.08 (in the HSE functional) controlling the amount of exact Fock exchange energy predicts well the observed insulating gap of 0.34 eV Ohgushi2 , we used this optimal value for the HSE and HSE+SOC calculations. We employed the primitive unit cell in the structure (see Fig. 1), with the experimental lattice constants = 3.145, = 9.855, and = 7.293 Å [Fritz and Dietrich, Z. Anorg. Allg. Chem. 336, 17 (1965)]. The -space integration was done with the 955 uniform meshes in the Brillouin zone. All atoms were allowed to relax along the calculated forces until all the residual force components were less than 0.01 eV/Å.
- (20) S. Hirai, M. Welch, F. Aguado, and S. Redfern, Z. Kristallogr. 224, 345 (2009).
- (21) See Supplemental Material which includes Refs. Haule1 ; PBE ; Blaha ; Werner ; Haule2 ; Kutepov ; Hongbin for the structural parameters of the optimized structures, the spin-polarized d-orbitals projected band structures, the PDOS of the , , and orbitals, the computational details of the DFT+DMFT calculation, and the spectral function of the AFM state obtained using the DFT+DMFT calculation.
- (22) K. Haule, C.-H. Yee, and K. Kim, Phys. Rev. B 81, 195107 (2010).
- (23) J. P. Perdew, K. Burke, and M. Ernzerhof, Phys. Rev. Lett. 77, 3865 (1996);78, 1396(E) (1997).
- (24) P. Blaha, K. Schwarz, G. K. H. Madsen, D. Kvasnicka and J. Luitz, WIEN2k, An Augmented Plane Wave + Local Orbitals Program for Calculating Crystal Properties (Karlheinz Schwarz, Techn. Universit at Wien, Austria), 2001. ISBN 3-9501031-1-2
- (25) P. Werner, A. Comanac, L. de Medici, M. Troyer, and A. J. Millis, Phys. Rev. Lett. 97, 076405 (2006).
- (26) K. Haule, Phys. Rev. B 75, 155113 (2007).
- (27) A. Kutepov, K. Haule, S.Y. Savrasov, and G. Kotliar, Phys. Rev. B 82, 045105 (2010).
- (28) H. Zhang, K. Haule, and D. Vanderbilt, Phys. Rev. Lett. 111, 246402 (2013).
- (29) K. Sato, L. Bergqvist, J. Kudrnovsky, P. H. Dederichs, O. Eriksson, I. Turek, B. Sanyal, G. Bouzerar, H. Katayama-Yoshida, V. A. Dinh, T. Fukushima, H. Kizaki, and R. Zeller, Rev. Mod. Phys. 82, 1633 (2010).
- (30) J. B. Goodenough, Phys. Rev. 100, 564 (1955).
- (31) J. Kanamori, J. Phys. Chem. Solids 10, 87 (1959).
- (32) P. Mori-Sánchez, A. J. Cohen, and W. Yang, Phys. Rev. Lett. 100, 146401 (2008).
- (33) A. J. Cohen, P. Mori-Sánchez, and W. Yang, Science 321, 792 (2009).
- (34) For intra- excitations, the measured RIXS spectra were fitted to three Pearson functions in the energy range between 0.3 and 1.6 eV below the conduction band edge: i.e., a weak, energy-resolution limited peak (A) with an excitation energy of 0.42 eV and two intense broad features (B and C) centered at 0.65 and 1.22 eV. In order to compare these RIXS excitations with our calculated bands, we plot the density of states (DOS) obtained using HSE+SOC in Fig. 3(b). We find that the calculated DOS exhibits two well-separated energy regions below : i.e., the region I from to 0.8 eV and the region II from 0.8 to 1.3 eV. Here, since the intra- excitations in RIXS spectra were measured in the energy range between 0.3 and 1.6 eV below the conduction band edge, we take the energy range of the region II from 0.8 to 1.3 eV. We estimate the center of each region as = 0.45 eV and = 1.13 eV by using a relation of = DOS() d / DOS() d. Considering that the HSE+SOC band gap is 0.32 eV, the excitation energies of two - transitions are estimated to be 0.77 and 1.45 eV, well comparable with those (0.65 and 1.22 eV) for the B and C features in RIXS experiment. We note that, although the observed A peak cannot be clearly identified from the calculated DOS, it may be associated with the flat bands near [see Fig. 3(b)].
- (35) G. Kotliar, S. Y. Savrasov, K. Haule, V. S. Oudovenko, O. Parcollet, and C. A. Marianetti, Rev. Mod. Phys. 78, 865 (2006).
- (36) In Ref. 11, the resistivity measurement of CaIrO3 with employing a polycrystalline sample showed a paramagnetic insulating behavior above the Nel temperature. Note that the resistivity of polycrystalline iridium oxides was measured to be larger than that of single crystalline counterparts by 103 order because of their grain boundaries [see N. S. Kini et al., J. Phys. Condens. Matter 18, 8205 (2006)]. More elaborate experimental tools such as photoemission spectroscopy, scanning tunneling spectroscopy, and optical spectroscopy will be anticipated to resolve the connection between the AFM order and the MIT in CaIrO3.
Supplemental Material
1. Calculated structural parameters in the optimized structure of CaIrO3
| (Å) | (Å) | (∘) | |
|---|---|---|---|
| LDA | 1.969 | 2.035 | 22.2 |
| PBE | 1.973 | 2.049 | 22.5 |
| PBE+SOC | 1.976 | 2.052 | 22.6 |
| Experiment (Ref.[20]) | 1.972 | 2.049 | 22.3 |
2. Spin-polarized d-orbitals projected band structures
To understand the microscopic mechanism for the antiferromagnetic (AFM) spin ordering in CaIrO3, we plot the spin-polarized -orbitals projected band structures obtained using the HSE calculation in Fig. 5S. It is seen that the doubly degenerate (spin-up and spin-down) states are localized at Ir1 and Ir2 sites. Since electronic states with the same spin direction can hybridize with each other, the hybridization takes place between the spin-up (or spin-down) states localized at the Ir1 and Ir2 sites, yielding not only an energy gain from the exchange kinetic energy but also the formation of hybridization gap (E) or the enhanced energy splitting. This so-called superexchange interaction between Ir4+ spins results in the stabilization of the AFM order along the axis.

3. Partial densities of states of the , , and orbitals
We plot the partial densities of states (PDOS) of the , , and orbitals using the HSE and HSE+SOC calculation in Fig. 6S. For the state above , the PDOS obtained using HSE give a ratio of 0%:50%:50%, but they change into 8%:46%:46% for the HSE+SOC calculation. The latter PDOS ratio of the , , and orbitals is very consistent with the interpretation of RIXS experiment [13] that the state near was estimated as + 0.67 (().
4. Computational details of the DFT+DMFT calculation
The dynamical mean field theory (DMFT) calculations are performed in a fully charge self-consistent way by combining with density functional theory (DFT) using the projection-embedding implementation [22, 35]. The DFT calculations within the generalized gradient approximation (GGA) [23] are carried out using the full-potential linearized augmented plane-wave (FLAPW) method as implemented in the WIEN2K package [24]. In the DMFT part, we solve the quantum impurity model using the continuous-time quantum Monte Carlo method [25, 26]. The local correlated orbitals are projected from a 20eV energy window around the Fermi level. The double-counting functional is expressed as , where and the nominal occupancy of Ir ion in CaIrO3 is . Due to the large energy window, the local Coulomb interaction parameters are relatively system-independent and estimated [27] as eV and eV [28]. We set different local coordinates on each Ir atom in order to simulate the antiferromagnetic structure. With the crystal-field and spin-orbit coupling interactions considered, the effective states are constructed as,
| (1) |
where labels the spin [28]. The value of at low-frequency limit is adopted in our transformation in which . Then the magnitudes of magnetic moments along the magnetization axis can be calculated as, and , where is the difference of the occupation numbers of [28].
5. Spectral function of the AFM state obtained using DFT+DMFT
The calculated spectral function of the AFM ground state is displayed in Fig. 7S, together with the superimposition of the HSE+SOC band structure. Both results are in good agreement with each other.
