11email: ligterink@strw.leidenuniv.nl 22institutetext: Raymond and Beverly Sackler Laboratory for Astrophysics, Leiden Observatory, Leiden University, PO Box 9513, 2300 RA Leiden, The Netherlands 33institutetext: Max-Planck Institut für Extraterrestrische Physik (MPE), Giessenbackstr. 1, 85748 Garching, Germany
Search for methylamine in high mass hot cores
Abstract
Aims. We aim to detect methylamine, CH3NH2, in a variety of hot cores and use it as a test for the importance of photon-induced chemistry in ice mantles and mobility of radicals. Specifically, CH3NH2 cannot be formed from atom addition to CO whereas other NH2-containing molecules such as formamide, NH2CHO, can.
Methods. Submillimeter spectra of several massive hot core regions were taken with the James Clerk Maxwell Telescope. Abundances are determined with the rotational diagram method where possible.
Results. Methylamine is not detected, giving upper limit column densities between 1.9 6.4 1016 cm-2 for source sizes corresponding to the 100 K envelope radius. Combined with previously obtained JCMT data analyzed in the same way, abundance ratios of CH3NH2, NH2CHO and CH3CN with respect to each other and to CH3OH are determined. These ratios are compared with Sagittarius B2 observations, where all species are detected, and to hot core models.
Conclusions. The observed ratios suggest that both methylamine and formamide are overproduced by up to an order of magnitude in hot core models. Acetonitrile is however underproduced. The proposed chemical schemes leading to these molecules are discussed and reactions that need further laboratory studies are identified. The upper limits obtained in this paper can be used to guide future observations, especially with ALMA.
Key Words.:
Astrochemistry - line:identification - methods: observational - stars:formation - ISM:abundances - ISM:molecules1 Introduction
Complex organic molecules are thought to be formed primarily on dust grains in dense cores, see reviews by Herbst & van Dishoeck (2009) and Caselli & Ceccarelli (2012). Before the onset of star formation, the atomic and molecular reservoir is contained in large dark clouds. Due to the high densities ( 104 cm-3) and low temperatures (10 K) reached in these environments, gas-phase species will freeze out on sub-micron sized grains forming ice mantles on timescales shorter than the lifetime of the cloud. It is here that atoms and molecules can potentially react with each other to form the zeroth order ice species like ammonia, methane, water and methanol. UV radiation interacts with these ice mantles by dissociating molecules to produce radicals and by photodesorbing species back to the gas phase. If these radicals are sufficiently mobile, they can find each other on the grain and react to form even more complex first generation (organic) species (Garrod & Herbst, 2006). However, it is not entirely clear if UV radiation is essential to form these complex molecules or whether they can also be formed just by thermal processing and atom bombardment of solid CO with C, N and O atoms (Tielens & Charnley, 1997).
In this context methylamine, CH3NH2, is a particularly interesting molecule, since its formation is hypothesised by Garrod et al. (2008) to be completely dependent on radicals produced by UV photons, and is one of the few molecules that can definitely not be produced in the routes starting from solid CO:
CHCHH
NHNHH
CHNHCH3NH2
These radicals can form in the ice mantles in the dark cloud or in the
protostellar phase through cosmic-ray induced photons and/or UV
photons from the protostar. After gravitational collapse of the cloud
and formation of a protostar, the dust around it will start to warm
up. The increased temperature will cause the radicals to become mobile
on the grains and react with each other, forming methylamine. Further
heating will evaporate the formed methylamine from the grain and
raise its gas-phase abundance.
Another interesting amine-containing molecule is formamide, NH2CHO. This is so far the most abundantly observed amine-containing molecule (Halfen et al., 2011; Bisschop et al., 2007, e.g.,), making it an interesting molecule to compare with other amines like methylamine. In contrast with CH3NH2, this molecule can possibly be produced by reactions of H and N with solid CO. The comparison of the abundances of these two species could potentially give more information about the relative importance of UV-induced versus thermal grain surface reactions.
Hot cores are particularly well-suited to study methylamine. These high mass star-forming regions reach high temperatures between 100 to 300 K and are known for their rich complex organic chemistry (Walmsley, 1992; van Dishoeck & Blake, 1998; Tielens & Charnley, 1997; Ehrenfreund & Charnley, 2000; Caselli & Ceccarelli, 2012). The ice covered grains move inwards to the protostar and will heat up. When sufficient temperatures are reached, molecules will start to desorb depending on their respective binding energies. Less abundant molecules mixed with water ice will desorb together with water around 100 K.
Previous detections of methylamine have all been made toward the galactic center. Kaifu et al. (1974) first detected CH3NH2 in Sagittarius B2 and Orion A. Later that same year Fourikis et al. (1974) reported the detection of methylamine in the same sources, but with a different telescope. Much more sensitive surveys by Turner (1991), Nummelin et al. (2000), Halfen et al. (2013), Belloche et al. (2013) and Neill et al. (2014) also all detected methylamine lines toward SgrB2, with typical inferred abundance ratios with respect to NH2CHO between 0.5 to 3. No detections of methylamine have been reported in sensitive surveys with modern detectors toward Orion, however (Blake et al., 1987; Turner, 1991; Sutton et al., 1995; Schilke et al., 1997; Crockett et al., 2014).
To study the importance of UV processing of ice-covered dust grains, we present the results of searches for methylamine in a number of hot cores (see Table 1). These results are combined and compared with data from Bisschop et al. (2007) and Isokoski et al. (2013), which were taken toward the same hot cores with the same telescope and analysis method and include detections of NH2CHO and other nitrogen-containing species. In Section 2 the observational details are given, followed by the analysis method in Section 3. Section 4 summarizes all the results of our analysis and these are discussed in Section 5. Finally conclusions are drawn in Section 6.
2 Observations
|
Observations were performed with the James Clerk Maxwell Telescope (JCMT) aaaThe James Clerk Maxwell Telescope is operated by the Joint Astronomy Centre on behalf of the Science and Technology Facilities Council of the United Kingdom, the National Research Council of Canada, and (until 31 March 2013) the Netherlands Organisation for Scientific Research. on the sources listed in Table 1 between July 2010 and August 2011. The sources were selected based on their particularly rich chemistry, being isolated, having narrow line widths to prevent line confusion and on their relatively nearby distance (Bisschop et al., 2007; Fontani et al., 2007; Rathborne et al., 2008; Isokoski et al., 2013).
Nummelin et al. (1998) detected methylamine emission lines between 218 to 263 GHz toward Sgr B2N. Therefore the RxA3 front-end double side band receiver, functioning between 210 to 276 GHz, was chosen to observe the hot cores. The 250 and 1000 MHz wide back-end ACSIS configurations were used. A number of methylamine transitions covering a range of excitation energies were selected in this frequency range based on high Einstein coefficients and lack of line confusion (Table 2). However, not all transitions were observed for all sources. The 235735 MHz transition was only recorded for W3(H2O) and the 260293 MHz transition only toward W3(H2O) and NGC 7538 IRS1.
Because double side band spectra were obtained, our spectra contain transitions from two different frequency regimes superposed. To disentangle lines from the two side bands, each source was observed twice with an 8 MHz shift in the local oscillator setting between the two observations. This allows each transition to be uniquely assigned to either of the two side bands.
In the 230 GHz band, the JCMT has a beam size () of 20-21′′. Spectra were scaled from the antenna temperature scale, , to main beam temperature, , by using the main beam efficiency of 0.69 at 230 GHz. Integration times were such that is generally better than 10 mK for data binned to 1.3 km s-1 velocity bins. Noise levels were improved by adding the shifted spectra together in a narrow frequency region around the CH3NH2 lines, effectively doubling the integration time.
|
a Data from JPL database for molecular spectroscopy.
b Transition observed in all sources.
c Only observed in W3(H2O).
d Only observed in W3(H2O) and NGC 7538 IRS1.
3 Data analysis
To analyse the data, exactly the same method as described by
Bisschop et al. (2007) and Isokoski et al. (2013) was used. It will be
shortly reiterated here. The hot core spectra corrected for source
velocity were analysed with the ”Weeds” extension (Maret et al., 2011) of
the Continuum and Line Analysis Single-dish Software (CLASSbbbhttp://www.iram.fr/IRAMFR/GILDAS) coupled
with the Jet Propulsion Laboratory (JPLccchttp://spec.jpl.nasa.gov) database for molecular
spectroscopy (Pickett et al., 1998). Focus was on identifying the transitions of methylamine
listed in Table 2, but other lines in the spectra were
measured as well (see Table 5 Appendix). After each
positive identification the integrated main-beam temperature,
, was determined by gaussian fitting of
the line. From the integrated main-beam intensity the column density
and thus the beam-averaged total
column density could be determined, assuming
Local Thermodynamic Equilibrium (LTE) at a single excitation
temperature :
| (1) |
where is the level degeneracy, the Boltzmann constant, the transition frequency, the dipole moment and S the line strength. is the rotational partition function and is the upper state energy in Kelvin.
In case of a non-detection, upper limits were determined from the Root Mean Square (RMS) of the base line of the spectra in combination with the velocity resolution and line width :
| (2) |
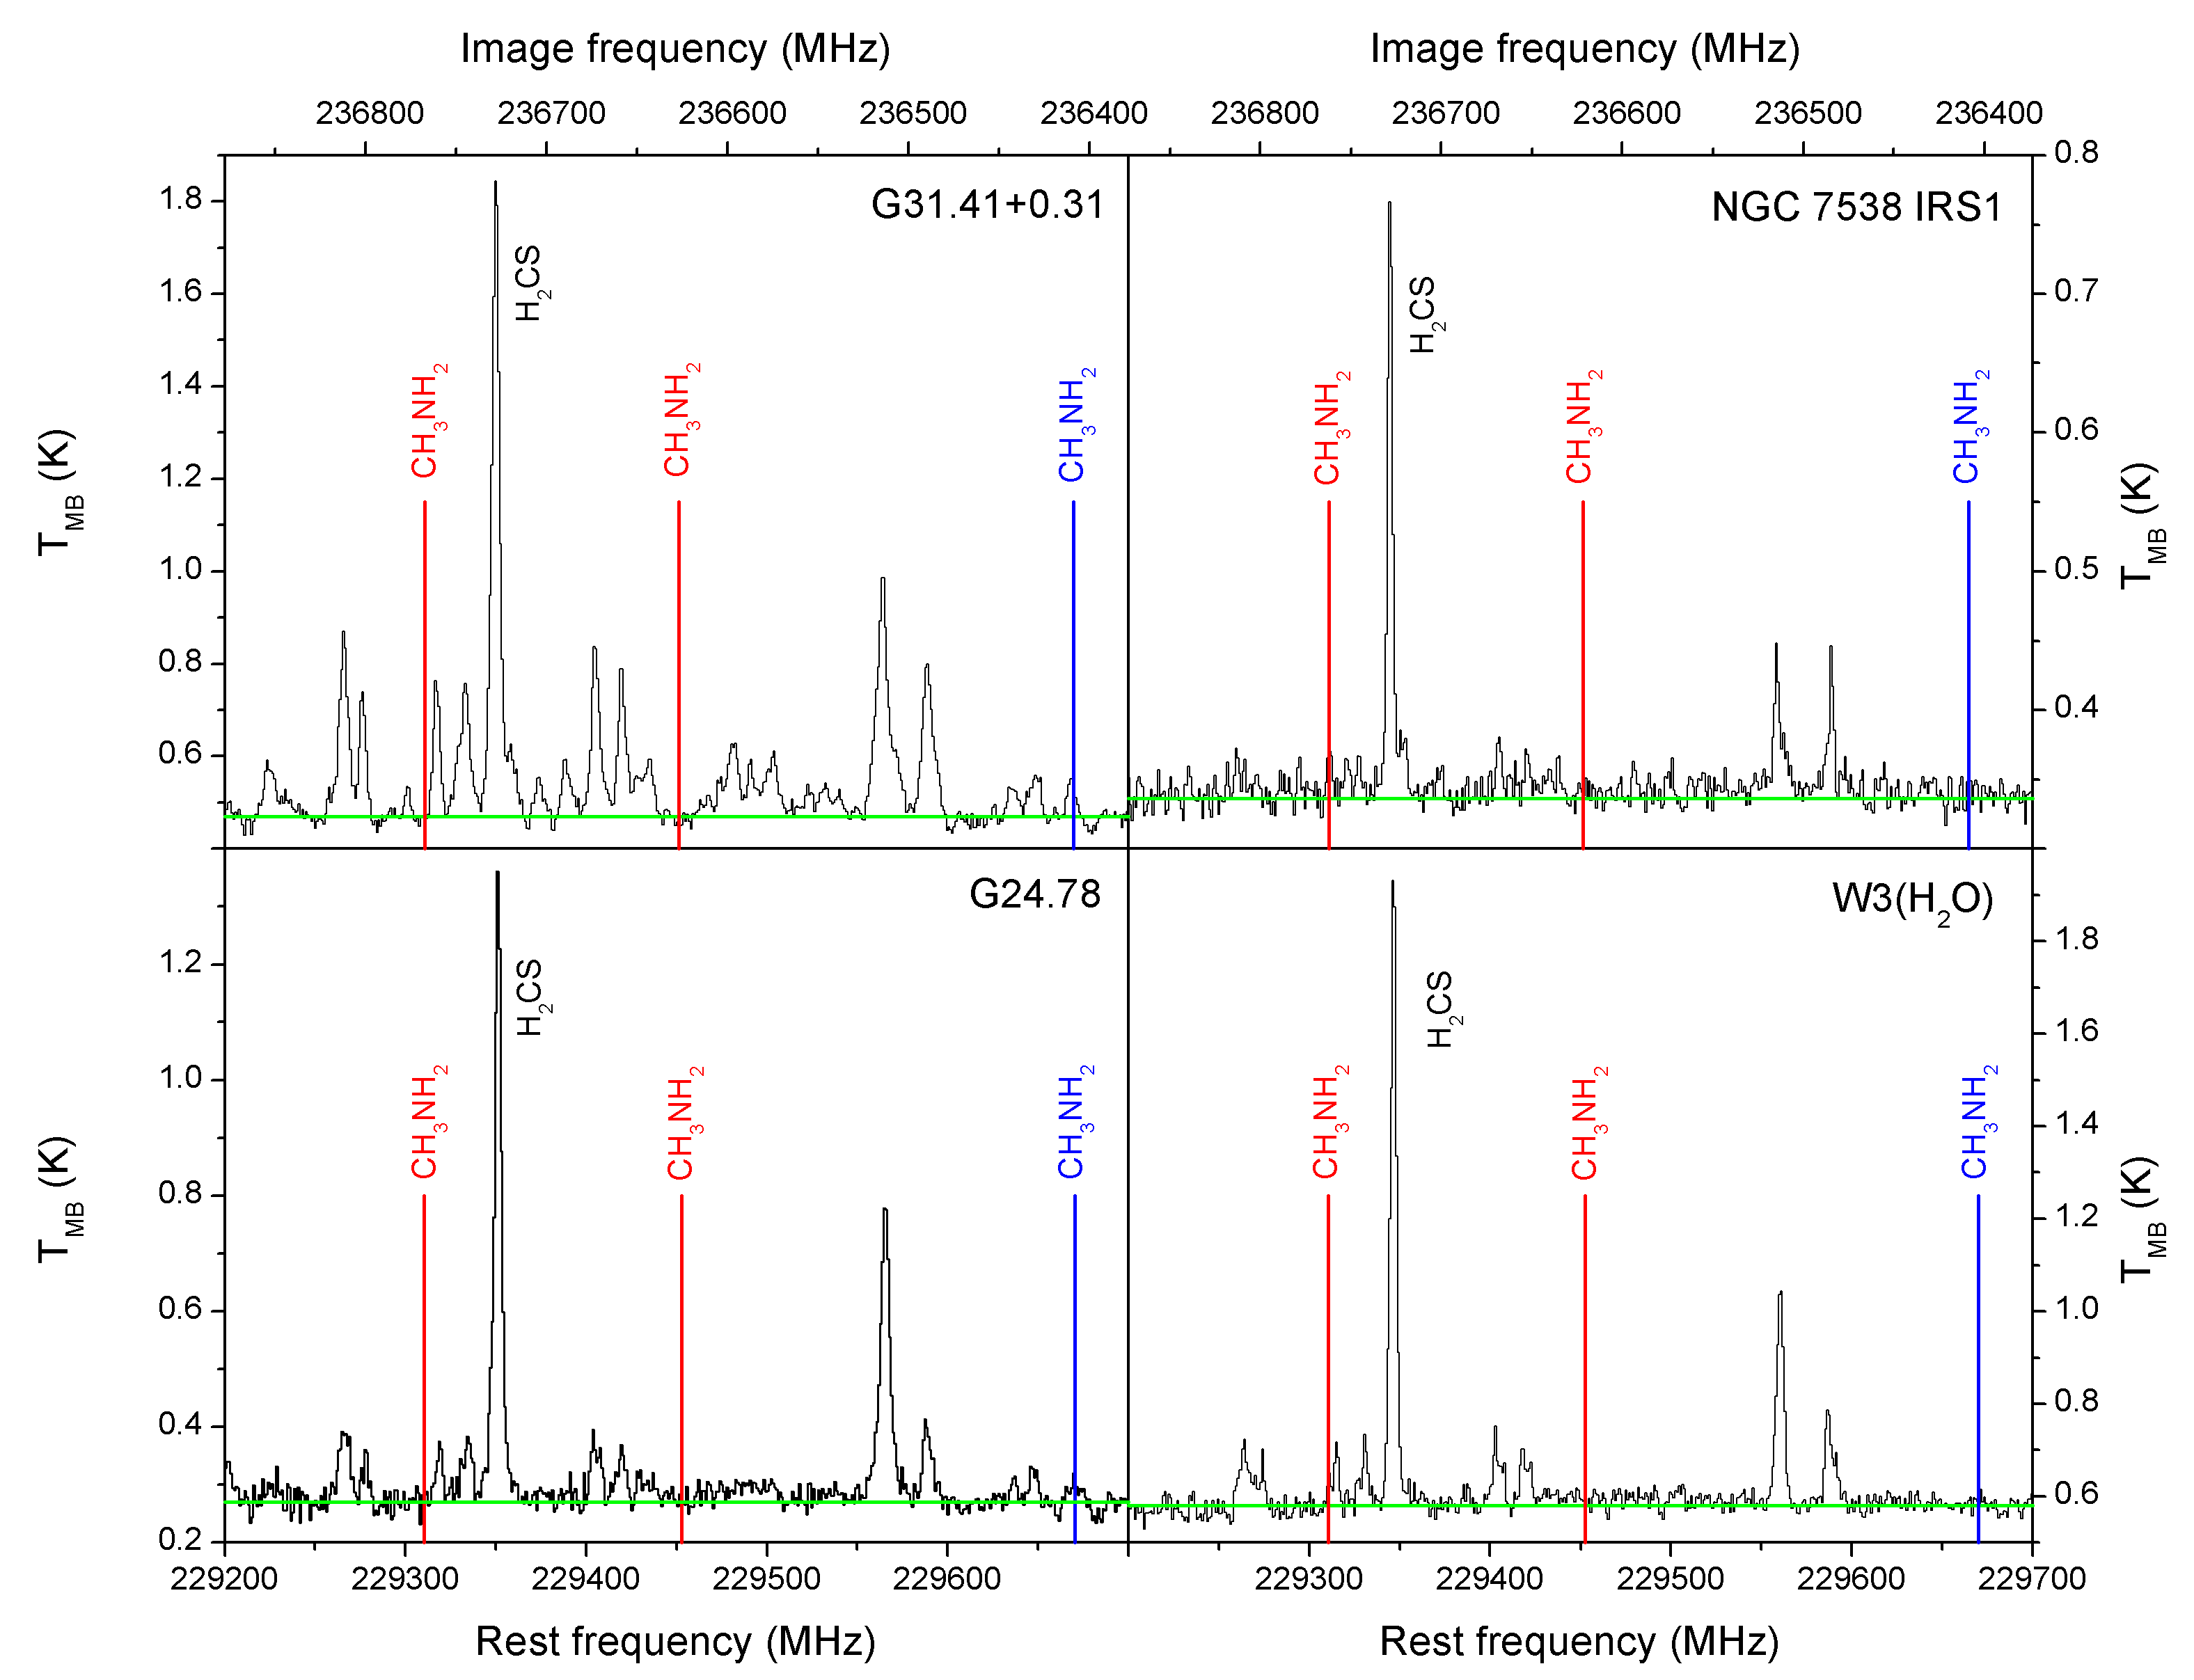
is estimated from other transitions (see Table 1) in the spectra, for example from the nearby H2CS 7 61 transition, and assumed to be the same for all transitions in the spectral range. A telescope flux calibration error of 20% is taken into account in the 1.2 factor. The value is then used in the same way as the main-beam intensity of detected lines to obtain the upper limit on the total column density through Eq. 1.
Since no rotational temperature can be determined for a non-detection, this has to be estimated. In the models of Garrod et al. (2008) the peak abundance temperatures for methylamine range from 117 to 124 K depending on the model used. Öberg (2009) determined that methylamine forms in CH4/NH3 UV irradiation experiments and sublimates at 120 K. There is a small difference between laboratory and hot core desorption temperatures, because of the pressure difference between the two. Also, if CH3NH2 is embedded in water ice the desorption temperature will probably be limited to roughly 100 K, when water desorbs in space. Therefore is assumed to be 120 K when methylamine lines could not be identified, but the effects of lower and higher rotation temperatures are explored as well.
Correction for beam dilution is done in the same way as Bisschop et al. (2007):
| (3) |
resulting in the source-averaged column density:
| (4) |
The beam diameter is set at 21”. For the source diameter, , values have been taken from Bisschop et al. (2007) and Isokoski et al. (2013) and constitute the area where the temperature is 100 K or higher and hot gas-phase molecules are present. Both beam and source diameters are listed in AU in Table 1. Using the CASSIS line analysis software dddCASSIS has been developed by IRAP-UPS/CNRS (http://cassis.irap.omp.eu). it was verified that the source-averaged column densities are still small enough that the observed lines are optically thin.
4 Results and comparison with astrochemical models
4.1 CH3NH2 limits
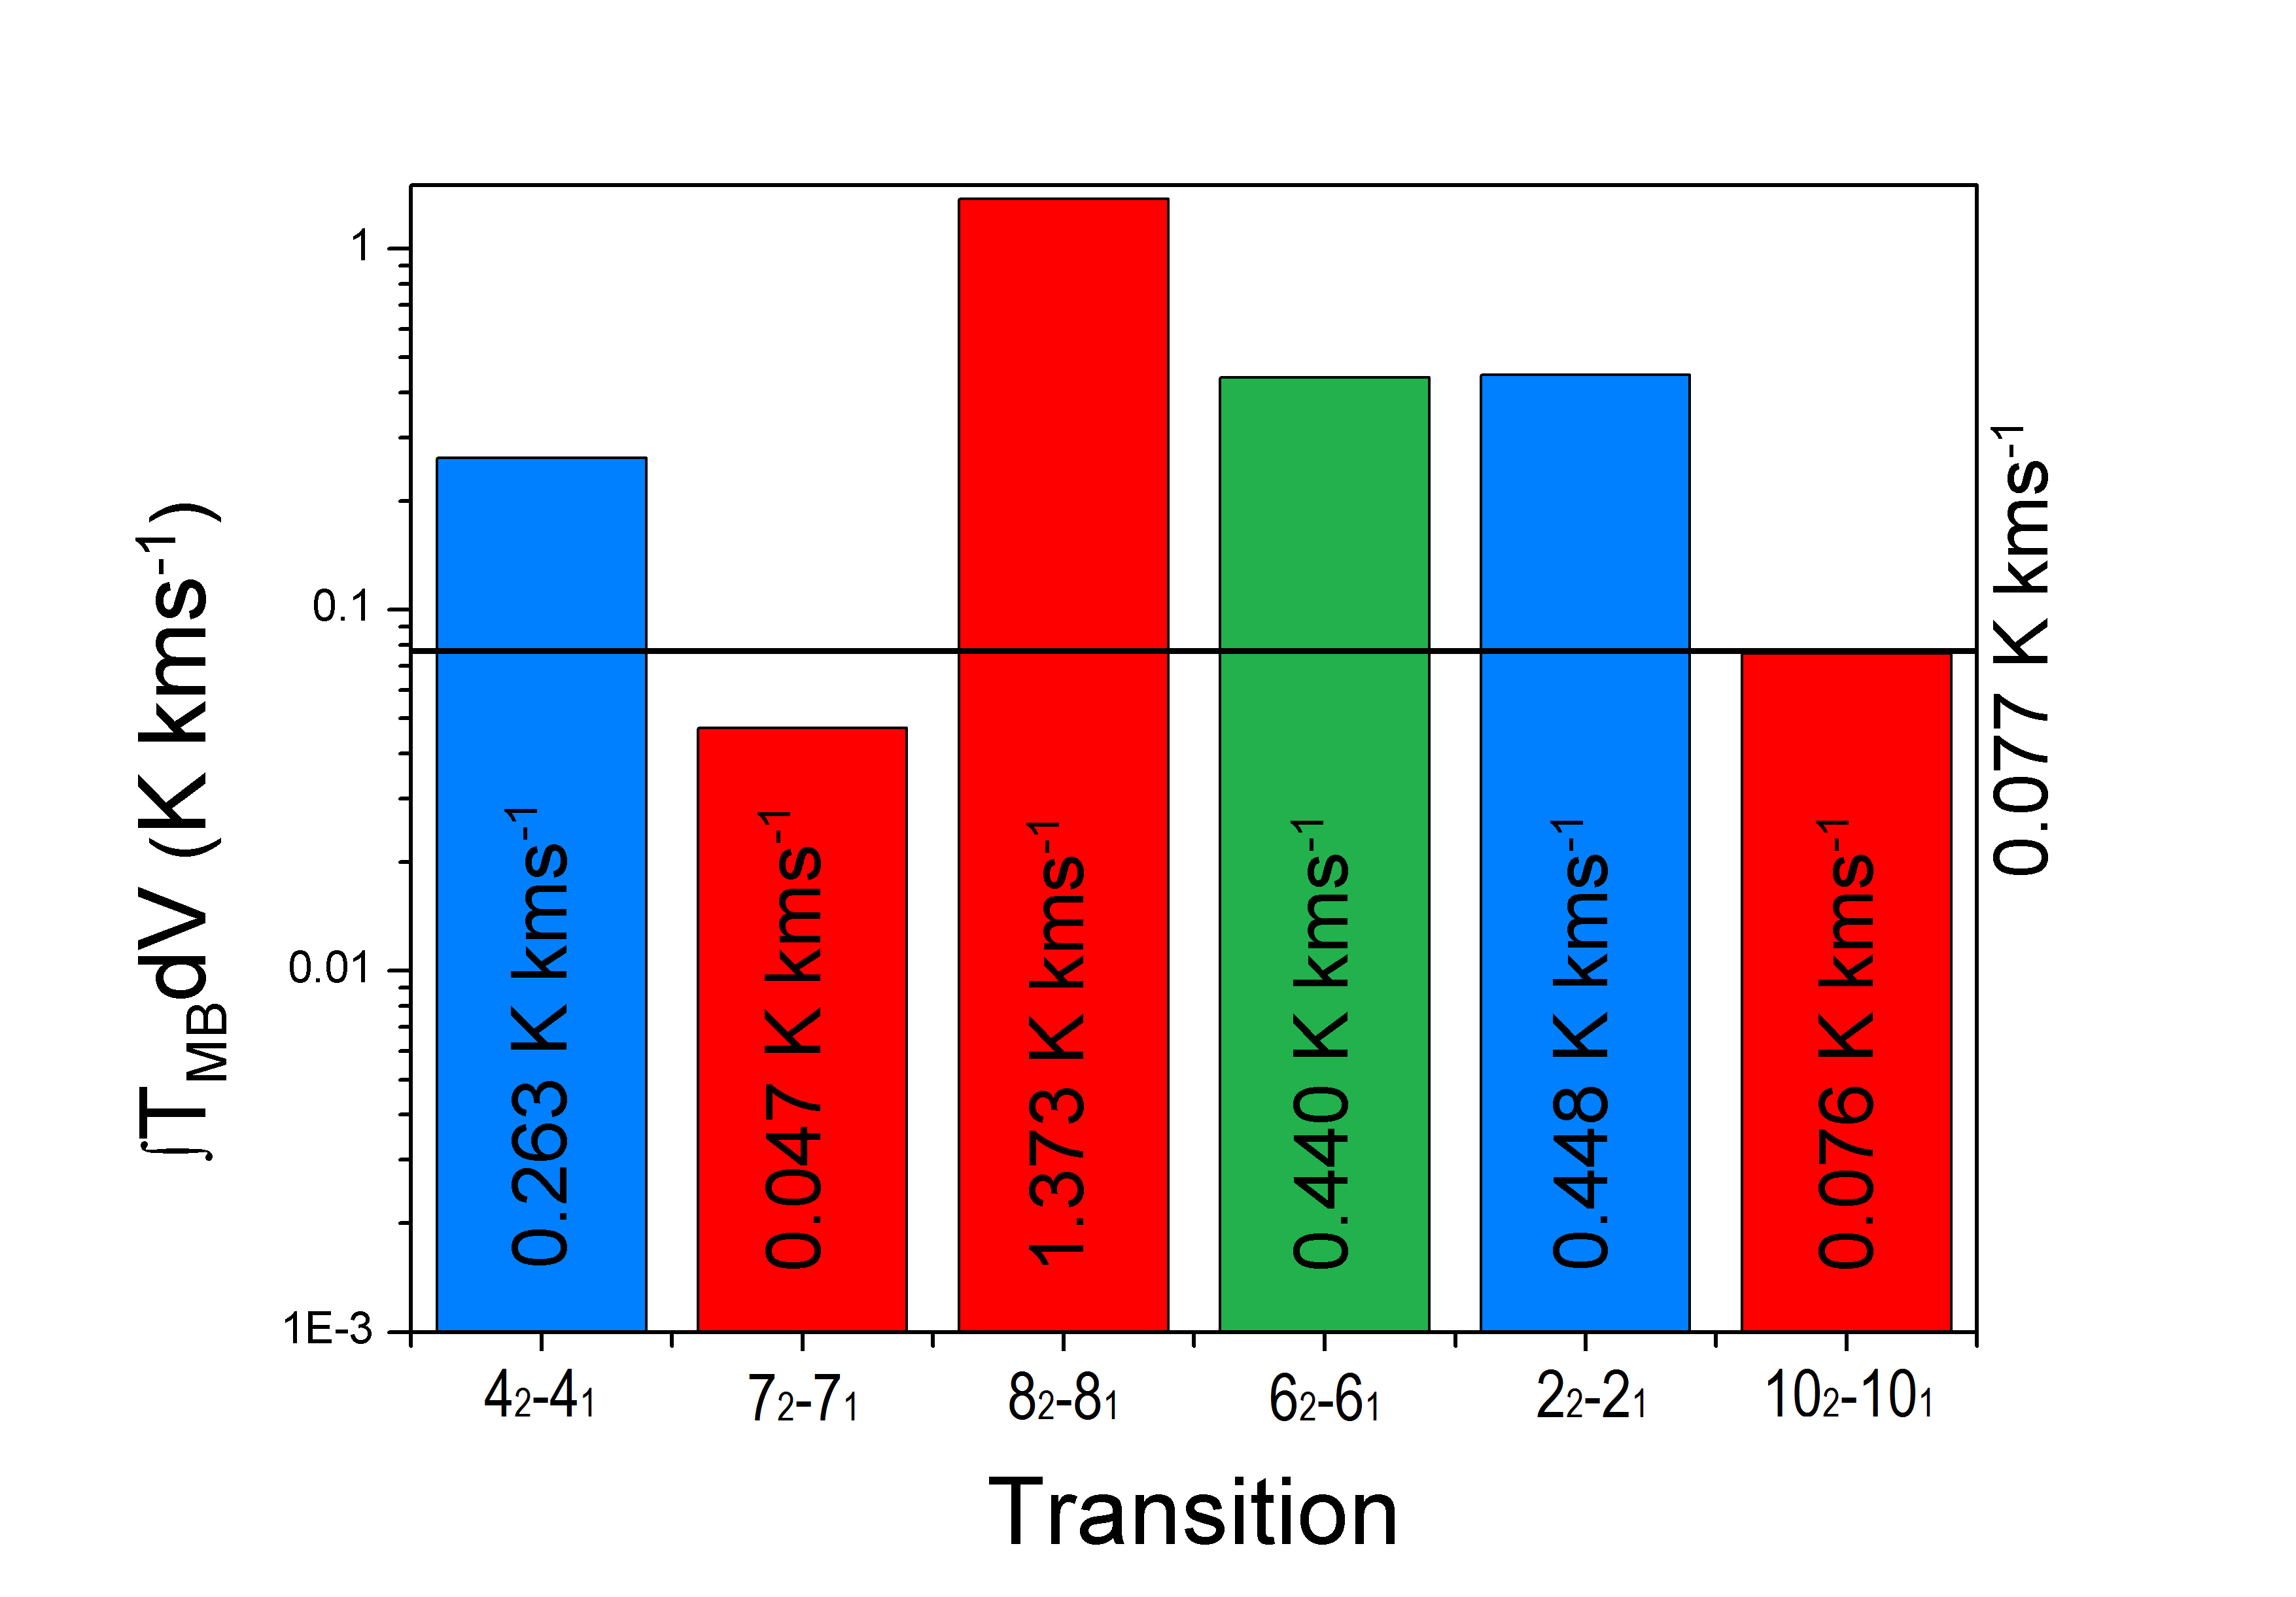
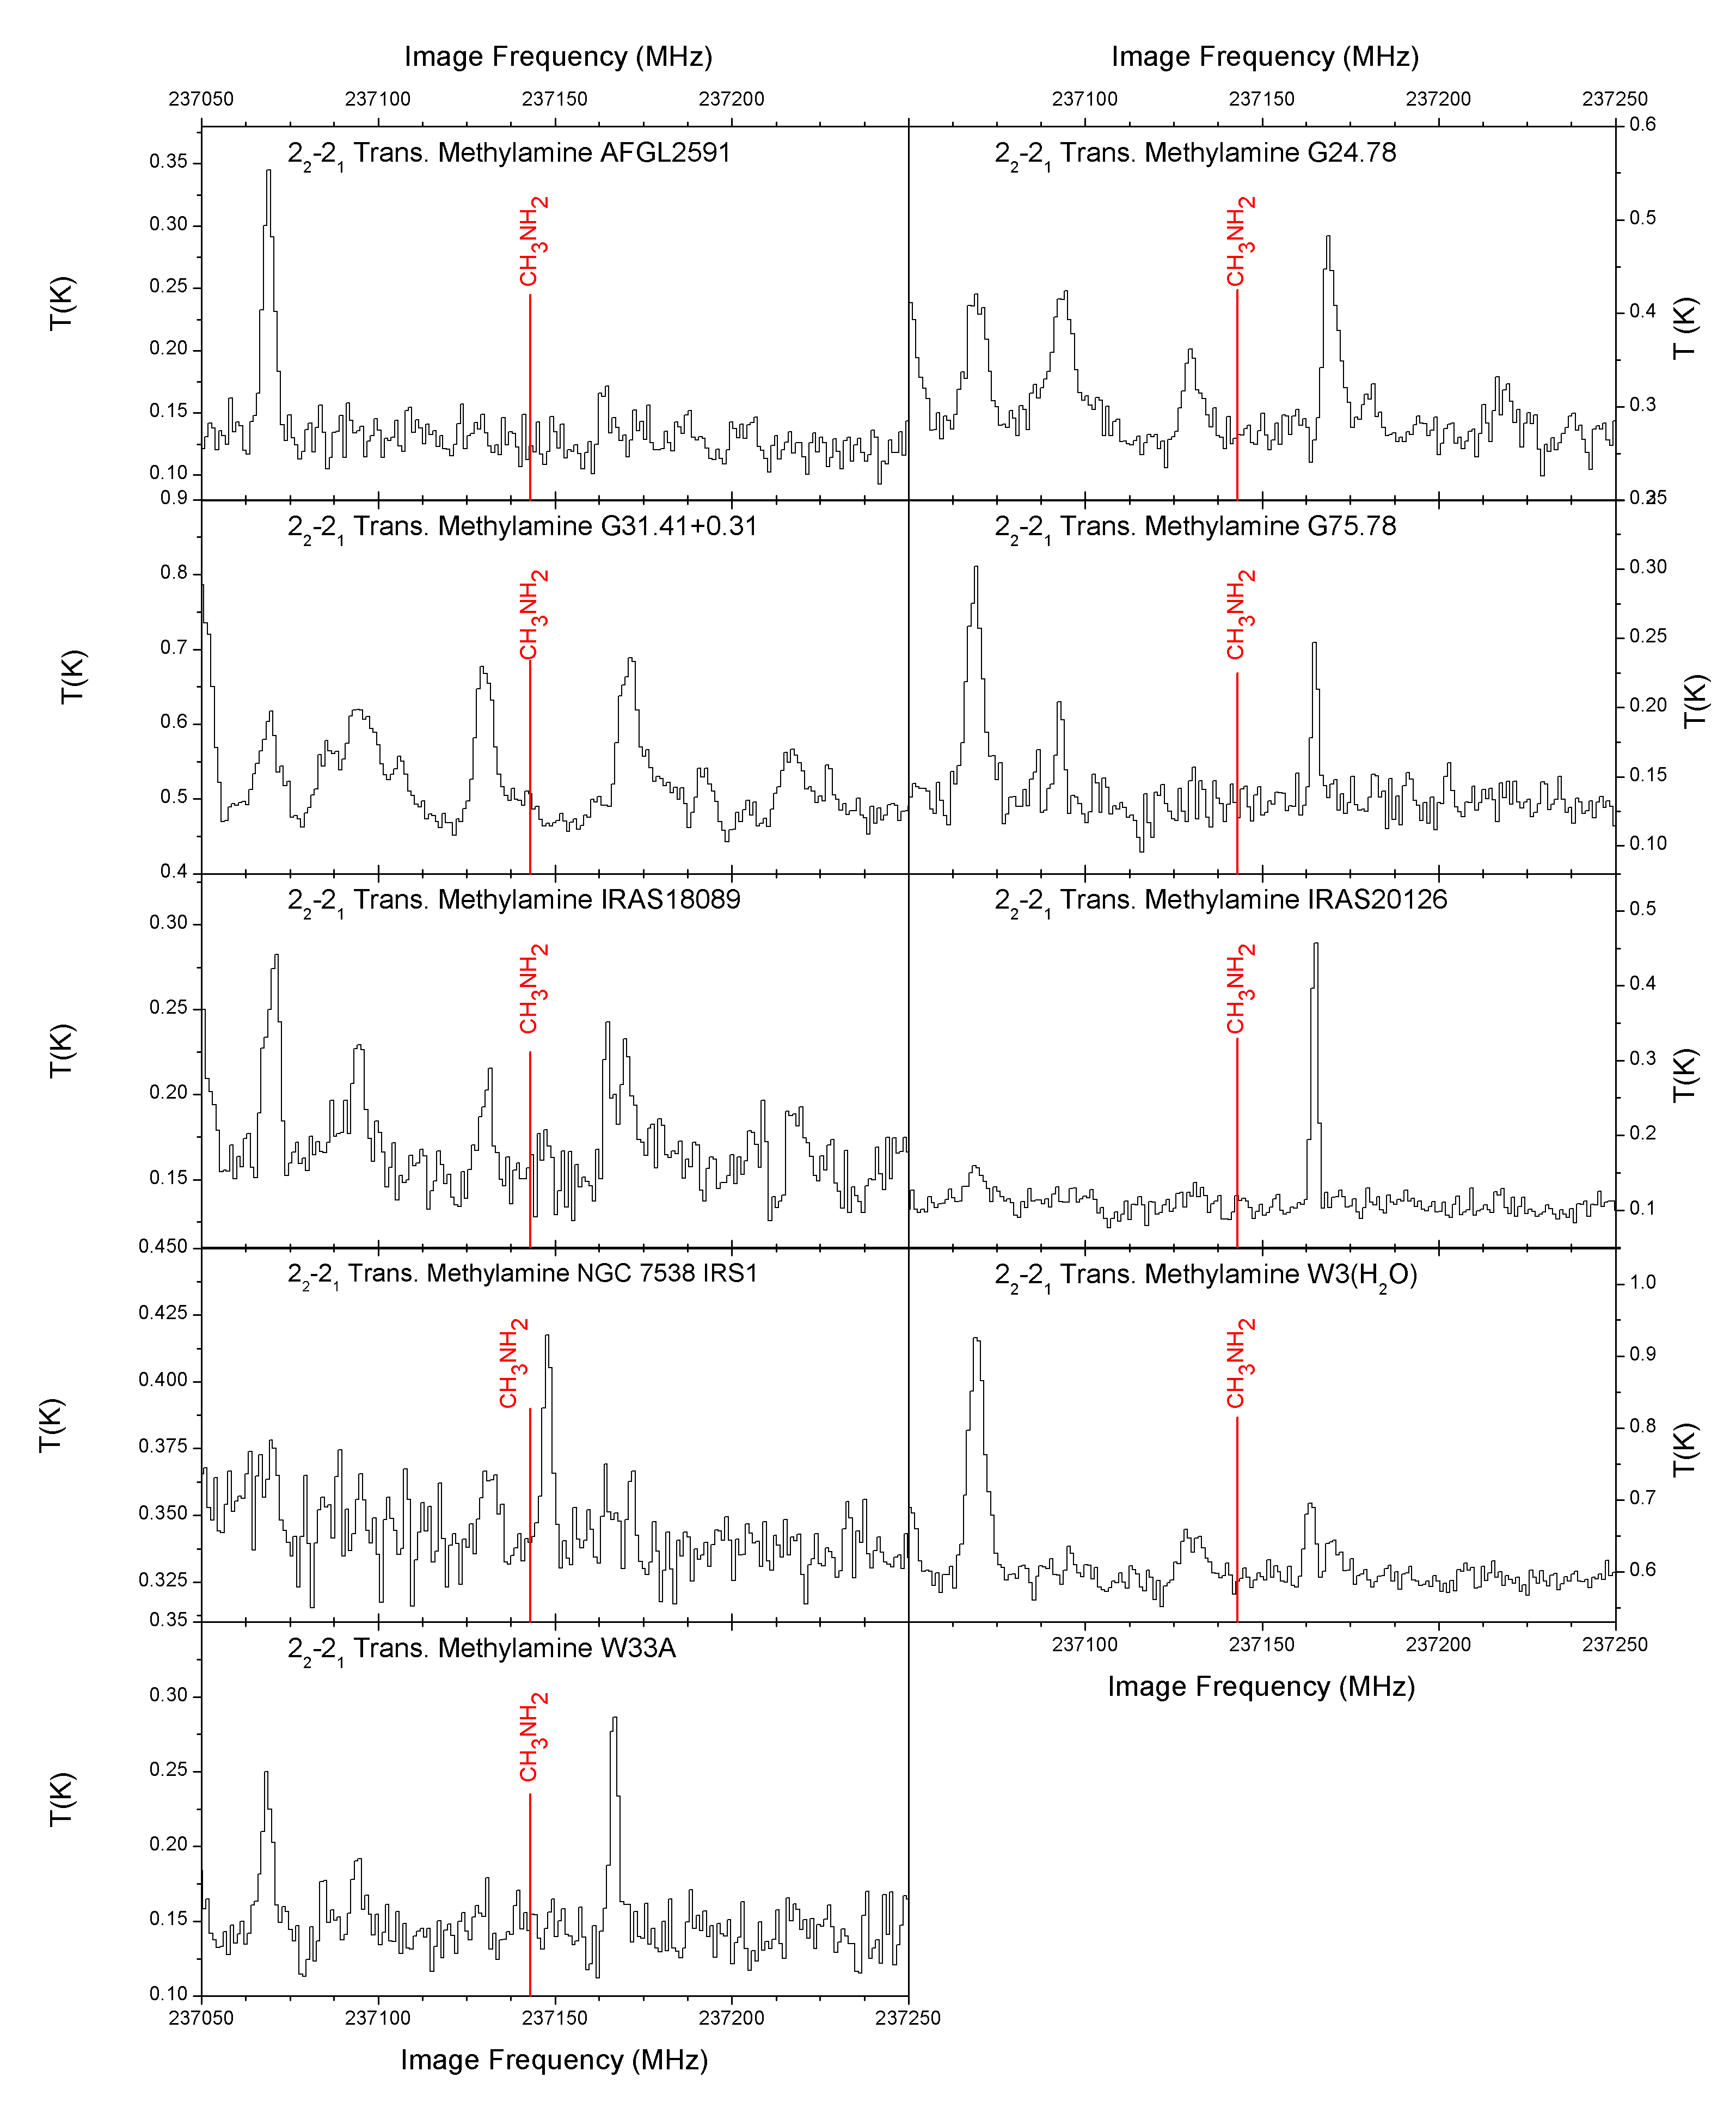
Figure 1 presents examples of spectra obtained for our sources, whereas Figure 4 in the Appendix shows the line in all sources. In general, no transitions of CH3NH2 are detected. Only one possible methylamine transition is identified in G31.41+0.31 coincident with the 62 61 line at 236408 MHz, with an integrated intensity of 0.44 K kms-1. Following the procedure summarized in Section 3, a column density of 3.4 1017 cm-2 is inferred from this line assuming K. However, modelling of the spectrum shows that the other targeted CH3NH2 lines, 42 41 and 22 21, should have comparable or even higher intensities if this identification is correct (Figure 3). The 82 81 line should be readily detected but was not observed toward G31.41+0.31. This makes it unlikely that the detected feature belongs to methylamine, since we would expect to see at least two other CH3NH2 transitions in our spectrum.
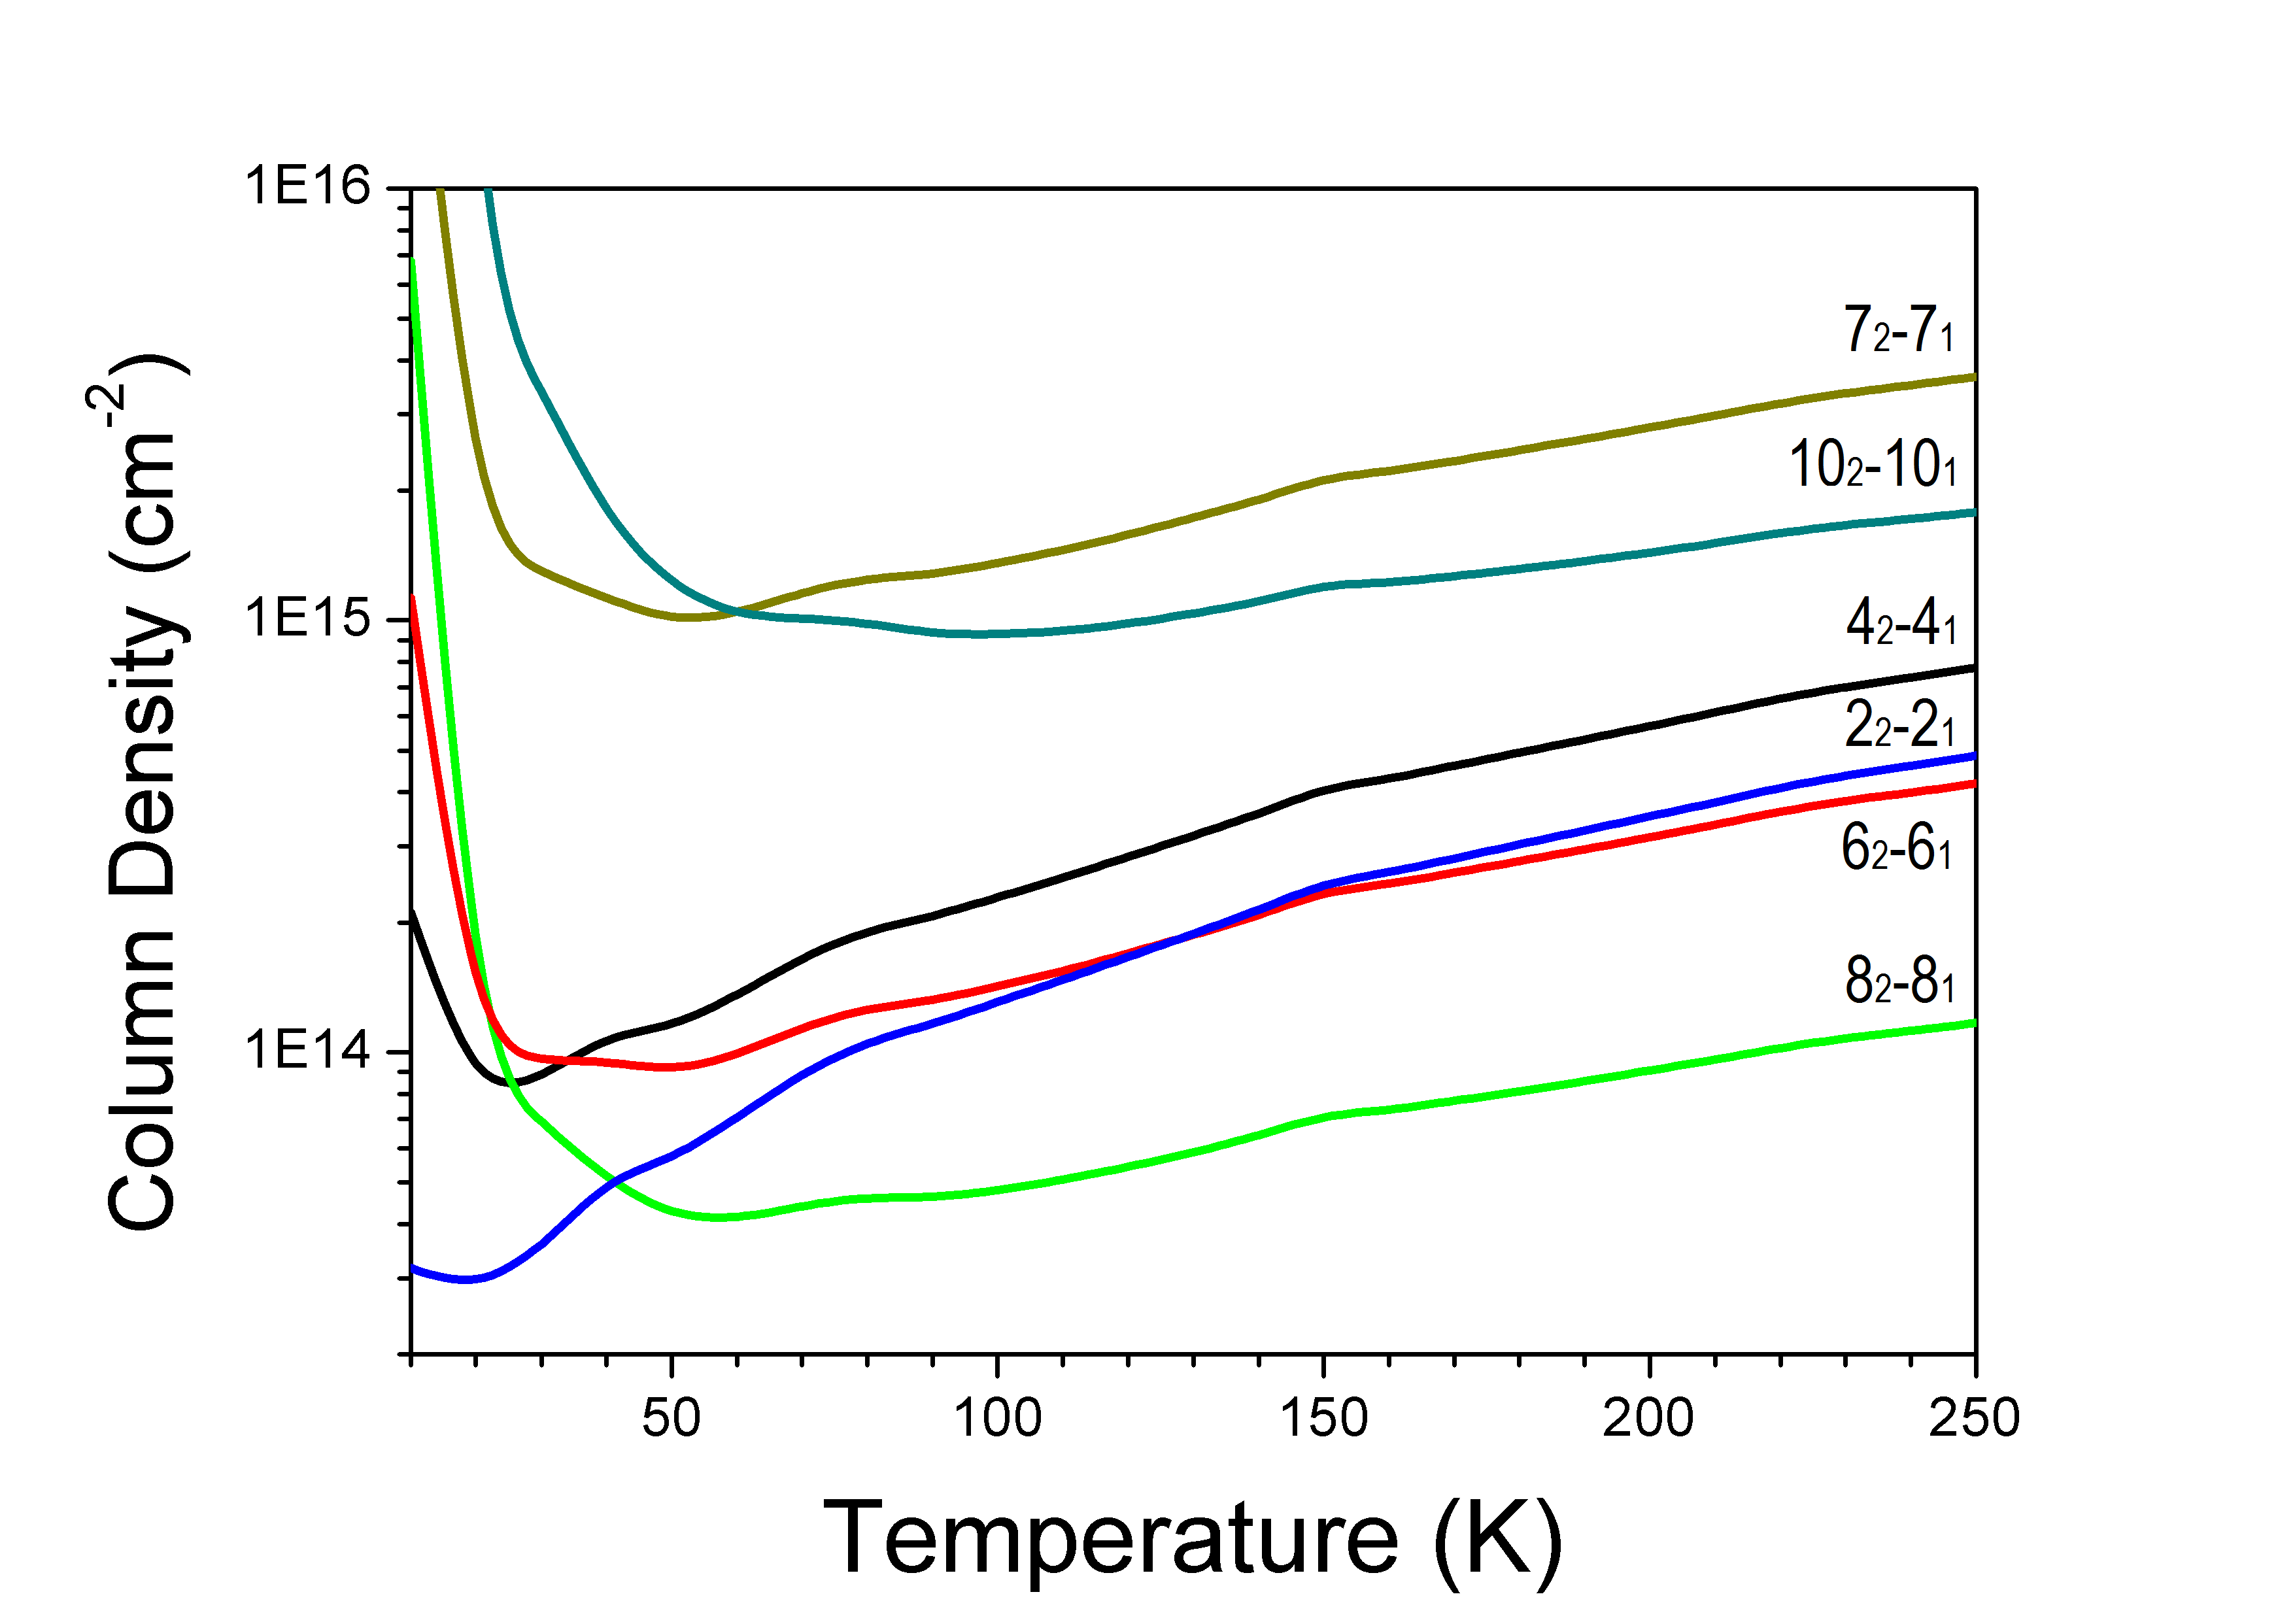
In Figure 2 upper limit column densities of the six investigated transitions of methylamine are plotted versus rotational temperature taking a typical 3 = 0.100 K kms-1. At 120 K the 82 81, 235735 MHz transition gives the lowest limits on the column densities, see Figure 2. However, since this particular transition was only included in the observations for one source, the second most sensitive transition at 120 K, 22 21, will be used (see Figure 4 in the Appendix for a blow-up of this particular spectral region in all investigated sources). All following molecular ratios are based on CH3NH2 column densities obtained from this line, assuming Trot = 120 K. The corresponding upper limits are presented in Table 3
4.2 Abundance ratio comparison
Combined with NH2CHO and CH3OH column densities from Bisschop et al. (2007) and Isokoski et al. (2013) derived in the same way, abundance ratios for methylamine and formamide with respect to each other and to methanol are calculated. These ratios are listed in Table 3. Methanol is chosen as a reference since it is the most readily observed complex organic molecule. Its disadvantage is that some of the transitions have high optical depth and that a cold component may be present (Isokoski et al., 2013), but this is circumvented by only taking the warm methanol column density derived from optically thin lines. Abundances relative to methanol rather than H2 are preferred since the H2 column depends on extrapolation of dust models to smaller scales than actually observed (Bisschop et al., 2007). Another point that needs to be taken into account is that the models of Garrod et al. (2008) do show a slight overproduction of CH3OH, which could influence the comparison between the ratios. Overall, the abundance ratios are estimated to be accurate to a factor of a few.
It should be noted that methylamine and formamide have significantly different dipole moments (1.31 and 3.73 Debye respectively) and could therefore be excited in different ways. Formamide has a larger critical density than methylamine, so the situation could arise where the critical density is not reached for formamide or even both molecules. The corresponding excitation temperatures will then be lower. In particular, the situation in which the critical density is not reached for formamide but is for methylamine, could affect the inferred ratios. As can be seen from Figure 2, if drops from 120 to 50 K, the column density drops by a factor of a few, depending on transition. If were 120 K for methylamine but 50 K for formamide, the observed column density of formamide would be lower than that listed here and thus result in a higher CH3NH2/NH2CHO ratio. We note, however, that there is no observational evidence that is systematically lower than 100 K for formamide (Bisschop et al., 2007).
Table 3 includes the observational results toward Sgr B2, the only source where methylamine is firmly detected, from Turner (1991), Belloche et al. (2013) and Neill et al. (2014). These results, obtained over the course of more than two decades, agree well with each other within the estimated uncertainties due to slightly different adopted source sizes. Nummelin et al. (2000) also detect methylamine in their Sgr B2 survey but find a surprisingly small beam filling factor and consequently very large column density compared with most other complex organic molecules. If their beam filling factor for CH3NH2 is taken to be the same as for NH2CHO, the Nummelin et al. (2000) ratios are more in line with those derived by Turner (1991), Belloche et al. (2013) and Neill et al. (2014). The non-detections of methylamine toward the chemically rich and well studied Orion hot core imply abundance limits that are at least a factor of 5 lower than for SgrB2 (Neill et al., 2014; Crockett et al., 2014).
Table 3 also contains the model results from Garrod et al. (2008), who present three hot core models which differ from each other by their warm-up timescale from 10 to 200 K. The timescales for F(ast), M(edium) and S(low) are , and years, respectively, and start after the cold collapse phase. In the slow models more time is spent in the warm-up phase where radicals are mobile. Values used in this comparison are taken from the so-called reduced ice composition, where cold phase methane and methanol abundances were modified to match observations of these ices toward W33A, NGC 7538 IRS9 and Sgr A*, see Gibb et al. (2000). Another comparison can be made with the gas-phase abundances in protoplanetary disk models of Walsh et al. (2014) which have similar or higher densities and temperatures as in protostellar cores. Their ratios range from 7.2 10-1 to 6.5 10-2 for CH3NH2/CH3OH, 4.2 10-1 to 1.5 for CH3NH2/NH2CHO and 1.7 to 8.8 10-2 for the NH2CHO/CH3OH. These ratios are close to the predicted values of Garrod et al. (2008) listed in Table 3, which may be partly due to using the same surface-chemistry network.
From Table 3 several trends become apparent for our results. The CH3NH2/NH2CHO limits lie about an order of magnitude above model values whereas the CH3NH2/CH3OH limit approximately matches with theoretical predictions. Because the observed values are actually 3 upper limits, this suggests that models overproduce CH3NH2. For the sources with the most stringent limits, such as G31.41+0.31 and the line in W3(H2O), the CH3NH2/CH3OH limits are comparable or even lower than the abundance ratios for Sgr B2. The third ratio, NH2CHO/CH3OH, is also found to be lower than the models by up to one order of magnitude.
Close inspection of the Bisschop et al. (2007) data shows that the NH2CHO column densities may have larger uncertainties than quoted in their figures and tables. We have therefore re-analysed all NH2CHO data from that paper taking larger uncertainties into account. In general, this leads to lower NH2CHO column densities. Even using the upper limits from this re-analysis as well as those from Isokoski et al. (2013) (which were obtained with generous error bars), the NH2CHOupper/CH3OH ratios are significantly lower than the models. This suggests that both the methylamine and formamide abundances are too high in the models.
The Sgr B2 detections tend to have lower CH3NH2/NH2CHO and CH3NH2/CH3OH ratios than our upper limits and are also somewhat below the models, but generally do not differ more than a factor of a few. The SgrB2 NH2CHO/CH3OH ratios are also closer to the models results, at least for the faster models. However, the Orion Compact Ridge NH2CHO/CH3OH value from Crockett et al. (2014) is comparable to that found for our sources and clearly lower than the models. Further observations are needed to determine to what extent Sgr B2 is a special case.
To further elucidate the differences between theory and our and the Sgr B2 observations, an additional analysis was made of the CH3NH2/CH3CN ratio. These results are listed in Table 4. Acetonitrile is produced in the gas-phase, but more abundantly on grains: an important route to its formation is via CH + CN CH3CN, according to Garrod et al. (2008). This would mean that both molecules compete for the methyl radical on the surface, thus relating the two molecules.
Our observed ratios involving CH3CN are clearly at odds with the theoretical predictions. The observed CH3NH2/CH3CN ratios are in most cases an order of magnitude lower than theory and approach the observed ratios for Sgr B2. However, the observed CH3CN/CH3OH ratios are 1-2 orders of magnitude higher than theoretical predictions. Both these cases point to CH3CN being underproduced in the models.
Finally, abundance ratios, with some notable exceptions, do not vary more than an order of magnitude between different sources, as also found by Bisschop et al. (2007) for other species.
|
|
5 Discussion
Despite a significant number of succesfully identified molecules (see Table 5 in the Appendix for examples of W3(H2O) and G31.41+0.31), only upper limits were found for methylamine in the various hot cores, limiting the conclusions that can be drawn. Nevertheless, trends are seen in our abundance ratios. The results suggest that theoretically predicted abundances for both methylamine and formamide are too high. In contrast, acetonitrile is found to be underproduced in the models. In the following, each of these species is discussed individually.
5.1 CH3NH2
Garrod et al. (2008) suggest that methylamine is primarily formed by grain-surface chemistry using UV to create the CH3 and NH2 radicals from photodissociation of primarily CH4 and NH3. Perhaps the amount of UV processing is overestimated in these models. An alternative route is hydrogen atom addition to solid HCN, proposed by Theule et al. (2011) and found to lead to both CH2NH (methanimine) and CH3NH2. Walsh et al. (2014) find in their models that methylamine is indeed efficiently formed on grains at 10 K by atom addition reactions to solid CH2NH. Burgdorf et al. (2010) have detected HCN ice on Triton, but so far no detection of solid HCN has been made in the ISM. Methanimine is actually readily observed in the gas-phase (Turner, 1991; Nummelin et al., 1998; Belloche et al., 2013) so the presence of both species makes the H-atom addition scheme probable. However, Halfen et al. (2013) detect CH2NH in Sgr B2(N) at a rotational temperature of 44 K, which is distinctly colder than the 159 K observed for CH3NH2, suggesting that the two molecules may not co-exist. An alternative route would therefore be to form these molecules by two different gas-phase reaction pathways (CH∙(g) + NH3(g) CH2NH + H and CH(g) + NH3(g) CH3NH2 + H), with CH being present primarily in the colder outer envelope and CH3 in the warmer center. Further modeling is needed to determine whether these gas-phase reactions can reproduce the observed abundances quantitatively.
5.2 NH2CHO
Formamide also appears to be overproduced in the hot core model. Since Garrod et al. (2008) use both gas-phase, radical and atom addition reactions to form formamide, it is difficult to pin down where the discrepancies could come from. It is known that NH2CHO is formed in CO:NH3 mixtures after UV and electron irradiation (Grim et al., 1989; Demyk et al., 1998; Jones et al., 2011) and it has also been proposed that it can form from H- and N-atom addition to solid CO (Tielens & Charnley, 1997). Gas-phase formation from CO and NH3 is viable as well (Hubbard et al., 1975), although these experiments were conducted under high-pressure conditions, not the low pressures applicable in the ISM. Further quantification of both gas-phase and solid phase routes through laboratory experiments is needed. Recent laboratory experiments by Fedoseev et al. (2014) do not find NH2CHO production in H- and N-atom bombardment studies of solid CO, consistent with a large barrier for H- addition to HNCO found in ab initio calculations (Nguyen et al., 1996), so perhaps the efficiency of this route has been overestimated in the models. An alternative solution would be that the high-mass sources studied here have not gone through a long (pre-stellar) phase in which the dust temperature was low enough for CO to be frozen out and turned into other molecules.
5.3 CH3CN
The clear mismatches between theory and observations for the ratios involving CH3CN point toward an underproduction of acetonitrile by more than an order of magnitude in the models. As with formamide, gas-phase, radical and atom addition reactions contribute to the formation of CH3CN in the models, making it difficult to determine the cause. The main formation route in the models by radical addition of solid CH and solid CN∙ has never experimentally been investigated. It would therefore be useful to determine if this is a viable solid state formation route and if it potentially has a higher efficiency than assumed.
Alternatively it is possible that photodestruction of solid acetonitrile is not as efficient as assumed in the models. Gratier et al. (2013) find high gas-phase CH3CN abundances in the Horsehead PDR, indicative of a high photodesorption rate and slow destruction of CH3CN in the ice. Bernstein et al. (2004) indeed find slower photolysis of solid CH3CN compared with other organic molecules. If such a slower photodissociation rate would also hold for gas-phase CH3CN, it would be an attractive explanation why the CH3CN rotational temperatures are generally higher than those of other complex molecules (e.g., Bisschop et al. (2007) and many other hot core studies), since the molecule could then approach the protostar closer before being destroyed. However, the gas phase photoabsorption cross sections of CH3CN are well determined and if the bulk of these absorptions lead to dissociation this would result in a photodissociation rate of gaseous CH3CN at least as fast as that of CH3OH (van Dishoeck et al., 2006).
Another important parameter for all molecules studied here is the mobility of radicals and neutral molecules on the surface assumed in the gas-grain models. For many species no experimental data are available on diffusion barriers, only theoretically-inspired guesses. Observational evidence suggests that at least parts of the ice mantles are segregated in CO-rich and CO-poor layers (Tielens et al., 1991; Pontoppidan et al., 2008). Therefore, more knowledge of the structure of ice mantles and the mobility of radicals and neutral molecules as a function of surface temperature and in various chemical environments is necessary to determine if addition reactions are likely to happen and at which rates.
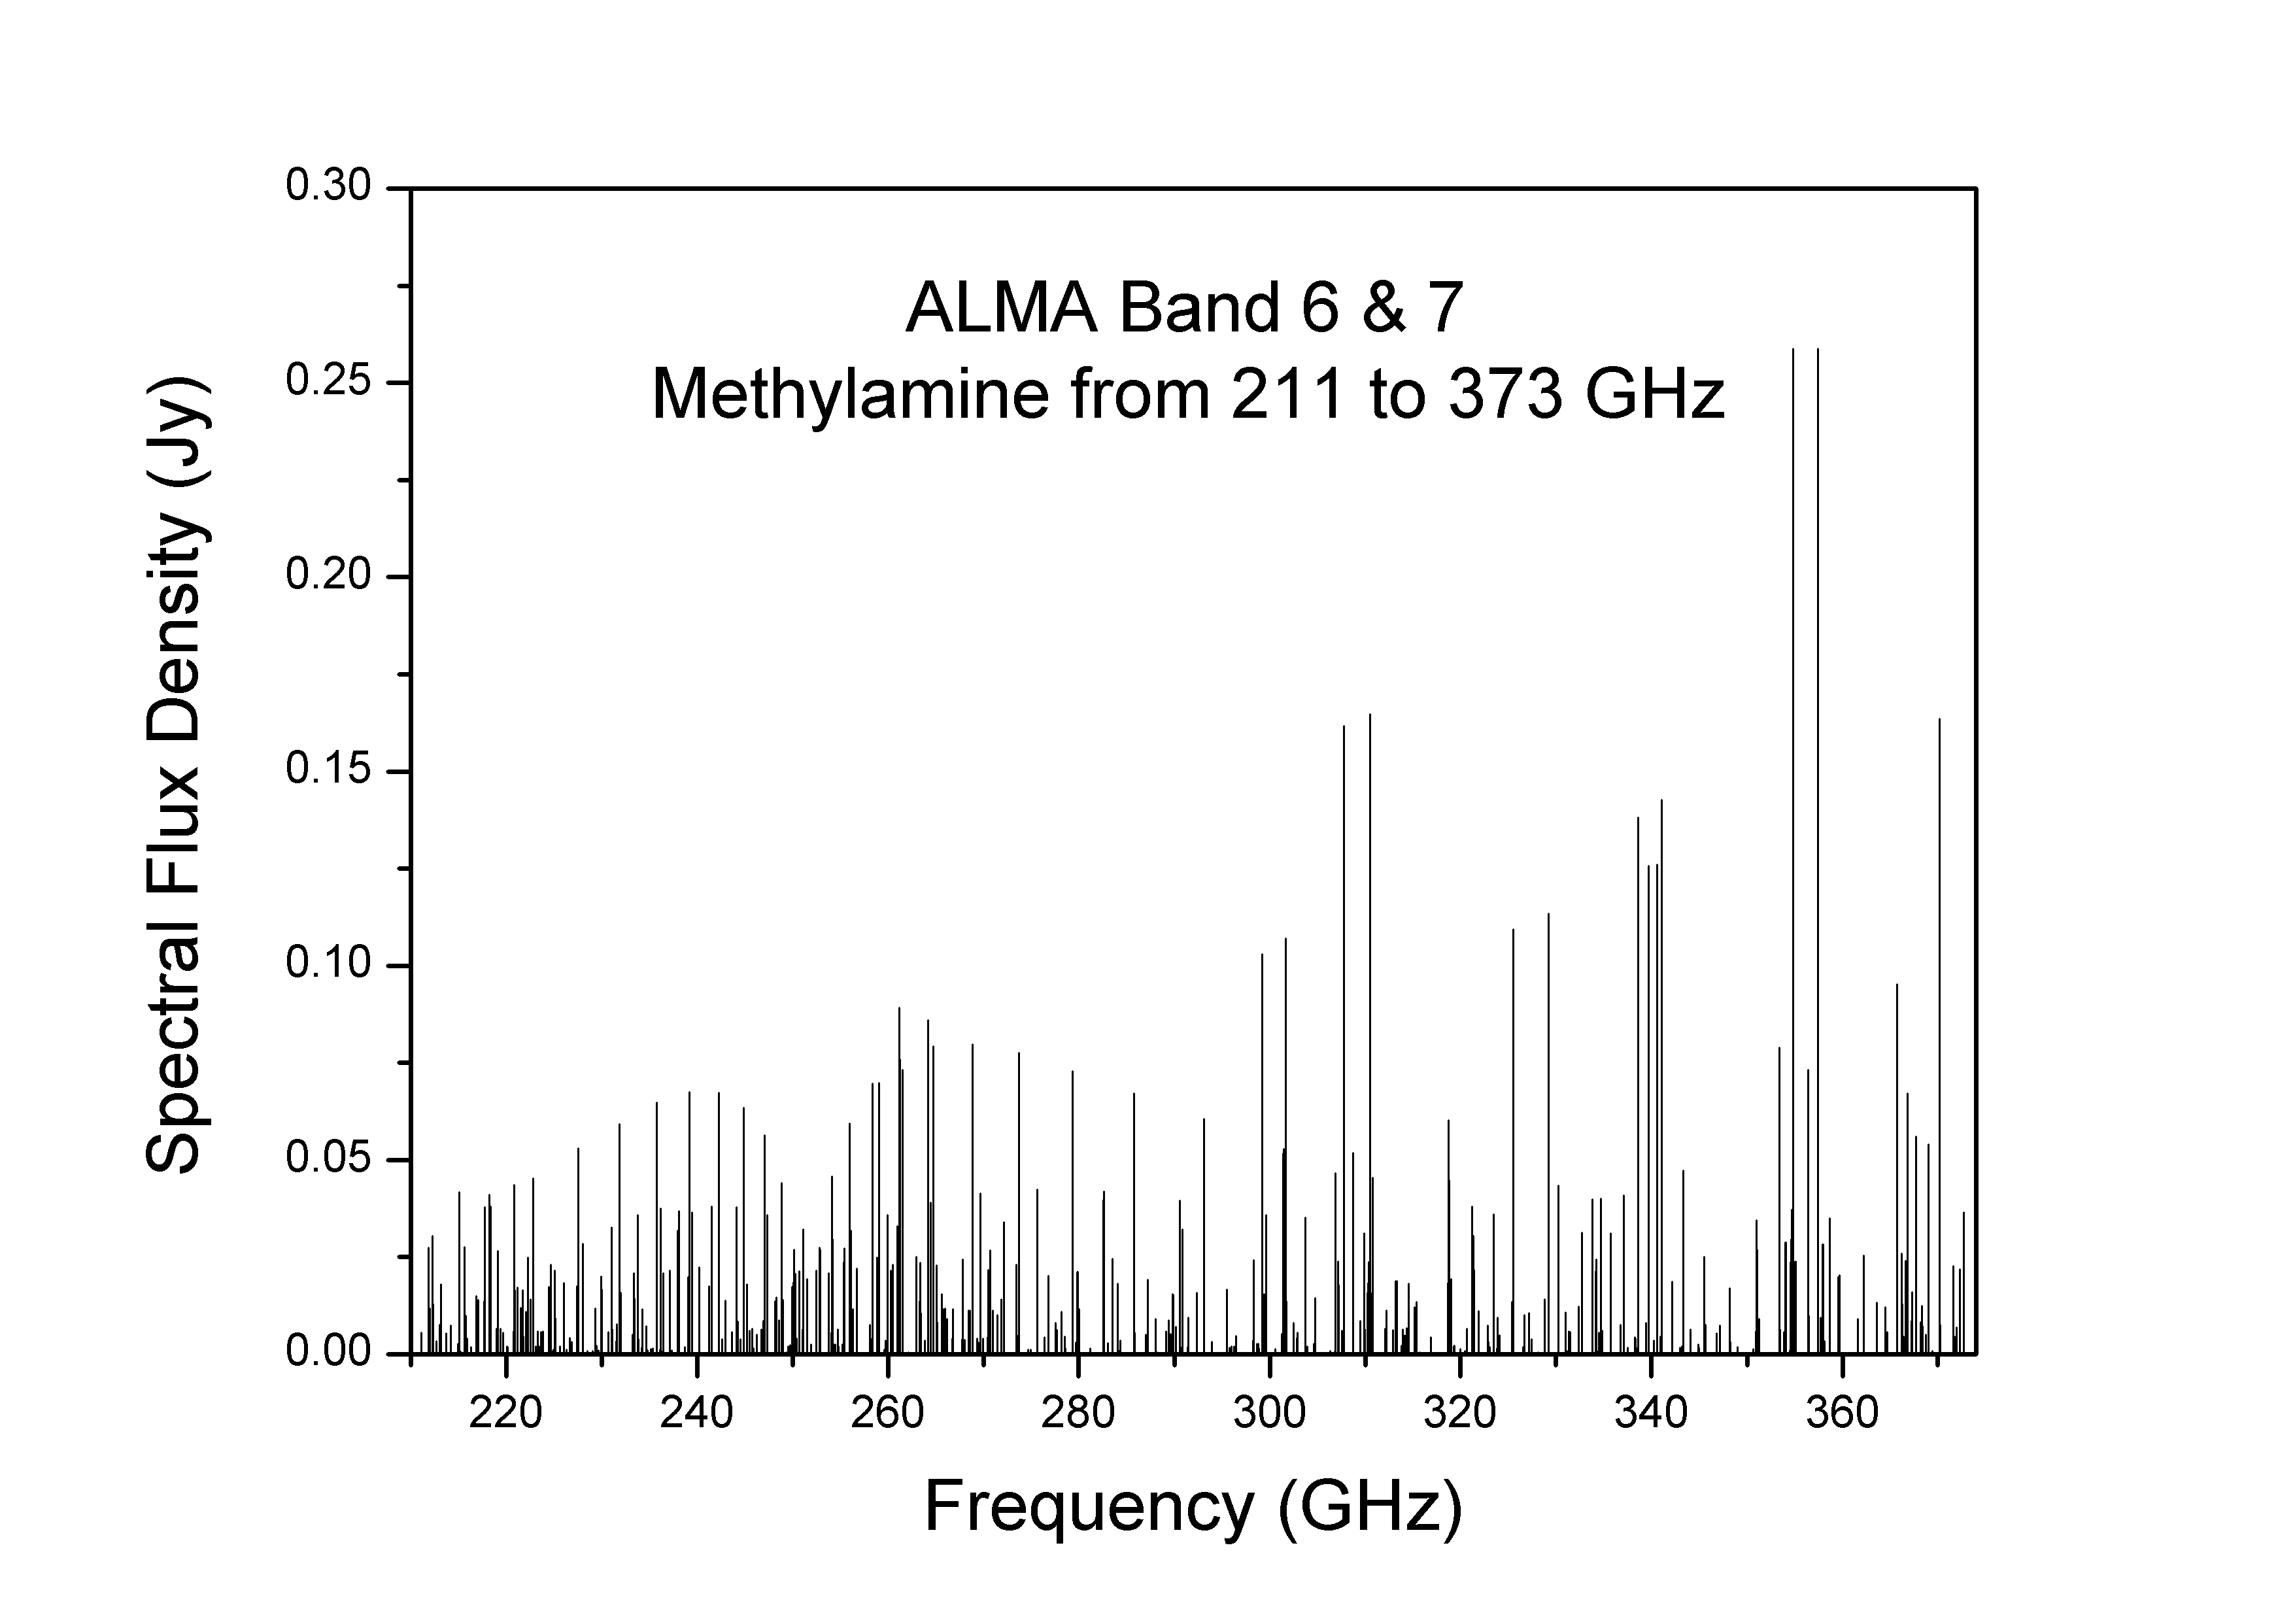
5.4 Prospects for ALMA
In the near future, much deeper searches for CH3NH2 can be carried out by ALMA (Appendix B). Figure 5 shows that the strongest transitions within Band 6 are mainly located between 240 and 275 GHz and in Band 7 around 310, 340 and 355 GHz. In Table 6 the strongest transitions in ALMA’s Band 6 and 7 are listed. It becomes apparent that lines covered by Band 7 are more intense, but at the cost of a lower line density.
Estimates done for the W 33A source with the CASSIS line analysis software and the ALMA Sensitivity Calculator show that ALMA should be able to reach the 3 detection limits for the CH3NH2 lines around 236 GHz in less than 1 hour of integration time, assuming the column density for methylamine of 1.2 cm-2 as found by Turner (1991) in a large beam and two orders of magnitude lower than those inferred here for a small source size. This estimate assumes a spectral resolution of 0.64 kms-1 as used in our JCMT data, the number of ALMA antennas set to 34 (as in Cycle 2) and a synthesized beam of 1.1”, appropriate for the W33A hot core (100 K radius).
6 Conclusions
We have analysed nine hot core regions in search of methylamine. The molecule has not been convincingly detected, so upper limit abundances are determined for all the sources. From these limits, ratios of methylamine to other molecules (NH2CHO, CH3OH, CH3CN) have been determined and compared with theory and Sagittarius B2 surveys. Our conclusions are as follows:
-
1.
Trends in our results indicate that both methylamine and formamide are overproduced in the models of Garrod et al. (2008). Acetonitrile is underproduced with respect to these models. This is especially true for the slow models.
-
2.
Abundance ratios do not differ more than an order of magnitude between various sources suggesting that the (nitrogen) chemistry is very similar between hot cores, as has been found previously for other species.
-
3.
More (laboratory) studies are needed to clarify the formation pathway of methylamine and to determine differences and similarities with formamide, methanimine and, to a lesser extent, acetonitrile formation.
-
4.
The upper limits determined for CH3NH2 here can guide future more sensitive observations, especially with ALMA. Based on the ratios found in the Sgr B2 observations it is very likely that ALMA will reach the detection limit for methylamine in the sources studied here. Particularly strong transitions and spectral regions to target with ALMA are given.
Acknowledgements.
We would like to thank C. Walsh, I. San Jose García, M. Drozdovskaya, N. van der Marel, M. Kama, M. Persson, J. Mottram, G. Fedoseev, and H. Linnartz for their support and input on this project. Thoughtful comments by the referee are much appreciated. Astrochemistry in Leiden is supported by the Netherlands Research School for Astronomy (NOVA), by a Royal Netherlands Academy of Arts and Sciences (KNAW) professor prize, and by the European Union A-ERC grant 291141 CHEMPLAN.References
- Belloche et al. (2013) Belloche, A., Müller, H. S. P., Menten, K. M., Schilke, P., & Comito, C. 2013, A&A, 559, A47
- Bernstein et al. (2004) Bernstein, M. P., Ashbourn, S. F. M., Sandford, S. A., & Allamandola, L. J. 2004, ApJ, 601, 365
- Bisschop et al. (2007) Bisschop, S. E., Jørgensen, J. K., van Dishoeck, E. F., & de Wachter, E. B. M. 2007, A&A, 465, 913
- Blake et al. (1987) Blake, G. A., Sutton, E. C., Masson, C. R., & Phillips, T. G. 1987, ApJ, 315, 621
- Burgdorf et al. (2010) Burgdorf, M., Cruikshank, D. P., Dalle Ore, C. M., et al. 2010, ApJ, 718, L53
- Caselli & Ceccarelli (2012) Caselli, P. & Ceccarelli, C. 2012, A&A Rev., 20, 56
- Crockett et al. (2014) Crockett, N. R., Bergin, E. A., Neill, J. L., et al. 2014, ApJ, 787, 112
- Demyk et al. (1998) Demyk, K., Dartois, E., D’Hendecourt, L., et al. 1998, A&A, 339, 553
- Ehrenfreund & Charnley (2000) Ehrenfreund, P. & Charnley, S. B. 2000, ARA&A, 38, 427
- Fedoseev et al. (2014) Fedoseev, G., Iopolo, S., Zhao, D., Lamberts, T., & Linnartz, H. 2014, MNRAS, submitted
- Fontani et al. (2007) Fontani, F., Pascucci, I., Caselli, P., et al. 2007, A&A, 470, 639
- Fourikis et al. (1974) Fourikis, N., Takagi, K., & Morimoto, M. 1974, ApJ, 191, L139
- Garrod & Herbst (2006) Garrod, R. T. & Herbst, E. 2006, A&A, 457, 927
- Garrod et al. (2008) Garrod, R. T., Weaver, S. L. W., & Herbst, E. 2008, ApJ, 682, 283
- Gibb et al. (2000) Gibb, E. L., Whittet, D. C. B., Schutte, W. A., et al. 2000, ApJ, 536, 347
- Gratier et al. (2013) Gratier, P., Pety, J., Guzmán, V., et al. 2013, A&A, 557, A101
- Grim et al. (1989) Grim, R., Schutte, W., Schmitt, B., & Greenberg, M. 1989, in IAU Symposium, Vol. 135, Interstellar Dust, ed. L. J. Allamandola & A. G. G. M. Tielens, 245
- Halfen et al. (2011) Halfen, D. T., Ilyushin, V., & Ziurys, L. M. 2011, ApJ, 743, 60
- Halfen et al. (2013) Halfen, D. T., Ilyushin, V. V., & Ziurys, L. M. 2013, ApJ, 767, 66
- Herbst & van Dishoeck (2009) Herbst, E. & van Dishoeck, E. F. 2009, ARA&A, 47, 427
- Hubbard et al. (1975) Hubbard, J., Voecks, G., Hobby, G., et al. 1975, J. mol. Evol., 5, 223
- Isokoski et al. (2013) Isokoski, K., Bottinelli, S., & van Dishoeck, E. F. 2013, A&A, 554, A100
- Jones et al. (2011) Jones, B. M., Bennett, C. J., & Kaiser, R. I. 2011, ApJ, 734, 78
- Kaifu et al. (1974) Kaifu, N., Morimoto, M., Nagane, K., et al. 1974, ApJ, 191, L135
- Maret et al. (2011) Maret, S., Hily-Blant, P., Pety, J., Bardeau, S., & Reynier, E. 2011, A&A, 526, A47
- Neill et al. (2014) Neill, J. L., Bergin, E. A., Lis, D. C., et al. 2014, ApJ, 789, 8
- Nguyen et al. (1996) Nguyen, M. T., Sengupta, D., Vereecken, L., Peeters, J., & Vanquickenborne, L. G. 1996, Journal of Physical Chemistry, 100, 1615
- Nummelin et al. (1998) Nummelin, A., Bergman, P., Hjalmarson, A., et al. 1998, ApJS, 117, 427
- Nummelin et al. (2000) Nummelin, A., Bergman, P., Hjalmarson, Å., et al. 2000, ApJS, 128, 213
- Öberg (2009) Öberg, K. I. 2009, PhD thesis, Leiden Observatory, Leiden University, P.O. Box 9513, 2300 RA Leiden, The Netherlands
- Pickett et al. (1998) Pickett, H. M., Poynter, R. L., Cohen, E. A., et al. 1998, J. Quant. Spec. Radiat. Transf., 60, 883
- Pontoppidan et al. (2008) Pontoppidan, K. M., Boogert, A. C. A., Fraser, H. J., et al. 2008, ApJ, 678, 1005
- Rathborne et al. (2008) Rathborne, J. M., Jackson, J. M., Zhang, Q., & Simon, R. 2008, ApJ, 689, 1141
- Schilke et al. (1997) Schilke, P., Groesbeck, T. D., Blake, G. A., Phillips, & T. G. 1997, ApJS, 108, 301
- Sutton et al. (1995) Sutton, E. C., Peng, R., Danchi, W. C., et al. 1995, ApJS, 97, 455
- Theule et al. (2011) Theule, P., Borget, F., Mispelaer, F., et al. 2011, A&A, 534, A64
- Tielens & Charnley (1997) Tielens, A. G. G. M. & Charnley, S. B. 1997, Origins of Life and Evolution of the Biosphere, 27, 23
- Tielens et al. (1991) Tielens, A. G. G. M., Tokunaga, A. T., Geballe, T. R., & Baas, F. 1991, ApJ, 381, 181
- Turner (1991) Turner, B. E. 1991, ApJS, 76, 617
- van Dishoeck & Blake (1998) van Dishoeck, E. F. & Blake, G. A. 1998, ARA&A, 36, 317
- van Dishoeck et al. (2006) van Dishoeck, E. F., Jonkheid, B., & van Hemert, M. C. 2006, Faraday Discussions, 133, 231
- Walmsley (1992) Walmsley, C. M. 1992, in Chemistry and Spectroscopy of Interstellar Molecules, ed. D. K. Bohme, 267
- Walsh et al. (2014) Walsh, C., Millar, T. J., Nomura, H., et al. 2014, A&A, 563, A33
Appendix A Methylamine and other transitions
|
a Indicates an identified transition where it was not possible to determine the peak area.
Appendix B ALMA
In the following figure the simulated spectrum of methylamine is shown for a column density of 1.0 1015 cm-2 at an excitation temperature of 120 K. Simulations were done with CASSIS using the JPL spectroscopic database. The frequency ranges were taken to cover ALMA Bands 6 and 7. The resolution was set at 0.1 MHz for this spectrum.
|