The Galactic Center Black Hole Laboratory
Abstract
The super-massive 4 million solar mass black hole Sagittarius A* (SgrA*) shows flare emission from the millimeter to the X-ray domain. A detailed analysis of the infrared light curves allows us to address the accretion phenomenon in a statistical way. The analysis shows that the near-infrared flare amplitudes are dominated by a single state power law, with the low states in SgrA* limited by confusion through the unresolved stellar background. There are several dusty objects in the immediate vicinity of SgrA*. The source G2/DSO is one of them. Its nature is unclear. It may be comparable to similar stellar dusty sources in the region or may consist predominantly of gas and dust. In this case a particularly enhanced accretion activity onto SgrA* may be expected in the near future. Here the interpretation of recent data and ongoing observations are discussed.
Sagittarius (SgrA*) at the center of our Galaxy is a highly variable radio, near-infrared (NIR), and X-ray source which is associated with a M⊙ super-massive central black hole (SMBH). SgrA* is the closest SMBH and can be taken as a paradigm for quiescent or very Low Luminosity Active Galactic Nuclei (LLAGN). It has been shown that the strong polarized (up to several 10%) infrared flux density excursions (often referred to as flares) from SgrA* show patterns of strong gravity as expected from in-spiraling material very close to the black hole’s horizon (Zamaninasab et al. 2010, 2011). As a consequence of the strong gravitational field of the black hole these patterns express themselves in characteristic variations of the light curve due to the effect of relativistic boosting, light bending and the rotation of the polarization angle (Zamaninasab et al. 2010, 2011, Eckart et al. 2006a, Broderick et al. 2005). Therefore, it is mainly the polarization and the strong flux variability that give us certainty that we study the immediate vicinity of a SMBH (Yoshikawa et al. 2013, Zamaninasab et al. 2010, 2011).
A fast moving infrared excess source G2, which is widely interpreted as a core-less gas and dust cloud (Gillessen et al. 2012), approaches SgrA* on a presumably elliptical orbit covering the region of the high velocity S-stars close to SgrA*. The passage of this Dusty S-cluster Object (DSO) is expected to result in accretion phenomena which will give an improved insight into the nature of the immediate surroundings of the SMBH SgrA*. The year 2013 certainly was only the first in an intense observing campaign during which the immediate vicinity of SgrA* is being monitored while the dusty object is close. Recent orbit determinations expect the peri-apse passage to occur in April/May 2014 (Phifer et al. 2013). Based on recent conference contributions (see Acknowledgments) on the Galactic Center this article concentrates on three major topics: 1) SgrA* and its environment, 2) its relation to extragalactic nuclei, and 3) new instrumentation and perspectives.
1 The Galactic Center
The DSO source approaching the super-massive black hole SgrA* at the center of the Milky Way has spawned great activities in observing that region covering the entire electromagnetic spectrum from radio, via infrared to X-ray wavelengths using telescopes across the world. The upcoming events underline the importance of the Galactic Center as a laboratory to investigate and understand phenomena in the immediate environment of super massive black holes (Eisenhauer 2010, Ghez 2009). Gas and stars within the Galactic Center stellar cluster provide the fuel for the central super-massive black hole and hence the reason for most of the flux density variability observed from it.
1.1 The variability of Sagittarius A*
Progress has been made in the understanding of the emission process associated with the immediate surroundings of the super-massive black hole counterpart SgrA* as well as the three-dimensional dynamics and the population of the central stellar cluster. There is also ample evidence of interactions between the cluster and SgrA*.
Series of monitoring observations in the near-infrared (NIR), X-ray, and sub-millimeter (sub-mm) regimes accumulated over the years allowed us to perform for the first time detailed statistical studies of the variability of SgrA* (Witzel et al. 2012; Eckart et al. 2012). The analyses show that the histogram of the near-infrared flux density is a pure power-law and the emission process is most likely dominated by synchrotron radiation. In Witzel et al. (2012), we present a comprehensive data description for NIR measurements of SgrA*. We characterized the statistical properties of the variability of SgrA* in the near-infrared, which we found to be consistent with a single-state process forming a flux density power-law distribution. We discovered a linear rms-flux relation for the flux density range up to 12 mJy on a time scale of 24 minutes. This and the structure function of the flux density variations imply a phenomenological, formally nonlinear statistical behavior that can be modeled. In this way, we can simulate the observed variability and extrapolate its behavior to higher flux levels and longer time scales. SgrA* is also strongly variable in the X-ray domain (Baganoff et al. 2003, Baganoff et al. 2001, Porquet et al. 2008, Porquet et al. 2003, Eckart et al. 2012 and references there in, as well as, Nowak et al. 2012, Barriere et al. 2014 for a recent strong flares observed with Chandra and NuSTAR). The detailed statistical investigation by Witzel et al. (2012) also suggests that the past strong X-ray variations that give rise to the observed X-ray echos can in fact be explained by the NIR variability histogram under the assumption of a Synchrotron Self Compton (SSC) process. SgrA* is extremely faint in the X-ray bands, though strong activity has been revealed through the detection of flares. Therefore, SgrA* is the ideal target to investigate the mass accretion and the ejection physics in the case of an extremely low accretion rate onto a super-massive black hole. This is actually the phase in which super-massive black holes are thought to spend most of their lifetime. The activity phase onset of a magnetar (see section below) at a separation of only about 3 arcseconds from the Galactic Center presented a problem for the SgrA* monitoring program in 2013 (Mori et al. 2013, Shannon et al. 2013, Rea et al. 2013).
Eckart, et al. (2012) present simultaneous observations and modeling of the millimeter (mm), NIR, and X-ray flare emission of SgrA*. These data allowed us to investigate physical processes giving rise to the variable emission of SgrA* from the radio to the X-ray domain. In the radio cm-regime SgrA* is hardy linearly polarized but shows a fractional circular polarization of around 0.4% (Bower, Falcke & Backer 1999, Bower et al. 1999). The circular polarization decreases towards the mm-domain (Bower 2003), where as Macquart et al. (2006) report variable linear polarization from SgrA* of a few percent in the mm-wavelength domain. The observations reveal flaring activity in all wavelength bands. The polarization degree and angle in the sub-mm are likely linked to the magnetic field structure or the general orientation of the source. In general - the NIR emission is leading the sub-mm with a delay of about one to two hours (see below) and the excursions in the NIR and X-ray emission are rather simultaneous. As a result we found that the observations can be modeled as the signal from an adiabatically expanding source component (Eckart et al. 2008b, Yusef-Zadeh et al. 2006, Eckart et al. 2006b). of relativistic electrons emitting via the synchrotron/SSC process. A large fraction of the lower energy mm/cm- flux density excursions is not necessarily correlated with the NIR/X-ray variability (e.g. Dexter & Fragile 2013, Dexter et al. 2013, and details and further references Eckart et al. 2012). One may compute the SSC spectrum produced by up-scattering of a power-law distribution of sub-mm-wavelength photons into the NIR and X-ray domain by using the formalism given by Marscher (1983) and Gould (1979). Such a single SSC component model may be too simplistic, although it is considered as a possibility in most of the recent modeling approaches. It does not take into account possible deviations from the overall spectral index of =1.3 at any specific wavelength domain like the NIR or X-ray regime.
The number density distribution of the relativistic electrons responsible for the synchrotron spectrum can be described by
| (1) |
with between and which limit the lower and upper bound of the relativistic electron spectrum
| (2) |
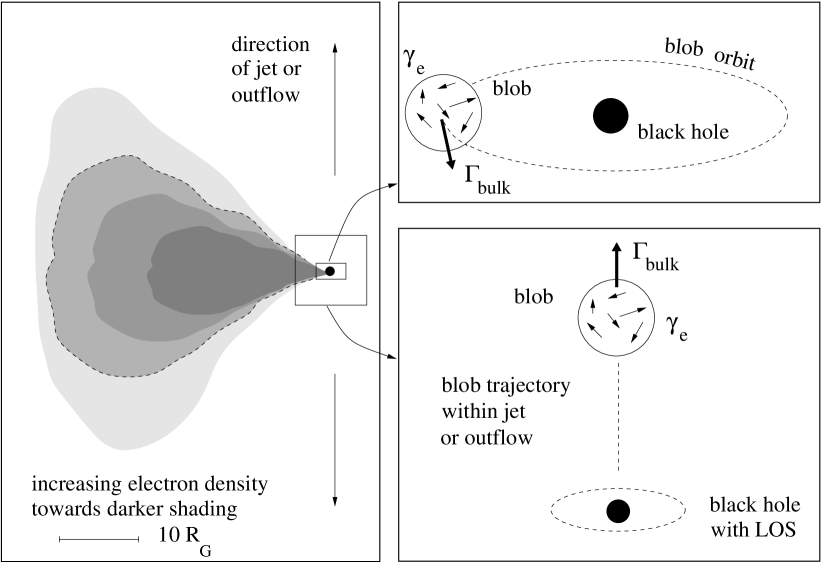
Lorentz factors for the emitting electrons of the order of a few thousand are required to produce a sufficient SSC flux in the observed X-ray domain. In addition the relativistic bulk motion of the orbiting or outward traveling component is described by the bulk Lorentz factor (see Fig. 1). On the left of this figure we show a sketch of a typical relativistic electron density distribution resulting from MHD calculations (e.g. Dexter et al. 2010, Dexter & Fragile 2013, Moscibrodzka & Falcke 2013). We show a cut through only one side of the three dimensional structure. The central plane and outflow region resulting from these calculations can be modeled in different, dedicated approaches (top and bottom right).
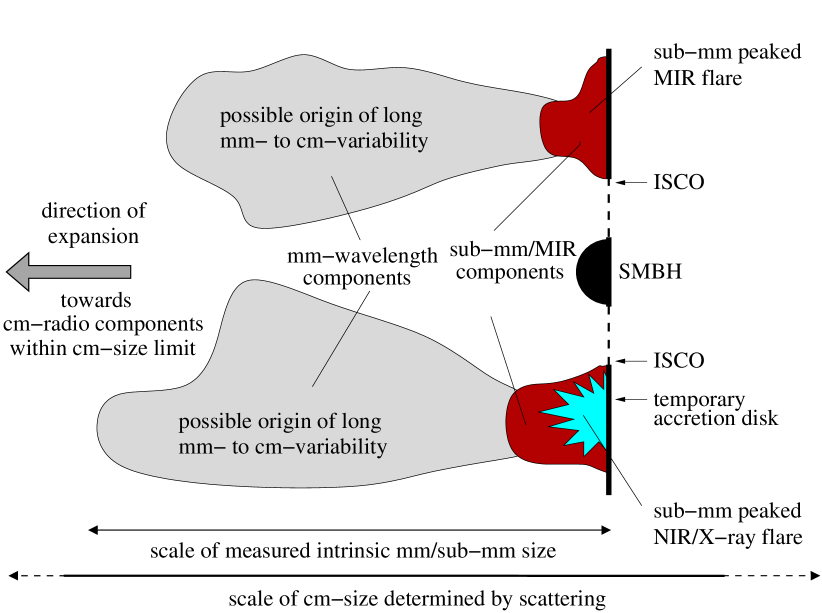
In the central plane modeling the flux variations are assumed to be the result of the motion of an orbiting blob or a hot spot (e.g. Eckart et al. 2006a). In the outflow model the flux variations are assumed to be due to the ejection of a blob and its motion along the jet (with bulk motions close to the speed of light) or a much slower overall outflow component. In this case - for VLBI observations - the larger outflow extent at increasingly lower radio frequencies would be hidden by the decreasingly lower angular resolutions due to interstellar scattering. In Fig.2 the accretion disk (here assumed to be edge-on) is shown as a vertical thick line to the right, the dashed part indicates the disk sections in the back- and foreground. Extending to the left we show one side above the disk. Here higher energy flare emission (lower part) is assumed to be responsible for the observed NIR/X-ray flare emission. Lower energy flare emission (upper part) may substantially contribute to long wavelength infrared emission. In addition to the expansion towards and beyond the the mm-source size, radial and azimuthal expansion within the disk may occur. Hence, long mm/cm-wavelength variability may originate from different source components of SgrA* and may be difficult to be disentangled based on radio data alone.
In Fig.1 the relativistic boosting vectors for the electrons and the bulk motion are not drawn to a proper relative scale. One can assume . In the case of relativistically orbiting gas as well as relativistic outflows one may use modest values for . Both dynamical phenomena are likely to be relevant in the case of SgrA*. The size of the central plane synchrotron component is assumed to be of the order of or at most a few times the Schwarzschild radius. From the overall variable radio/sub-mm spectrum spectrum we can assume a turnover frequency of a few 100 GHz (see details in Eckart et al. 2012). The motion of the synchrotron emitting cloud can be described via
| (3) |
| (4) |
Here and is the speed of the bulk motion of the synchrotron cloud, is the Doppler factor and the angle to the line of sight. For a relativistic bulk motion with around 1.70.3 (i.e. angles of about ) the corresponding magnetic field strengths are often assumed to be of the order of a few ten Gauss, which is also within the range of magnetic fields expected for RIAF models (e.g. Yuan et al. 2006, Narayan et al. 1998).
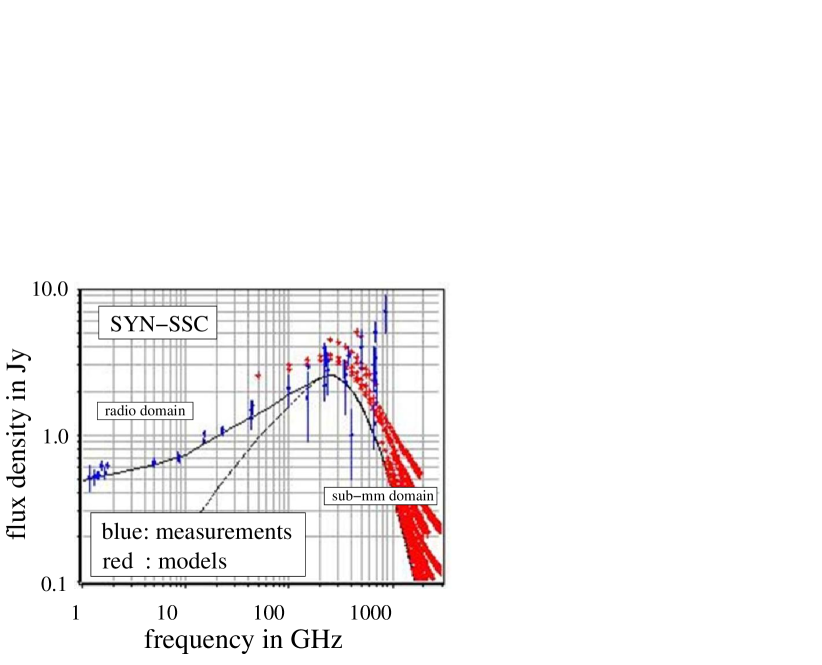
Modeling of the light curves shows that (at least for the brighter events) typically the sub-mm flux density excursions follow the NIR emission with a delay of about one to two hours with an expansion velocity of about 0.01c-0.001c (Eckart et al. 2008b, Yusef-Zadeh et al. 2006, Eckart et al. 2006b). We find source component sizes of around one Schwarzschild radius, flux densities of a few Janskys, and steep spectral indices. Typical model parameters suggest that either the adiabatically expanding source components have a bulk motion larger than its expansion velocity or the expanding material contributes to a corona or disk, confined to the immediate surroundings of SgrA*. For the bulk of the synchrotron and SSC models, we find synchrotron turnover frequencies in the range of 300-400 GHz. For the pure synchrotron models, this results in densities of relativistic particles in the mid-plane of the assumed accretion flow of the order of 106.5 cm-3, and for the SSC models the median densities are about one order of magnitude higher. However, to obtain a realistic description of the frequency-dependent variability amplitude of SgrA*, models with higher turnover frequencies and even higher densities are required. This modeling approach also successfully reproduces the degree of flux density variability across the radio to far-infrared spectrum of SgrA*. In Fig. 3 we show observed flux densities of SgrA* taken from the literature (blue) compared to a combined model that consists of the fit given by Falcke et al. (2000), Marrone et al. (2008) (black line), and Dexter et al. (2010) (black dashed line). We plotted in red the spectra of synchrotron self-absorption frequencies for the range of models. Here we show results for the preferred synchrotron plus SSC (SYN-SSC) model that most closely represents the observed variability of SgrA*.
Valencia-S. et al. (2012) present theoretical polarimetric light curves expected in the case of optically thin NIR emission from over-dense regions close to the marginal stable orbit (see also Broderick et al. 2005, Eckart et al. 2006a, Zamaninasab et al. 2010, 2011). Using a numerical code the authors track the time evolution of detectable polarization properties produced by synchrotron emission of compact sources in the vicinity of the black hole. They show that the different setups lead to very special patterns in the time-profiles of polarized flux and the orientation of the polarization vector. As such, they may be used for determining the geometry of the accretion flow around SgrA* (see also Karas et al. 2011, Zamaninasab, et al. 2011).
During the 2013 Bad Honnef and the Granada conference (see Acknowledgments) efforts to monitor SgrA* during the DSO fly-by and first observational results from 2013 were reported by Akiyama, et al. (2013ab), Eckart et al. (2013abc), Jalali et al. (2013), Meyer et al. (2013), Phifer et al. (2013). The NRAO Karl G. Jansky Very Large Array (VLA) is undertaking an ongoing community service observing program to follow the expected encounter of the DSO cloud with the black hole SgrA* in 2013/14 (Chandler & Sjouwerman 2013). The NRAO VLA has been observing the Sgr A region since October 2012 on roughly a bi-monthly interval, cycling through eight observing bands. For monitoring the flux densities and in particular the radio spectral indices the short wavelength observations (6cm) are most useful. For 2012/13 no particular flux density variation was detected that could be attributed to the interaction between SgrA* and the DSO. This may be linked with the fact that the newly determined periapse passage is now expected to happen in April/May of 2014 (Phifer et al. 2013), i.e. later than originally anticipated. However, in the radio-shock frame in which variations of up to several Janskys were expected even during the pre-periapse time. Hence, the lack of strong radio flares indicates that the medium is less dense than expected and/or that the bow-shock size i.e. the cross-section of the dust source is much smaller than assumed (Narayan, et al. 2013, Crumley, et al. 2013, Sadowski, et al. 2013, Yusef-Zadeh, et al. 2013, Shcherbakov, et al. 2014).
1.2 VLBI imaging of SgrA*
There is also profound progress in imaging and modeling of the central putative accretion disk of SgrA* as well as the jet that may be associated with the source (Falcke & Markoff, 2013, Moscibrodzka & Falcke, 2013, Valencia-S, M. et al. 2012). In fact imaging of SgrA* may turn out to be a Rosetta Stone in the attempts of distinguishing between different relativity theories of black holes (e.g. Boller & Müller, 2013, on astronomical tests of general relativity and the pseudo-complex theory).
VLBI (Very Long Baseline Interferometry) observations at very short millimeter radio wavelengths can overcome the effects of interstellar scattering and allow us to study the source intrinsic structure of SgrA*. Large mm/sub-mm facilities like the VLBA (Very Long Baseline Array), VERA (VLBI Exploration of Radio Astrometry), ALMA (Atacama Large Millimeter Array), PdBI (Plateau de Bure Interferometer) and the sensitive mm-telescopes in the EVN (European VLBI Network) - such as the IRAM 30m and the 100m Effelsberg telescopes - are participating in this effort, which will eventually culminate in the project EHT (Event Horizon Telescope), a VLBI array especially designed to image the structures close to the event horizons of the larges SMBHs in the sky - namely SgrA* and M87, with 1 Schwarzschild radius extending to an angular size of about 10as and 3.7as, respectively. Multi-epoch imaging observations will allow to constrain the locations and sizes of the flaring region of SgrA* within the putative temporal accretion disk of the accretion stream/flow towards or an accretion wind from SgrA*. These measurements will also constrain the acceleration processes (e.g. magnetic reconnection events or non-axisymmetric standing shocks) that give rise to the population of relativistic electrons and the variable emission we see from SgrA*. Ultimatly, alternative black hole models will be probed and attempts to test the black hole no-hair theorem will be possible with the new VLB mm/sub-mm facilities (Broderick, et al. 2014, Fish et al. 2014, Akiyama, et al. 2013ab, Huang, et al. 2012, Broderick, et al. 2011, Broderick, et al. 2011, Fish et al. 2011, Lu, R.-S., et al. 2011).
These VLBI experiments will eventually enable spatially resolved studies on sub-horizon scales, leading to an unprecedented exploration of a putative predicted black-hole shadow (e.g. Huang et al. 2007) as an evidence for light trapping by the black hole as well as its interaction with the surrounding material. It will be possible to monitor the possible expansion of source components during flare activity. Furthermore, when a rotating black hole is immersed in a magnetic field of external origin, the gravito-magnetic interaction is capable of triggering the magnetic reconnection, accelerating the particles to very high energy (Karas et al. 2012, 2013; Morozova et al. 2014). This frame-dragging phenomenon is particularly interesting in the context of exploring the strong-gravity effects in astrophysical black holes because the effect does not have a Newtonian counterpart and it operates on the border of the ergospheric region (Koide & Arai 2008), i.e. very close to the black hole horizon, and it can be probed with the future EHT. Also, one can investigate if the black hole proximity generates conditions favourable to incite the magnetic reconnection that eventually leads to plasma heating and particle acceleration. This effect could contribute to the flaring activity.
1.3 The importance of dusty sources close to the center
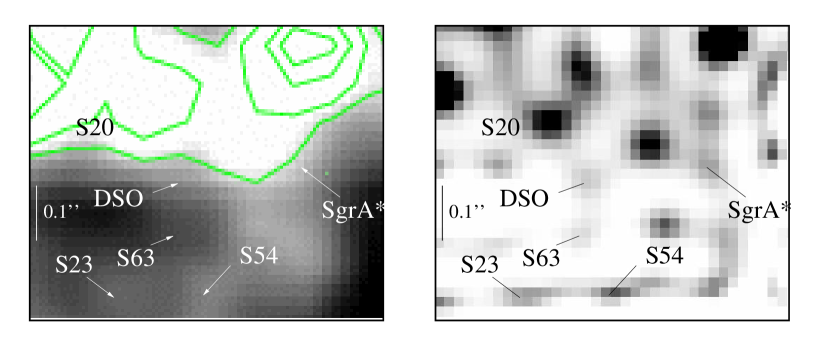
A major discussion point is if and how the DSO source will be disrupted during its peri-bothron222Peri- or apo-bothron is the term used for peri- or apoapsis - i.e. closest or furthest separation - for an elliptical orbit with a black hole present at one of the foci. As already mentioned by Frank and Rees (1976) word ’bothros’ was apparently first suggested in the context of black holes by W.R. Stoeger. It originates from the greek word ò ó with the equivalent meaning of ’the sink’ or ’the deep dark pit’. passage. It may be only its dusty envelope that will be disrupted since the Ks-band identifications of the source suggest that it can also be associated with a star (Eckart et al. 2013a). In addition to the VLT NACO and the Keck NIRC detections of the DSO NIR continuum emission (Eckart et al. 2013bc), here we show the detection of the DSO continuum at about K19 using SINFONI data (Fig. 4). The detection of the continuum emission in data sets taken with three different instrumental setups over many years strengthens the case for a substantial continuum emission from that dusty source. As posted in the astronomer’s telegram No.6110 on 2 May 2014 (Ghez et al. 2014), the DSO was detected 3.8m during its peri-bothron passage around the central black hole SgrA*. Hence, it appears to be intact and up to this point not yet heavily affected by tidal effects. This clearly supports our finding (Eckart et al. 2013bc) that it may very well be a dusty star rather than a pure gas and dust cloud.
In contrast to a pure dust and gas nature of the DSO its possible stellar (i.e. a dust enshrouded star) nature is discussed and partially favoured in Meyer et al. (2013, 2014), Eckart et al. (2013abc), Scoville & Burkert (2013) Ballone et al. (2013), Phifer et al. (2013). Eckart et al. (2013a) investigate the possible mass transfer across Lagrange point L1 in a simple Roche model. If the star has a mass of about 1M⊙, the separation of from it will be about 0.1 AU. For a Herbig Ae/Be stars with 2-8 M⊙ that distance will be between 0.2 and 0.5 AU. For a typical S-cluster stellar mass of 20-30 M⊙ the separation will be closer to one AU. The interferometrically determined inner ring sizes that one typically finds for young Herbig Ae/Be and T Tauri stars can indeed be as small as 0.1-1 AU (Monnier & Millan-Gabet 2002). Any stellar disk or shell may already have been stripped substantially if the DSO has performed more than a single orbit. If the source has a size of about 1 AU (as determined from its MIR-luminosity; Gillessen et al. 2012a) then a significant amount of the dusty circumstellar material may pass beyond during peri-bothron passage. This material will then start to move into the Roche lobe associated with SgrA*.
However, it is not at all clear what will happen to the transferred material after the peri-bothron passage around May 2014 or beyond. The fact that this dusty object may be a dust enshrouded star rather than a dust cloud will have an influence on the expected flux density variations resulting from the close approach. They may be much weaker than expected. Simulations (e.g. Burkert et al. 2012, Schartmann et al. 2012, see also Zajacek, Karas & Eckart 2014) that have discussed the feeding rate of SgrA* as a function of radius indicate that a portion of the material may fall towards SgrA*. If SgrA* is associated with a significant wind on scale of the peri-bothron separation, then a large part of the material may be blown away again by an out-bound accretion wind. Shcherbakov & Baganoff (2010) have discussed the feeding rate of SgrA* as a function of radius. Based on their modeling one may suggest that the bow-shock sources X3 and X7 (Muzic et al. 2010) are still in the regime in which most of the in-flowing mass is blown away again. Another case for comparison is the star S2. During its peri-bothron passage the star has been well within the zone in which matter of its (weak) stellar wind could have been accreted by SgrA*. The DSO peri-bothron will be at a larger radius than that of S2 (Phifer et al. 2013). This may imply that no enhanced accretion effect will result from it during the peri-bothron passage. Until May 2014 no increase in variability and no significant flux density increase well above normal levels has been reported in the radio to X-ray domains.
The fate of the DSO and the cometary sources X3 and X7 underline the importance of investigating the wind properties in the vicinity of SgrA* in more detail. IRS 8 is a unique possibility to study the bow shock properties and polarization features in the dusty environment at the Galactic Center. Based on a detailed study of near-infrared emission Rauch et al. (2013) present interstellar dust properties for the northern arm in the vicinity of the IRS 8 bow shock. This study allowed us for the first time to determine the relative positioning of IRS 8 with respect to the northern arm and the super-massive black hole SgrA*. The result indicates that the central star of IRS 8 is in fact located closer towards the observer than the northern arm. In Eckart et al. (2013a) we investigated the near-infrared proper motions and spectra of infrared excess sources at the Galactic Center. The work concentrated on a small but dense cluster of comoving sources (IRS13N) located 3” west of SgrA*. Our analysis shows that these stars are spectroscopically and dynamically young and can indeed be identified with continuum emission at 2 microns and shortward, indicating that these mid-infrared sources are not only dust sources but young stars. The possibility of ongoing star formation at the Galactic Center is supported through simulations by Jalali et al. 2014 (submitted) and Jalali et al. (2013). In fact the DSO may be a representative of dusty sources similar to those discussed in Eckart et al. (2006b; see their Fig.14; compare also to the discussion of sources X3 and X7 given by Muzic et al. 2010). Meyer et al. (2014) present NIR spectroscopic data of several of these sources. They also show that the DOS does not seem to be unique, since several red emission-line objects can be found in the central arcsecond. In summary, Meyer et al. (2014) conclude that it seems more likely that G2 is ultimately a stellar source that is clearly associated with gas and dust (see also Eckart et al. 2013abc).
1.4 Stellar dynamics and tests of relativity
SgrA*, the super-massive black hole at the center of the Milky Way, is surrounded by a small cluster of high velocity stars, known as the S-stars (Eckart & Genzel 1997). Sabha et al. (2012) aimed at constraining the amount and nature of the stellar and dark mass that is associated with the cluster in the immediate vicinity of SgrA*. The authors use near-infrared imaging to determine the Ks-band luminosity function of the S-star cluster members, the distribution of the diffuse background emission and the stellar number density counts around the central black hole. This allows us to determine the stellar light and mass contribution expected from the faint members of the cluster. Sabha et al. (2012) then use post-Newtonian N-body simulations to investigate the effect of stellar perturbations on the motion of S2, as a means of detecting the number and masses of the perturbers. The authors find that the stellar mass derived from the Ks-band luminosity extrapolation is much smaller than the amount of mass that might be present considering the uncertainties in the orbital motion of the star S2. Also the amount of light from the fainter S-cluster members is below the amount of the residual light at the position of the S-star cluster after one removes the bright cluster members. If the distribution of stars and stellar remnants is peaked near SgrA* strongly enough, observed changes in the orbital elements of S2 can be used to constrain both the masses and the number of objects inside its orbit. Based on simulations of the cluster of high velocity stars we find that in the NIR K-band - close to the confusion level for 8 m class telescopes - blended stars will occur preferentially near the position of SgrA* which is the direction towards which we find the highest stellar density. These blended stars consist of several faint, (with the current facilities) individually undetectable stars that get aligned along the line-of-sight, producing the visual effect of a new point source. The proper motion of stars and the corresponding velocity dispersion leads to the fact that such a blended star configuration dissolves typically after 3 years.
Stars that get very close to the super massive black hole are ideal probes to analyse the gravitational field and to search for effects of relativity due to the presence of the high mass concentration and its effect on space time. This can be done by tracing the orbit of stars through proper motions and radial velocities. As discussed in Zucker et al. (2006) relativistic effects should express themselves spectroscopically. The redshift of a black hole orbiting star can be written as:
| (5) |
with being an offset, describing the Doppler velocity and expressing the relativistic effects. Here the value contains equal contributions from the gravitational redshift and the special relativistic transverse Doppler effect. The combined effect gives a redshift that is about an order of magnitude larger than the currently achieved spectral resolution of 10-4. For S2 one expects about a 150-200 km/s signal measurable over a few months on top of an orbit-depending radial velocity of more than 4000 km/s. Expectations are high that this will be observable during the next peri-bothron for S2 around 2017.90.35 (Gillessen et al. 2009b, Eisenhauer et al. 2003) or S2-102 around 2021.00.3 (Meyer et al. 2013). Realistically, however, one needs several stars on different orbits to detect the relativistic effect with certainty (Zucker et al. 2006; see also Rubilar & Eckart 2001 for peri-bothron shift). Alternatively, one has to find stars that are (or get) closer than S2 and S2-102 (Meyer et al. 2013; see below) to SgrA*.
Detailed imaging and the analysis of proper motions may be another way to trace relativistic effects. An important deviation from Keplerian motion occurs as a result of relativistic corrections to the equations of motion, which to the lowest order predict a certain advance of the argument of peri-bothron each orbital period. Choosing mpc and for the semi-major axis and eccentricity of S2, respectively, and assuming a black hole mass of M⊙ this advance will be
| (6) |
The relativistic precession is prograde, and leaves the orientation of the orbital plane unchanged.
The location of the peri-bothron advances for each orbital period due to the spherically-symmetric component of the distributed mass that is resolved by the elliptical orbit of the star. The amplitude of this Newtonian “mass precession” is
| (7) |
Here, is the distributed mass within a radius , and is a dimensionless factor of order unity that depends on and on the power-law index of the density, (Merritt 2012). In the special case ,
| (8) |
so that
| (9) |
Mass precession is retrograde, i.e., opposite in sense to the relativistic precession.
The contribution of relativity to the peri-bothron advance is determined uniquely by the known values of and . A measured can then be used to constrain the mass enclosed within S2’s orbit, by subtracting and comparing the result with Equation (9). So far, this technique has yielded only upper limits on of (Gillessen et al. 2009a). First robust upper limits of that order have been derived by Mouawad et al. (2003, 2005). The role of relativistic effects versus the gravitational effects of the nuclear star cluster and a ring of stars are summarized by Subr et al. (2004).
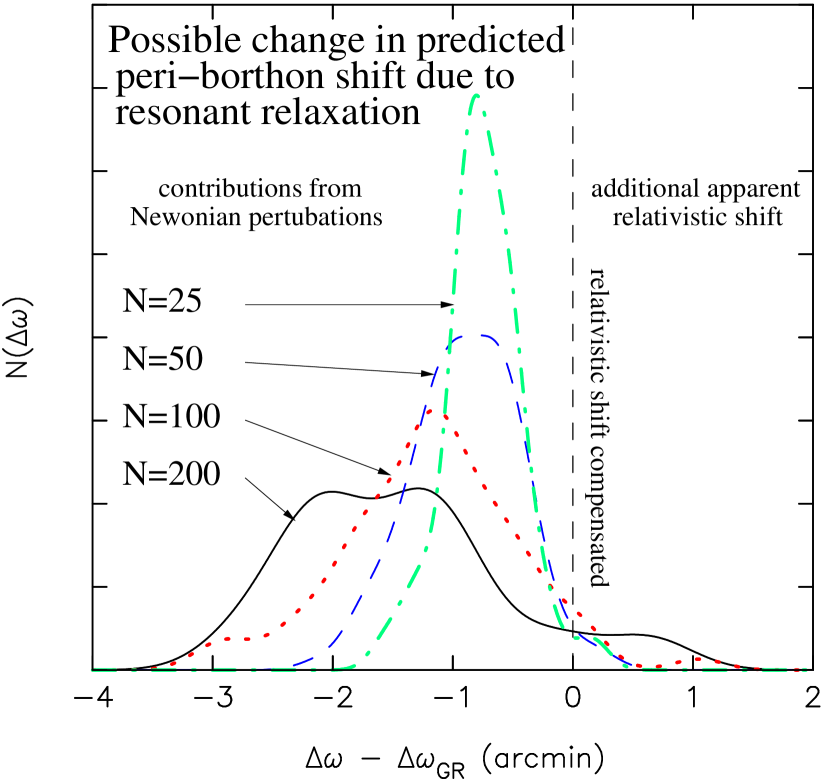
In addition to the relativistic effects on the orbit of a test star, and the precession due to the smooth matter distribution, the granularity of the cluster stars and stellar remnants needs to be considered. The granularity of the distributed mass makes itself felt via the phenomenon of “resonant relaxation” (RR; Rauch & Tremaine 1996, Hopman & Alexander 2006). On current observational time scales the stellar orbits near SgrA* remain nearly fixed in their orientations. The perturbing effect of each field star on the motion of a test star (e.g. S2) can be approximated as a torque that is fixed in time and proportional to the mass of the field star. Sabha et al. (2012) show that the effects of RR are competing with the relativistic and Newtonian periastron effects on the orbits of the known high velocity S-cluster stars. Following Sabha et al. (2012), we show in Fig. 6 the predicted change in S2’s orbital elements over the course of one orbital period ( yr). The shift due to relativity, , has been subtracted from the total; what remains is due to Newtonian perturbations from the field stars. Each histogram was constructed from integrations of 100 random realizations of the same initial model, with field-star mass , and four different values of the total number: (solid/black); (dotted/red); (dashed/blue); and (dot-dashed/green). The average value of the peri-bothron shift increases with increasing , as predicted by Equation (10). There is also a separate contribution that scales approximately as and that results in a variance about the mean value.
Sabha et al. (2012) show that the net effect of the torques from field stars is to change the angular momentum, , of S2’s orbit according to
| (10) |
where is the angular momentum of a circular orbit having the same semi-major axis as that of the test star. Here Equation 10 describes “coherent resonant relaxation”. Sabha et al. (2012) state that the normalizing factor should be of order unity (Eilon et al. 2009).
Changes in imply changes in both the eccentricity of the test star orbit, as well as changes in its orbital plane. Changes in the orbital plane can be described in a coordinate-independent way via the angle , where
| (11) |
and are the values of at two times separated by (Sabha et al. 2012). For small values of this can be written as
| (12) |
If we set equal to the orbital period of the test star, the changes in its orbital elements due to resonant relaxation are expected to be
| (13) | |||||
| (14) |
where is the number of stars having -values similar to, or less than, that of the test star (Sabha et al. 2012). The constants and may depend on the properties of the orbits of the field star distribution in the Galactic Center stellar cluster. More details are given in Sabha et al. (2012). The Kozai mechanism is another kind of resonant process that is thought to operate in the Galactic Center environment (Subr & Karas 2005, Chang 2009, Chen & Amaro- Seoane 2014).
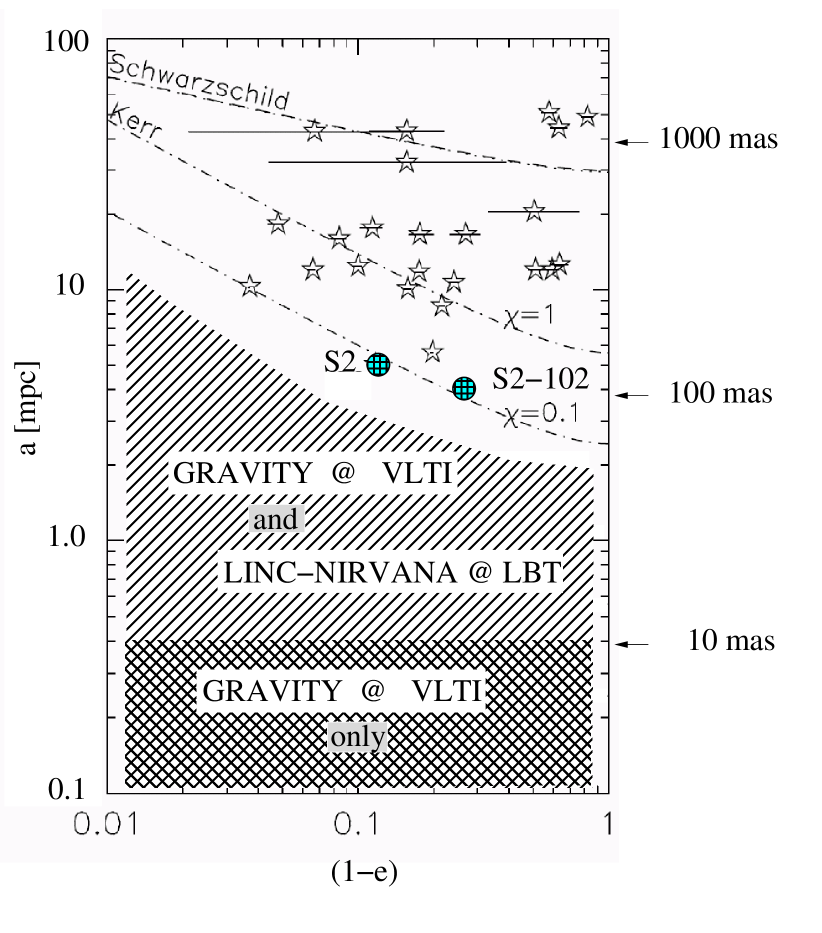
Figure Fig. 5 (following Antonini & Merritt 2013) plots the location of the S stars in the -plane (semimajor axis - ellipticity). The data for the two currently closest known stars S2 and S2-102 are indicated by pattern filled circles. For the two currently closest sources one finds:
(Meyer et al. 2013, Gillessen et al. 2009b, Eisenhauer et al. 2003; 1” at the distance of the Galactic Center corresponds to alinear scale of about ).
Also plotted in Fig. 5 are curves indicating where the effects of RR begin to be mediated by relativistic precession of the “test” star. The upper curve is the “Schwarzschild barrier” (Merritt et al. 2011); stars below this curve precess due to GR so rapidly that their precession, rather than the mean precession rate of the field stars, determines the coherence time over which the RR torques can act. This is reflected in the horizontal tick marks which give the expected amplitude of eccentricity changes as an orbit precesses in the essentially fixed torquing field due to the field stars. The location of the Schwarzschild barrier in the -plane depends somewhat on the assumed spatial distribution of the stars in the nuclear cluster, but for most reasonable distributions, S2 lies below the barrier (Antonini & Merritt 2013). Closer to SgrA*, frame-dragging torques due to the spin of SgrA* begin to make themselves felt. The two lower curves on Fig. 6 mark where these torques begin to compete with RR torques. In this regime, orbits precess so rapidly that their eccentricities are essentially unaffected by the torques, but their orbital planes can still change (“vector RR”). Below the curves marked “Kerr” in Fig. 5 are curves indicating where the effects of RR begin to be changes in orbital planes due to frame dragging dominate the changes due to vector RR (Merritt et al. 2010). Stars in this regime can be used to test theories of gravity, e.g., “no-hair” theorems.
Fig. 5 also shows the -regions that will be experimentally accessible with the new upcoming interferometric instrumentation in the NIR like GRAVITY at the VLTI and LINC-NIRVANA at the LBT (see below). Only for stars at much smaller orbital separations from SgrA* than S2 or S2-102, as they may be found with infrared interferometers like GRAVITY at the VLTI or LINC-NIRVANA at the LBT (see below), are Newtonian perturbations (mass precession, RR) negligible compared with the effects of GR. However, even then one will need more than one star with different orbital elements in order to clearly demonstrate that the eventually observed orbital changes are truly due to relativistic effects (see e.g. Merritt et al. 2010, Will 2008 , Zucker et al. 2006, Rubilar & Eckart 2001).
1.5 Effects due to stellar collisions
The stellar density close to center is in excess of 105 M⊙ per cubic-parsec. This implies that in this region the evolution of stars is influenced by stellar collisions (e.g. Davies et al. 2011, Church et al. 2009). Observations of the stars at the Galactic Center show that there is a lack of red giants within about 0.5 pc of the super-massive black hole. The very high stellar number densities this close to the SMBH imply that the giants – or their progenitors – may have been destroyed by stellar collisions. The derivation of collisional rates between different types of stars at the Galactic Center and their likely effects are currently a field of intense investigation in order to quantify how large a contribution stellar collisions could make to the puzzle of the missing red giants (Dale et al. 2009). As an example see recent contributions on star formation (see also references below), and on the structure of the central stellar cluster and stellar interactions in the Galactic Center area by Sabha et al. (2012), Perets et al. (2014), Mastrobuono-Battisti & Perets (2013), Haas & Subr (2012), Subr & Haas (2012), Haas, Subr & Vokrouhlicky (2011), Feldmeier et al. (2013).
1.6 Pulsars at the Galactic Center
Another very promising way of investigating the super-massive black hole properties in great detail is to find pulsars orbiting SgrA*. If close enough, they would allow us to measure the spin and quadrupole moment of the central black hole with superb precision enabling us to test different theories of gravity (Psaltis et al. 2012). The number of pulsars in the central cluster will depend on the star formation history in the overall region. The discovery of radio pulsations from a magnetar PSR J1745-2900 with the Effelsberg telescope has highlighted the great value and the efforts that are currently being undertaken to find pulsars in the Galactic Center region (Spitler et al. 2014, Lee et al. 2013, Mori et al. 2013, Eatough et al. 2013a, Eatough et al. 2013b).
1.7 Star formation and the Galactic Center
Star formation activity in the Galactic Center is an ongoing research topic (e.g. Yusef-Zadeh et al. 2009, 2010, 2013). Given the deep gravitational potential towards the very center, stars cannot form in the same way they do throughout the Milky Way. However, infrared observations have shown evidence that massive stars were formed in the hostile environment of SgrA* a few million years ago. VLA, ALMA and CARMA measurements suggest that star formation is still taking place in this region and has been going on during the past few 105 years. A broad variety of possible star formation scenarios can be discussed. Massive stars may have formed within a disk of molecular gas resulting from a passage of a giant molecular cloud interacting with SgrA* and then dispersed after having formed these stars (Nayakshin, Cuadra & Springel 2007). Dense clumps originating from the CND loosing angular momentum and falling towards the very center may also be a source of constant or episodic star formation in the Galactic Center (Jalali et al. 2013). A fraction of the material associated with these phenomena may have accreted onto SgrA* probably in an episodic or transient manner (Czerny et al. 2013). This process may in part be responsible for the origin of the -ray emitting Fermi bubbles (Su, Slatyer & Finkbeiner 2010).
1.8 The Galactic Center on larger scales
Radio polarization observations by the Parkes radio telescope in Australia have recently led to the discovery of giant radio lobes emanating from the Galactic nucleus (Zubovas & Nayakshin 2012, Bland-Hawthorn et al. 2013). These lobes are largely coincident with the Fermi Bubbles discovered in the -ray domain (Su, Slatyer & Finkbeiner 2010). However, the radio outflows extend to even larger angular scales, covering about 55 to 60 degrees north and south of the Galactic plane. It is likely that the radio lobes – and the Fermi Bubbles – are the result of the concentrated star formation occurring in the Central Molecular Zone of the Milky Way rather than signatures of putative activity of the super-massive black hole. These Fermi bubbles may be related to the giant magnetized outflows from the Galactic Center (Crocker 2012, Crocker et al. 2011, Crocker & Aharonian 2011). These phenomena link the Galactic Center nuclei of nearby active galaxies and larger scale events (e.g. amounts of gas escaping from the potential well of the galaxy). Massive inflow of gas towards the centers, as well as star formation or jet driven outflows from the nuclear regions, are frequently observed and are directly or indirectly linked with the accretion processes onto super-massive black holes.
2 Extragalactic Nuclei
The observational results obtained on the Galactic Center during the past few years need to be put into perspective. The nucleus of our Galaxy has an extremely low luminosity. However, it also demonstrates that violent activity may take place at times. Hence, a comparison between the center of the Milky Way and the nuclei of galaxies hosting Low Luminosity Active Galactic Nuclei (LLAGN) appears to be imperative.
Footprints of AGN feeding and feedback in LLAGN can be observed in many cases (Garcia-Burillo & Combes 2012, Garcia-Burillo et al. 2012, Marquez & Masegosa 2008). The study of the content, distribution and kinematics of interstellar gas is a key to understanding the fueling of AGN and star formation activity in galaxy disks. Current mm-interferometers provide a sharp view of the distribution and kinematics of molecular gas in the circumnuclear disks of galaxies through extensive mapping of molecular line (mainly CO and to some extent high density tracers like HCN, HCO+, CS etc). The use of molecular tracers specific to the dense gas phase can probe the influence of feedback on the chemistry and energy balance in the interstellar medium of galaxies. Radiative and mechanical feedback are often used as a mechanism of self-regulation in galaxy evolution as well as thermal and non-thermal AGN activity. In the disks of galaxies the evolution is predominantly expressed in star formation and the evolution of stellar populations and the ISM properties. In galactic nuclei the thermal part is represented mainly by the properties of the nuclear ISM and by the NLR and BLR regions while the non-thermal part is dominated by synchrotron/SSC emission due to SMBH accretion and the presence of jets.
High angular resolution (1”) observations with sub(mm)-interferometers (IRAM PdBI, ALMA) in the context of the NUclei of GAlaxies (NUGA) survey (e.g. Garcia-Burillo & Combes 2012, Garcia-Burillo et al. 2012, Garcia-Burillo et al. 2003, Krips et al. 2007, Moser et al. 2013, and upcoming more ALMA NUGA papers) allow us to study the mechanisms responsible for fueling AGN and star formation activity in the central R1 kpc disks of a sample of 25 active galaxies at the 10-100 pc scale. This study has revealed streaming motions towards and away from the nuclear region that do not necessarily have to be co-phased with current AGN activity. In several cases these observations also reveal the presence of molecular circumnuclear disks and massive molecular outflows.
These phenomena are directly coupled to black-hole fueling, feedback and duty cycles that are essential for understanding the activity in galactic nuclei (Mundell et al. 2003, 2004, 2007, 2009; see also Combes et al. 2014, Heckman & Best 2014). The distribution of gas and stars in nearby galaxies traced by 3-D studies of molecular, neutral and ionized gas provides a unique view of the role of the multi-phase medium in triggering and fueling nuclear activity in galactic nuclei on scales ever closer to the central black hole. Radio- and mm-interferometers and in particular 3-dimensional imaging devices in the infrared and optical domain (like integral field units) allow us to obtain spectroscopic and photometric information at every position of the field-of-view. Such observations have been used to elaborate comparative studies of gaseous and stellar dynamics in active and quiescent galaxies. Studying the inner kiloparsec of AGN is particularly important, since the activity and dynamical time scales become comparable in this region. These investigations also show that the variability observed in nearby radio-quiet AGN may provide parallels to our own Galactic Center. They also provide evidence that AGN duty cycles may be shorter than previously thought.
3 Black Hole Laboratory: New instrumentation and perspective
An improved link between theory and observations will be provided by new and upcoming instrumentation such as the future capability of measuring polarization in the X-ray domain (Soffitta et al. 2012, 2013), and direct VLBI imaging of the event horizon region for e.g. M87 as a representative of the largest super massive black holes, and SgrA* as a representative for low-mass SMBHs (Dexter et al. 2012, Fish et al. 2014, Broderick et al. 2014). The SKA (Square Kilometer Array) will be key instrument to stablish the census of pulsars at the Galactic Center, to determine the star formation history, and to provide the required precision to determine the spin and quadrupole of the central BH, testing the theories of gravity (e.g. Aharonian et al. 2013).
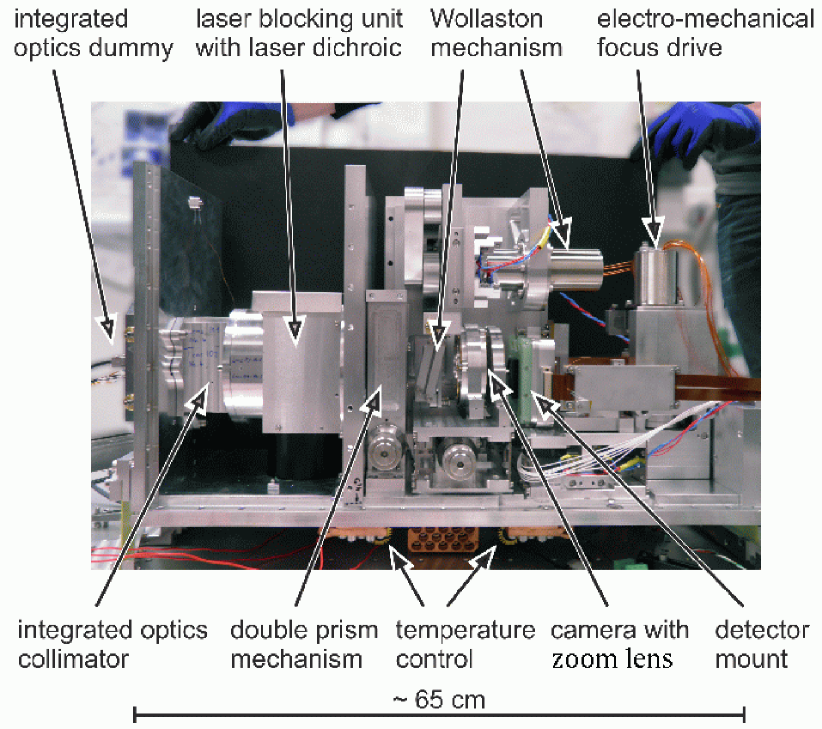
The beam combining instrument GRAVITY333http://www.mpe.mpg.de/2441478/Team at the VLTI (P.I. Frank Eisenhauer, MPE, Garching) will be able to measure the NIR image centroid paths during flux density excursions of SgrA* (Eisenhauer et al. 2011, Straubmeier et al. 2012, Eckart et al. 2010, 2012). These paths will depend on the geometrical structure and time evolution of the emitting region i.e. spot shape, e.g. presence of a torus or spiral-arm patterns, an emerging jet component. Fig. 7 shows the fringe tracking spectrometer of GRAVITY being under construction at the University of Cologne. Operating on six interferometric baselines, i.e. using all four UTs, the 2nd generation VLTI instrument GRAVITY will deliver narrow angle astrometry with 10as accuracy at the infrared K-band.
While most of the mentioned geometries are currently able to fit the observed variable emission from SgrA*, future NIR interferometry with GRAVITY at the VLTI will break some of the degeneracies between different emission models. GRAVITY will be able to detect the positional shift of the photo-center of a flare at the Galactic Center within the 20 min orbital time scale of a source component close to the last stable orbit, using the flares as dynamical probes of the gravitational field around SgrA*. In particular GRAVITY observations of polarized NIR light could reveal a clear centroid track of bright spot(s) orbiting in the mid-plane of the accretion disk (e.g. Zamaninasab et al. 2010, 2011). A non-detection of centroid shifts may point at a multi-component model or spiral arms scenarios. However, a clear wander between alternating centroid positions during the flares will strongly support the idea of bright long-lived spots occasionally orbiting the central black hole.
Acknowledgments: In this article we summarize contributions on the Galactic Center, held at the conference ’Equations of Motion in Relativistic Gravity’ at the Physikzentrum Bad Honnef, Bad Honnef, Germany, (February 17-23, 2013) 444http://www.puetzfeld.org/eom2013.html and the COST action MP0905 - ”Black Holes in a Violent Universe” - Galactic Center GC2013 conference555http://www.astro.uni-koeln.de/gc2013 and http://galacticcenter.iaa.es/ titled ’The Galactic Center Black Hole Laboratory’ held at the Instituto de Astrofisica de Andalucia (IAA-CSIC) in Granada, Spain (November 19 - 22, 2013). The main goal of the COST conference and the contribution in Bad Honnef was to focus on the new observational and theoretical results that are linked to the Galactic Center and to point out possible consequences for our understanding of galactic nuclei in general. The COST conference brought together scientists working on all mass-scales of Black Holes (Quantum to super-massive), observers and theoreticians as well as particle physicists.
We are grateful to D. Merritt for constructive comments on the draft. thank especially the Local Organizing Committees of the Bad Honnef and the Granada conferences. We thank especially the Local Organizing Committees of the Bad Honnef and the Granada conferences. For Bad Honnef we thank the organizers D. Puetzfeld, C. Laemmerzahl, B.F. Schutz as well as the staff of the Physikzentrum Bad Honnef, Bad Honnef, Germany. The Granada conference was hosted by and held at the Instituto de Astrofisica de Andalucia (IAA-CSIC), Spain. We thank especially the Local Organizing Committee at the IAA-CSIC that was lead by Dr. Antxon Alberdi (antxon@iaa.es). The Granada conference was also closely linked to and substantially supported by the COST Action MP1104 - ”Polarization as a tool to study the Solar System and beyond”, the FP7 action ”Probing Strong Gravity by Black Holes Across the Range of Masses” [FP7-SPACE-2012-1 (FP7-312789)], and the collaborative research center SFB956 ”Conditions and Impact of Star Formation - Astrophysics, Instrumentation and Laboratory Research”. We also thank RadioNet for support. We are also grateful to all SOC members of the Granada conference: Vladimir Karas, Michal Dovciak, Devaky Kunneriath, Delphine Porquet, Andreas Eckart, Silke Britzen, Anton Zensus, Michael Kramer, Wolfgang Duschl, Antxon Alberdi , Rainer Schödel, Murat Hüdaver, Carole Mundell, Farhad Yusef-Zadeh, Andrea Ghez, Mark Morris. This work was supported in part by the Deutsche Forschungsgemeinschaft (DFG) via the Cologne Bonn Graduate School (BCGS), the Max Planck Society through the International Max Planck Research School (IMPRS) for Astronomy and Astrophysics, as well as special funds through the University of Cologne.
References:
Aharonian, F., et al.,”Pathway to the Square Kilometer Array”, The German White Paper, 2013, arXiv:1301.4124
Akiyama, K.; Takahashi, R.; Honma, M.; Oyama, T.; Kobayashi, H.; 2013a, PASJ 65, 91
Akiyama, K.; Kino, M.; et al., 2013b, arXiv1311.5852A
Antonini & Merritt 2013, ApJ 763 ,L10
Baganoff, F. K.; Maeda, Y.; Morris, M.; et al., 2003, ApJ 591, 891
Baganoff, F. K.; Bautz, M. W.; Brandt, W. N.; et al., 2001, Natur 413, 45
Ballone, A.; Schartmann, M.; Burkert, A.; et al., ApJ 776, 13
Barriere, N.M.; Tomsick, J.A.; Baganoff, F.K.; et al., 2014, arXiv1403.0900B
Bland-Hawthorn, J.; Maloney, Philip R.; Sutherland, Ralph S.; Madsen, G. J., 2013, ApJ 778, 58
Boller, Th.; Müller, A., 2013, Exciting Interdisciplinary Physics, FIAS Interdisciplinary Science Series. ISBN 978-3-319-00046-6. Springer International Publishing Switzerland, 2013, p. 293
Bower, G.C., Falcke, H. , and Backer, D.C, 1999, ApJ 523, L29
Bower, G.C. , Backer, D.C., et al., 1999, ApJ 521, 582
Bower, Geoffrey C., 2003, Ap&SS 288, 69
Broderick, A.E.; Fish, V.L.; Doeleman, S.S.; Loeb, A.; 2011, ApJ 738, 38
Broderick, A.E.; Fish, V.L.; Doeleman, S.S.; Loeb, A.; 2011, ApJ 735, 110
Broderick, A.E.; Johannsen, T.; Loeb, A.; Psaltis, D.; 2014, ApJ 784, 7
Broderick, A.E.; Loeb, A., 2005, MNRAS 363, 353
Burkert, A.; Schartmann, M.; Alig, C.; et al., 2012, ApJ 750, 58
Chang, P., 2009, MNRAS, 393, 224
Chen, Xian; Amaro-Seoane, P., 2014, submitted (arXiv: 1401.6456)
Chandler, C.J.; Sjouwerman, L.O., The Astronomer’s Telegram, No. 5727 and related ones
Church, R. P.; Tout, Christopher A.; Hurley, Jarrod R., 2009, PASA 26, 92
Combes, F.; Garcia-Burillo, S.; Casasola, V.; et al., 2014, arXiv1401.4120C
Crocker, R.M., 2012, MNRAS 423, 3512
Crocker, Roland M.; Aharonian, Felix, 2011, PhRvL 106, 1102
Crocker, R.M.; Jones, D.I.; Aharonian, F.; et al., 2011, MNRAS 411, L11
Crumley, P.; Kumar, P., 2013, MNRAS 436, 1955
Czerny, B., Kunneriath, D., Karas, V., Das, T.K., 2013, A&A, 555, id.A97
Dale, J.; Davies, M.B.; Church, R.P.; Freitag, M., 2009, MNRAS, 393, 1016
Dexter, J. & Fragile, P.Ch.,2013, MNRAS 432, 2252
Dexter, J.; Kelly, B.; Bower, G.C.; Marrone, D.P.; 2013, arXiv1308.5968D
Dexter, J.; Agol, E.; Fragile, P. C.; McKinney, J. C., 2012, JPhCS 372,id. 012023
Dexter, J., Agol, E., et al., 2010, ApJ, 717, 1092
Davies, M. B.; Church, R. P.; Malmberg, D.; Nzoke, S.; Dale, J.; Freitag, M., 2011, ASPC 439, 212
Eatough, R.P.; Falcke, H.; Karuppusamy, R.; 2013, Natur 501, 391
Eatough, R.; Karuppusamy, R.; Kramer, M.; et al., 2013, ATel 5027, 1
Eckart, A.; Muzic, K.; Yazici, S.; et al., 2013a, A&A 551, 18
Eckart, A.; Britzen, S.; Horrobin, M.; et al., 2013b, arXiv1311.2743E
Eckart, A.; Horrobin, M.; Britzen, S.; et al., 2013c, arXiv1311.2753E
Eckart, A.; Garcia-Marin, M.; et al., 2012, A&A 537, 52
Eckart, A., Eckart, A.; Garcia-Marin, M.; Vogel, S. N.; Teuben, P., et al. 2012 A&A 537, 52
Eckart, A.; Sabha, N.; Witzel, G.; Straubmeier, C., 2012, SPIE 8445, 1
Eckart, A.; Zamaninasab, M.; Straubmeier, C.; et al. 2010, SPIE 7734, 27
Eckart, A.; Baganoff, F. K.; Zamaninasab, M.; Morris, M. R.; Schödel, R.; et al., 2008a, A&A 479, 625
Eckart, A.; Schödel, R.; Garcia-Marin, M.; Witzel, G.; Weiss, A.; et al., 2008b, A&A 492, 337
Eckart, A.; Schödel, R.; Meyer, L.; Trippe, S.; Ott, T.; Genzel, R., 2006a, A&A 455, 1
Eckart, A.; Baganoff, F. K.; Schödel, R.; Morris, M.; et al, 2006b, A&A 450, 535
Eckart, A.; Genzel, R., 1997, MNRAS 284, 576
Eisenhauer, F.; Perrin, G.; Brandner, W.; Straubmeier, C.; et al., 2011, Msngr 143, 16
Eisenhauer, F.; Schödel, R.; Genzel, R.; Ott, T.; Tecza, M.; Abuter, R.; Eckart, A.; Alexander, T., 2003, ApJ 597, L121
Eisenhauer, Frank, 2010, IAUS 261, 269
Eilon, E., Kupi, G., & Alexander, T. 2009, ApJ, 698, 641
Falcke, H.; Markoff, S. B., 2013, Classical and Quantum Gravity, 30, Issue 24, id. 244003
Falcke, H., & Markoff, S. 2000, A&A, 362, 113
Feldmeier, A.; Lützgendorf, N.; Neumayer, N.; et al., 2013, A&A 554, 63
Fish, V.L.; Doeleman, S.; Krichbaum, T.; Zensus, A.; Event Horizon Telescope Collaboration;; 2014, AAS 22344304
Fish, V.L.; Doeleman, S.S.; Beaudoin, C.; Blundell, R.; Bolin, D.E.; Bower, G.C.; et al.; 2011, ApJ 727, L36
Frank, J.; Rees, M. J.; 1976, MNRAS 176, 633
Garcia-Burillo, S.; Combes, F., 2012, JPhCS, 372, id 2050
Garcia-Burillo, S.; Usero, A.; Alonso-Herrero, A.; et al., 2012, A&A 539, 8
Garcia-Burillo, S.; Combes, F.; Hunt, L. K.; et al., 2003, A&A 407, 485
Ghez, A.M., Witzel, G., Sitarski B., Meyer L., et al.; 2014, ATel #6110; (http://www.astronomerstelegram.org/?read=6110)
Ghez, A. et al., 2009, Astro2010: The Astronomy and Astrophysics Decadal Survey, Science White Papers, no. 89
Ghez, A. M.; Salim, S.; Hornstein, S. D.; et al., 2005, ApJ 620, 744
Gillessen, S.; Genzel, R.; Fritz, T. K.; et al., 2012, Natur 481, 51
Gillessen, S., Eisenhauer, F., Trippe, S., et al. 2009a, ApJ, 692, 1075
Gillessen, S.; Eisenhauer, F.; Fritz, T.K.; et al., 2009b, ApJ 707, L114
Gould R.J., 1979, A&A 76, 306
Haas, J.; Subr, L.; Vokrouhlicky, D., 2011, MNRAS 416, 1023
Haas, J.; Subr, L., 2012, JPhCS.372, id. 2059
Heckman, T.; Best, P., 2014arXiv1403.4620H
Hopman, C. & Alexander, T. 2006a, ApJ, 645, 1152
Huang, L.; Shen, Z.-Q.; Gao, F. ; 2012, ApJ 745, L20
Huang, Lei; Cai, M.; Shen, Z.-Q.; Yuan, F., 2007, MNRAS 379, 833
Jalali, B.; Pelupessy, I.; Eckart, A.; 2013, arXiv1311.4881J
Karas, V.; Dovciak, M.; Zamaninasab, M.; Eckart, A., 2011, ASPC 439, 344
Karas, V.; Kopacek, O.; Kunneriath, D., 2012, Classical and Quantum Gravity, 29, id. 035010
Karas, V.; Kopacek, O.; Kunneriath, D., 2013, International Journal of Astronomy and Astrophysics, 3, 18
Koide, S.; Arai, K., 2008, ApJ, 682, 1124
Krips, M.; Eckart, A.; Krichbaum, T. P.; et al., 2007, A&A 464, 553
Lee, K.J.; Eatough, R.; Karuppusamy, R.; 2013, ATel 5064, 1
Lu, R.-S.; Krichbaum, T.P.; Eckart, A.; König, S.; Kunneriath, D.; Witzel, G.; Witzel, A.; Zensus, J. A.; 2011, A&A 525, 76
Macquart, J.-P., Bower, G.C., Wright, M.C.H. , et al., 2006, ApJ 646, L111
Marquez, I.; Masegosa, J., 2008, RMxAC 32, 150
Marscher, A.P., 1983, ApJ 264, 296
Merritt, D. 2012, Dynamics and Evolution of Galactic Nuclei”, (Princeton University Press)
Merritt, D., Alexander, T., Mikkola, S., & Will, C. M., 2010, PhRvD 81, 062002
Merritt, D., Alexander, T., Mikkola, S., & Will, C. M., 2011, PhRvD 84, 044024
Marrone, D. P., Baganoff, F. K., Morris, M., et al. 2008, ApJ, 682, 373
Mastrobuono-Battisti, Alessandra; Perets, Hagai B., 2013, ApJ 779, 85
Mouawad, N.; Eckart, A.; Pfalzner, S.; Schödel, R.; Moultaka, J.; Spurzem, R.; 2005, AN326, 83
Mouawad, N.; Eckart, A.; Pfalzner, S.; Moultaka, J.; Straubmeier, C.; Spurzem, R.; Schödel, R.; Ott, T.; 2003, ANS 324, 315
Moser, L.; Zuther, J.; Fischer, S.; Busch, G.; et al., 2013, arXiv1309.6921M
Mundell, C.G.; James, P.A.; Loiseau, N.; et al., 2004, ApJ 614, 648
Mundell, C. G.; Wrobel, J. M.; Pedlar, A.; 2003, ApJ 583, 192
Mundell, C. G.; Dumas, G.; et al., 2007, NewAR 51, 34
Mundell, C.G.; Ferruit, P.; Nagar, N.; Wilson, A. S., 2009, ApJ 703,802
Mori, K.; Gotthelf, E.V.; Zhang, S.; et al., 2013, ApJ 770, L23
Morozova, V.S.; Rezzolla, L.; Ahmedov, B.J., 2014, submitted (arXiv:1310.3575)
Moscibrodzka, M.; Falcke, H., 2013, A&A 559, L3
Meyer, Leo; Ghez, A. M.; Do, T.; Boehle, A.; et al. 2014, AAS22310807M
Meyer, L.; Ghez, A. M.; Witzel, G.; et al., 2013, arXiv1312.1715M
Meyer, L.; Ghez, A. M.; Schödel, R.; Yelda, S.; Boehle, A.; et al.; 2012, Sci 338, 84
Muzic, K.; Eckart, A.; Schödel, R.; et al. 2010, A&A 521, 13
Narayan, R.; Özel, F.; Sironi, L., 2012, ApJ 757, L20
Narayan, R.; Mahadevan, R.; Grindlay, J. E.; Popham, R. G.; Gammie, C., 1998, ApJ 492, 554
Nayakshin, S.; Cuadra, J.; Springel, V., 2007, MNRAS 379, 21
Nowak, M. A.; Neilsen, J.; Markoff, S. B.; et al., 2012, ApJ 759, 95
Perets, Hagai B.; Mastrobuono-Battisti, Alessandra, 2014, arXiv1401.1824P
Phifer, K.; Do, T.; Meyer, L.; et al., 2013, ApJ 773, L13
Porquet, D.; Grosso, N.; Predehl, P.; et al., 2008, A&A 488, 549
Porquet, D.; Predehl, P.; Aschenbach, B.; Grosso, N.; et al., 2003, A&A 407, L17
Psaltis, D., 2012, ApJ, 759, 130
Rauch, K. P. & Tremaine, S. 1996, New A, 1, 149
Rea, N.; Esposito, P.; Pons, J. A.; Turolla, R.; et al., 2013, ApJ 775, L34
Rubilar, G. F.; Eckart, A., 2001, A&A 374, 95
Sabha, N., Merritt, D.; et al., 2012, A&A 545, 70
Sadowski, A.; Sironi, L.; Abarca, D.; et al., 2013, MNRAS 432, 478
Schartmann, M.; Burkert, A.; Alig, C.; et al., 2012, ApJ 755, 155
Scoville, N.; Burkert, A., 2013, ApJ 768, 108
Shannon, R.M.; Johnston, S., 2013, MNRAS 435, L29
Shcherbakov & Baganoff (2010)
Shcherbakov, R.V., 2014, ApJ 783, 31
Spitler, L.G.; Lee, K.J.; Eatough, R.P.; Kramer, M.; 2014, ApJ 780, L3
Soffitta, P.; Campana, R.; Costa, E.; et al. 2012, SPIE 8443, 1
Soffitta, P.; Barcons, X.; Bellazzini, R.; et al., 2013, ExA 36, 523
Straubmeier, C.; Fischer, S.; Araujo-Hauck, C.; et al., 2012, SPIE 8445, 2
Su, M.; Slatyer, T.R.; Finkbeiner, D.P., 2010, ApJ 724, 1044
Subr, L.; Karas, V.; Hure, J.-M., 2004, MNRAS, 354, 1177
Subr, L.; Karas, V., 2005, A&A 433, 405
Subr, L.; Haas, J., 2012, JPhCS 372, id. 2018
Valencia-S, M.; Bursa, M.; Karssen, G.; Dovciak, M.; Eckart, A.; Horak, J.; Karas, V., 2012, JPhCS, 372, 2073
Will, C. M., 2008, ApJ 674, L25
Witzel et al. 2012 ApJS 203, 18
Yoshikawa, T.; Nishiyama, S.; et al., 2013, ApJ 778, 92
Yuan, Feng; Shen, Zhi-Qiang; Huang, Lei, 2006, ApJ 642, L45
Yusef-Zadeh, F.; Wardle, M., 2013, ApJ 770, L21
Yusef-Zadeh, F.; Royster, M.; Wardle, M.; et al., 2013, ApJ 767, L32
Yusef-Zadeh, F.; Hewitt, J. W.; Arendt, R. G.; et al., 2009, ApJ 702, 178
Yusef-Zadeh, F.; Lacy, J. H.; Wardle, M.; et al., 2010, ApJ 725, 1429
Yusef-Zadeh, F.; Roberts, D.; Wardle, M.; et al., 2006, ApJ 650, 189
Zamaninasab, M.; Eckart, A.; Dovciak, M.; Karas, V.; et al., 2011, MNRAS 413, 322
Zamaninasab, M.; Witzel, G.; Eckart, A.; Sabha, N.; et al., 2011, ASPC 439, 323
Zamaninasab, M.; Eckart, A.; Witzel, G.; Dovciak, M.; Karas, V.; et al., 2010, A&A 510, 3
Zajacek, M, Karas, V., Eckart, A., accepted by A&A 2014
Zubovas, K. & Nayakshin, S., 2012, MNRAS 424, 666
Zucker, S.; Alexander, T.; et al., 2006, ApJ 639, L21