Light-Element Abundances of Giant Stars in the Globular Cluster M71 (NGC 6838)
Abstract
Aluminum is the heaviest light element displaying large star–to–star variations in Galactic globular clusters (GCs). This element may provide additional insight into the origin of the multiple populations now known to be a common place in GCs, and also the nature of the first-generation stars responsible for a cluster’s chemical inhomogeneities. In a previous analysis we found that, unlike more metal-poor GCs, 47 Tuc did not exhibit a strong Na-Al correlation, which motivates a careful study of the similar metallicity but less massive GC M71. We present chemical abundances of O, Na, Al, and Fe for 33 giants in M71 using spectra obtained with the WIYN-Hydra spectrograph. Our spectroscopic analysis finds that, similar to 47 Tuc and in contrast with more metal-poor GCs, M71 stars do not exhibit a strong Na-Al correlation and span a relatively narrow range in [Al/Fe], which are characteristics that GC formation models must reproduce.
I Introduction
Multiple and discrete photometric sequences found in most globular clusters (GCs), e.g. Omega Cen (e.g. Bedin et al. 2004), M54 (e.g. Bellazzini et al. 2008), NGC 2808 (e.g. Bedin et al. 2000, Piotto et al. 2007), NGC 1851 (e.g. Milone et al. 2008, Han et al. 2009), and NGC 6752 (e.g. Milone et al. 2009), demonstrate that GCs are not simple stellar populations (see also Piotto et al. 2014 for the first results of a large HST UV survey of Galactic GCs). In addition to photometric studies, the large star-to-star light-element abundance variations of C, N, O, Na, Mg, and Al, coupled with characteristic (anti)correlations (e.g., C-N, Na-O, Mg-Al) extending down to the main-sequence (MS), are considered compelling evidence that GCs host multiple stellar populations with unique chemistry (e.g., see reviews by Gratton et al. 2004; 2012). In this framework a first generation of stars forms with a composition matching the cluster’s primordial gas, and later the more massive stars inject processed material into the cluster interstellar medium. Subsequent generations that form then reflect a composition that is a mixture of the primordial gas cloud and any retained processed material. Rapidly rotating massive stars (e.g., Decressin et al. 2007, Decressin et al. 2010; Charbonnel et al. 2013), asymptotic giant branch (AGB) stars (e.g., Ventura et al. 2001, D’Ercole et al. 2008; D’Antona et al. 2012), massive binary stars (de Mink et al. 2009), and supermassive stars (Denissenkov & Hartwick 2014) have all been considered to explain the abundances patterns of second generation stars in GCs. Improving our understanding of the chemical enrichment history of GCs and the nature of the progenitors responsible for the gas pollution requires increasing both the number of stars with known chemical abundances and the number of clusters surveyed sampling a broad range in both GC mass and metallicity. For instance, Carretta et al. (2010) found that some of the more luminous or massive GCs display a more extended Na-O anticorrelation. Furthermore, larger spreads in Al content are found in more metal-poor GCs, such as M13 (e.g., Shetrone 1996, Kraft et al. 1997, Cavallo & Nagar 2000, Sneden et al. 2004; Cohen & Meléndez 2005; Johnson et al. 2005), M5 (Ivans et al. 2001), M80 (Cavallo et al. 2004), NGC 6752 (Carretta et al. 2009b; hereafter CBG09b), suggesting that the Al-production is regulated by the cluster’s metallicity. Moreover, an Al-Na correlation, which is typically found in more metal-poor GCs such as M13 and M3 (e.g. Cavallo and Nagar 2000), is absent in the more metal-rich populations of Omega Cen (Johnson & Pilachowski 2010) and 47 Tuc (Cordero et al. 2014).
Multiple lines of spectroscopic evidence support the multiple populations scenario in M71. Cohen (1999) reported an anticorrelation between CN and CH, which trace N and C, respectively, and a bimodal CN distribution for a sample of MS stars. Moreover, Briley et al. (2001) found that red giant branch (RGB) stars exhibit the same scatter in C and N and CN bimodality as MS stars, which lead the authors conclude that these chemical inhomogeneities detected in M71 were imprinted at birth and that variations due to deep mixing during the first dredge-up are less important at this metallicity. Another piece of evidence revealing that deep internal mixing in more metal-rich GCs plays a minor role, if any, in shaping the light-element abundances pattern described by red giants comes from the study of Briley et al. (2001), which used DDO photometry of M71 giants to trace CN and CH band strengths. Their study demonstrated that the scatter in C and N exhibited by less evolved giants is comparable to the one found in the more luminous giants. The missing dependence of this chemical feature with luminosity is also found in 47 Tuc giants, a GC with similar metallicity, as shown in Fig. 3 from Briley et al. (2001) using results from Norris & Freeman (1979) and Briley (1997).
Regarding the characterization of other light elements involved in proton-capture reactions, Ramírez & Cohen (2002) reported Na and O abundances for a sample of 25 stars in M71 covering a large luminosity range, finding that the Na-O anticorrelation extends down to the main-sequence turn-off. This result demonstrated that the origin of the Na-O anticorrelation in M71 is linked to a self-pollution scenario, since less evolved stars do not have temperatures high enough to activate the ON and NeNa cycles. Moreover, from a sample of nine stars, Meléndez & Cohen (2009; hereafter MC09) found two groups in M71, one resembling the light element abundances found in halo field stars at that metallicity and a second population of O-depleted, Na/Al enhanced stars with higher 26Mg/Mg ratios consistent with AGB pollution. Furthermore, previous chemical studies of M71 indicate that the cluster exhibits a more narrow range in [O/Fe] than do more metal-poor clusters and to date extreme O-depleted stars ([O/Fe]) have not been found in this cluster (Sneden et al. 1994; Ramírez & Cohen 2002; MC09; and Carretta et al. 2009a, hereafter CBG09a).
In order to gather more information in the more metal-rich regime of Galactic GCs we determined O, Na, and Al abundances in 47 Tuc (Cordero et al. 2014). In the present work, we extend the study of light-element abundances to another old and metal-rich GC, M71, with the goals of: i) increasing the small dataset of abundances available for this cluster; ii) assessing the degree of Al enhancement and its dispersion within the cluster; and iii) exploring whether an Na-Al correlation is present in M71. Furthermore, the total mass and metallicity of GCs are often correlated with their horizonal branch morphology as well as light element chemistry (Carretta et al. 2010), and since M71 and 47 Tuc have similar [Fe/H] but differ significantly in their present-day mass, a comparison between the two clusters may provide insight into possible differences in their formation mechanisms. The paper is organized as follows. A description of the observations, the analysis, and a comparison to the literature are presented in sections 2 through 4. A discussion of our results and our conclusions are given in sections 5 and 6, respectively.
II Observations and Data Reduction
II.1 Observations
We observed red giant branch stars in the GC M71 using the Hydra multi-fiber positioner and bench spectrograph on the WIYN telescope located at Kitt Peak National Observatory in June 2000, June 2013, and July 2013. Different fiber configurations were used during each run because only 13-17 stars can be observed on a given setup due to the small angular diameter of the cluster and the fiber size/placement tolerances. The remaining fibers in each configuration were used to measure the background sky spectra. Table 1 shows the dates of observations and wavelength coverage of each Hydra configuration. For all Hydra runs the spectrograph was fed with the 200 m “red” fiber cable and the Bench Spectrograph Red Camera was used. The 2001 observations employed the 316 l/mm (63.4∘) echelle grating, the former SITE 2048 2048 pixel CCD (t2kc), and the filter X19 which yielded spectra ranging from 6470-6860 Å, at a dispersion of 0.20 Å pixel-1. The 2013 observations used the 316 l/mm (63.4∘) echelle grating, the SITE 2600 4000 pixel CCD (STA1), and the filter X18 which covered the spectral range from 6100-6350 Å, at a dispersion of 0.16 Å pixel-1.
II.2 Selection of Stars
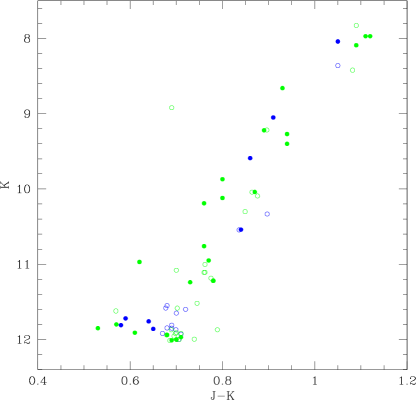
Coordinates and membership probabilities were obtained from the proper motion survey of Cudworth (1985). We targeted only stars with membership probabilities greater than 80%, and note that only seven stars in our sample have membership probability below 90%. Furthermore, to confirm membership radial velocities were measured using the IRAF task fxcor which cross-correlates the observed spectra with synthetic spectra of similar atmospheric parameters and resolution. This procedure resulted in an average heliocentric velocity of -22.5 km s-1 with =2.6 km s-1 and typical uncertainties of 0.4 km s-1, in agreement with previous studies (i.e., Peterson & Latham 1986, Cohen et al. 2001). The stars included in this study range in magnitude from 12.1 V 14.9, from near the RGB-tip to slightly below the HB. The final sample includes spectra for 25 stars from the 2001 observations, and 33 stars from the 2013 observations, with 25 stars observed in both wavelength regions. Stellar identifications and V magnitudes were taken from Cudworth (1985) and near-infrared photometry (J and KS) was taken from the 2MASS Point Source Catalog (Skrutskie et al. 2006). A KS vs J-KS color-magnitude diagram of stars observed in M71 is shown in Fig. 1, including all our Hydra sample and the sample from CBG09b.
II.3 Data Reduction
Calibration data for both Hydra runs included ThAr comparison lamp, bias, and flat field frames on all nights. Furthermore, a set of dark frames was taken on the 2013 observing run. Basic data reductions were carried out using IRAF444IRAF is distributed by the National Optical Astronomy Observatories, which are operated by the Association of Universities for Research in Astronomy, Inc., under cooperative agreement with the National Science Foundation.” routines. The ccdproc task was used to trim the overscan region and to subtract the bias and dark levels. The dohydra script was used to trace the spectra, to apply a flat-field correction, to correct for scattered light, to extract the one-dimensional spectra, to apply the wavelength calibration, and to subtract the background sky spectra. The continuum for each spectrum was normalized using a low order cubic spline. Standard stars for removing telluric absorption features near the [O I] line at 6300 were not obtained as part of the original data set, limiting the determination of an oxygen abundance to just a subset of our stars. Weak telluric features are present in our spectra and are blended with the oxygen line. However, we were able to convolve the high resolution telluric spectrum provided with the Arcturus Atlas (ftp://ftp.noao.edu/catalogs/arcturusatla/visual/) to match the resolution of our data and successfully divide out the weak telluric absorption lines in our spectra. With the telluric lines removed, we were able to determine oxygen abundances for 22 giants in our sample. Finally, the spectra were co-added using the scombine task after applying the appropriate wavelength shift. The final spectra have signal-to-noise ratios of typically 70-200 per pixel.
III Abundance Analysis and Uncertainties
III.1 Derivation of Abundances
Chemical abundances of M71 giants were determined using the 2010 version of the code MOOG (Sneden 1973). LTE model stellar atmospheres were interpolated, with an adopted metallicity of [M/H]=–0.80555We use the standard spectroscopic notation where [A/B]log(NA/NB)star–log(NA/NB)⊙ and log (A)log(NA/NH)+12.0 for elements A and B., from the -enhanced ATLAS9 grid of non-overshoot models (Castelli & Kurucz 2003).
Initial effective temperatures () were obtained from the infrared flux method using the analytic functions presented in Alonso et al. (1999) and the color transformations summarized in Johnson et al. (2005). We used the reddening value E(B-V)=0.25 recommended by Harris (1996; 2010 edition). We derived surface gravities from the absolute bolometric magnitudes and effective temperatures. We used the bolometric corrections described in Alonso et al. (1999), a distance modulus of (m-M)V = 13.80 (Harris 1996, 2010 edition), a bolometric magnitude of 4.74 for the Sun , and a mass of 0.8 was assumed for all the stars. The limited spectral coverage prevents derivation of the surface gravities from the ionization equilibrium of Fe I and Fe II. An initial microturbulence value was obtained using the vt relation given by Johnson et al. (2008), and then adjusted to minimize the dependence of derived [Fe/H] on reduced equivalent width (). The final adopted atmospheric parameters are given in Table 2, which also includes, abundances, reference population assignment, distance from the cluster center in arcmin, and heliocentric radial velocities obtained in the present work, in addition to stellar identifications and membership probabilities from Cudworth (1985).
Iron abundances were obtained from equivalent width measurements and the line list from Johnson & Pilachowski (2010). The IRAF splot package was used to measure equivalent widths interactively and only lines with log W/ –4.5 were used for the abundance analysis. We used typically about 27 Fe I lines. Solar reference abundances used in this study can be found in Johnson & Pilachowski (2010).
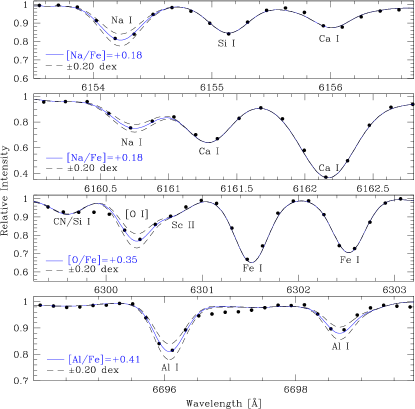
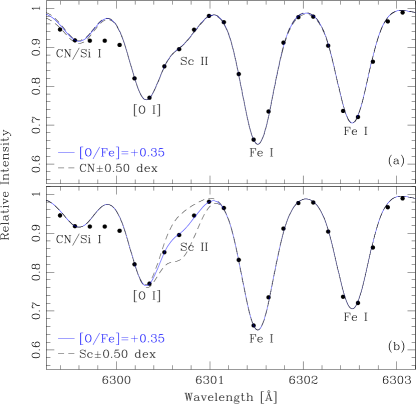
Abundances of the light-elements oxygen ([O I] 6300 Å), sodium (Na I 6154, 6160 Å doublet), and aluminum ( 6696, 6698 Å Al doublet) were determined by spectrum synthesis, which provides a more reliable abundance at Hydra’s resolution due to blending with other atomic and molecular features. For instance, to obtain a good fit to the [O I] 6300 Å line profile the Sc abundance must be adjusted as shown in Fig. 3. Typically, a [Sc/Fe] ranging from 0.05 to 0.15 resulted in a well fit line profile, which is consistent with published Sc values published by Ramirex & Cohen (2002) (-0.39 to 0.29). Furthermore, the [O I] 6300 Å line is blended with Ni. The Na 6160 Å feature is blended with Ca and the Al 6696, 6698 Å doublet is blended with Fe and CN. The synthesis line lists used in this study were the same as those used in Johnson & Pilachowski (2012). The synthetic spectra were convolved with a Gaussian smoothing kernel to match the resolution of unblended lines. An example of synthesis around each spectral feature is presented in Fig. 2.
Given the uncertain nature of Na NLTE corrections, we do not include such corrections here. However, departures from LTE decrease with increasing metallicity and are expected to be 0.1 dex for M71 red giants (Lind et al. 2011).
III.2 Uncertainties
Photometric temperatures based on the empirical relations for V-KS and B-V colors extracted from Alonso et al. (1999) have a 1 value ranging from 20-96K. Additionally, we find in a comparison of our derived values with those of CBG09b and MC09 average differences of 80K and 37 K, respectively. Therefore, we adopt 100 K as a conservative level of uncertainty in the derived for each star. Similarly, comparing our surface gravities we found a 1-scatter of 0.06 and 0.20 dex with these previous studies, and adopted the highest value as a reasonable uncertainty in our log g values. Changes in microturbulence velocities of up to 0.10 km s-1 resulted in a lack of trend of the Fe abundance with respect to the line strength or reduced equivalent width. However, we find a 1-scatter of 0.13 and 0.17 km s-1 with the studies mentioned above; to be on the conservative side we adopted an uncertainty of 0.2 km s-1 in our microturbulence values. An assessment of the abundance ratios sensitivity to the uncertainties in the atmospheric parameters is performed by generating a grid of atmospheres while changing one parameter a time by its uncertainty. Then each abundance change introduced by varying the atmospheric parameters is added in quadrature in addition to the line-to-line dispersion to estimate the total uncertainty in the abundance. We found that the abundances of each pair of features for Na and Al agree within 0.10 dex or less, which translates into a line-to-line dispersion 0.07. In the case of oxygen where we only have a single line, we adopted a measurement uncertainty of 0.07 dex. To estimate the uncertainties introduced by spectrum synthesis, we applied small changes in the continuum placement, smoothing factor, and the abundance values while still obtaining a reasonable fit to the observed spectra. These procedure yielded an uncertainty 0.05 dex depending on the S/N ratio of the observed spectrum. We used this value to estimate the total error for Na and Al when the line-to-line dispersion was smaller. Table 3 shows derived uncertainties for two stars with different atmospheric parameters. We find that each element has typical uncertainties ranging from 0.10-0.15 dex.
IV Results
The Fe abundances in our sample of 33 stars cover a range of 0.10 dex, consistent with typical systematic uncertainties (0.12 dex). We find an average value of [Fe/H]=–0.82 and a standard deviation of 0.03. Thus, the M71 metallicity is remarkably similar to that of 47 Tuc (e.g. [Fe/H]=–0.79 from Cordero et al. 2014). Moreover, our Fe abundances agree well with previous studies: [Fe/H]=–0.79 (Sneden et al. 1994), [Fe/H]=–0.80 (Boesgaard et al. 2005), [Fe/H]=–0.79 (MC09), and [Fe/H]=–0.81 (CBG09a). Our derived abundances as a function of effective temperatures are presented in Fig. 4.
Oxygen abundances were measured for 22 stars after removing telluric contamination affecting the profile of the [O I] 6300 Å line. We found an average [O/Fe]=0.4 dex (=0.13), covering a short range (0.4 dex). Sneden et al. (1994) analyzed the spectra of ten giants, finding a very narrow range for O (0.2 dex), with [O/Fe] ratios above solar for all the stars, and an average [O/Fe]0.3 dex. MC09 and CBG09a also reported a small range in their O abundances (0.3-0.4 dex), supersolar [O/Fe] ratios, and a slightly higher average [O/Fe]0.4 dex compared to Sneden, in a sample of 9 and 31 RGB stars, respectively. A lack of extreme O-depleted stars in M71 is consistent with the correlation between the total mass of GCs and the extention of their Na-O (CBG09a).
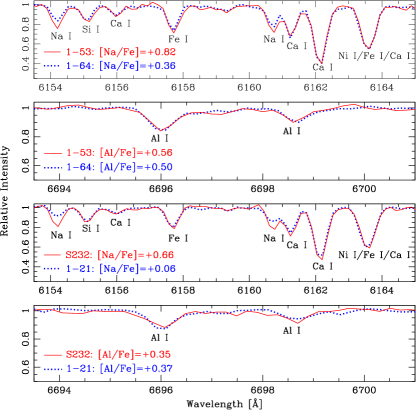
Na abundances exhibit the largest star-to-star variations in our sample of 33 stars, exhibiting a broad range of values (0.9 dex), and an average [Na/Fe]=0.34 dex (=0.20). We compared our Na measurements with the results of CBG09a uncorrected for NLTE effects and found no systematic offset using a common subsample of seven stars. Large differences in Na content are also found in pairs of stars that have similar atmospheric parameters, as shown in Fig. 5, which provides direct evidence of star-to-star Na variations.
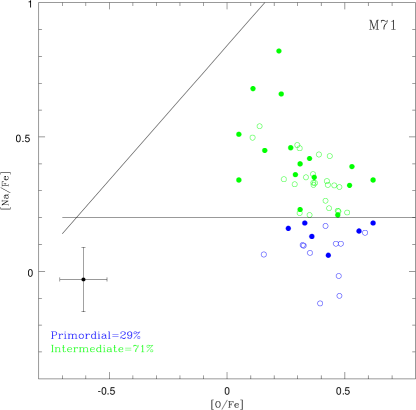
To separate our sample into primordial and intermediate populations we adopted the criteria used by CBG09a. After removing the NLTE correction used by CBG09a, the primordial population is defined as those stars with [Na/Fe]+0.20 dex, consistent with the abundance ratios of field stars with similar metallicity. We have seven stars in common with the sample presented by CBG09a, which were used to compare the atmospheric parameters and abundances. The average differences in the sense us minus CBG09a are K ( K), cgs ( cgs), km s-1 ( km s-1), dex ( dex)), dex ( dex, based on three stars), ([Na/Fe])=0.00 dex ( dex, based on seven stars after removing their NLTE correction). Our atmospheric parameters agree with CBG09a’s and the standard deviations are consistent with their typical uncertainties. No systematic offset in [Na/Fe] is needed to place CBG09a’s sample onto our baseline and we decided not to shift the oxygen abundances, since only three stars can be used as a reference.
Al abundances were determined for 25 stars in our sample and cover a range of 0.35 dex. We found an average [Al/Fe]=0.39 (=0.11) which is remarkably similar to 47 Tuc (Cordero et al. 2014). Published Al abundances for M71 are scarce. We compare our results with MC09 and CBG09b which used samples of 9 and 11 stars, respectively. From a common subsample of five stars with CBG09b we found an offset of –0.15 dex in the [Al/Fe] ratio (ours minus theirs), while an offset of +0.18 dex was found with respect to the study of MC09 from a common subsample of seven stars. The bulk part of CBG09b’s higher [Al/Fe] ratios can be explained by their different reference solar abundance, which increases the Al-to-Fe ratios by 0.22 dex. Moreover, the average differences in atmospheric parameters between us and CBG09b for the five stars in common are K ( K), cgs ( cgs), km s-1 ( km s-1), dex ( dex). Thus, we find that differences in the atmospheric parameters between CBG09b and our analysis can account for a change in the [Al/Fe] ratio of no more than 0.1 dex. The average difference with respect to MC09 for the seven stars in common are K ( K), cgs ( cgs), km s-1 ( km s-1), dex ( dex). Thus, their lower [Al/Fe] ratios can be explained, at least to the 0.1 dex level, by their lower temperatures. Unfortunately, the solar reference scale of MC09 is not available to assess whether it creates an offset with our results.
V Discussion
V.1 Na-O Anticorrelation and Radial Distributions
Determining the extent of the Na-O anticorrelation to low oxygen abundance is of particular interest for understanding how GCs form. The distribution of Na and O abundances for our sample follows the same distribution on the Na-O plane as CBG09a’s sample. For this combined sample of 75 stars we find that the second generation comprises 71 of the stars in M71, consistent with the range of values obtained by CBG09a from a homogenous sample of 1500 stars selected from 19 GCs ( 50-70). Both samples lack extreme oxygen-depleted stars, as shown in Fig. 6. The absence of stars with [O/Fe]-0.5 dex in M71 may be explained by the higher [O/Fe] yields of intermediate and massive stars at [Fe/H]-1 (e.g., Ventura & D’Antona 2009).Thus, the less extreme O-depletion detected in M71 could be linked to a lower efficiency of ON cycle reactions for polluters in this metallicity regime. Moreover, the distribution of stars on the Na-O plane is significantly less extended in oxygen for M71 compared to 47 Tuc (e.g. CBG09a, Cordero et al. 2014). Since M71 and 47 Tuc have similar metallicities, one might consider that the same type of polluters are responsible for the chemical signatures imprinted in the Na-rich/O-poor stars of these two clusters. Carretta et al. (2010) noticed that less massive and/or more metal-rich GCs span a shorter range in oxygen abundance and less extended HB. Therefore, the lack of an extremely O-depleted population can be a consequence of M71’s lower total mass. However, one of the lessons learned from the CBG09a survey is that extreme O-depleted stars are scarce. Therefore, the samples considered so far could be too sparse to reveal the extention of the Na-O anticorrelation in M71. In any case, larger samples of oxygen abundances are needed to effectively probe the tails of the O distribution in M71.
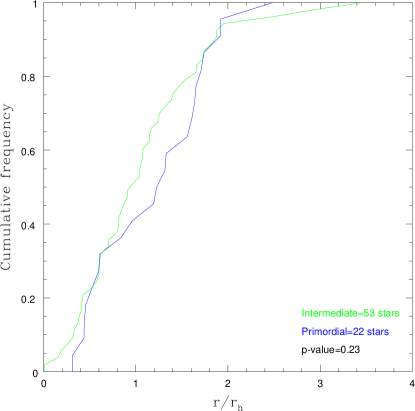
Both spectroscopic (Cordero et al. 2014) and photometric (Milone et al. 2012, Richer et al. 2013) studies have shown that 47 Tuc’s intermediate population is more centrally concentrated than its primordial population. According to the Kolmogorov-Smirnov statistical test (p-value=0.23) (10), the spatial distributions of the two populations found in M71 in this study are not statistically different. Future photometric studies of larger samples using UV filters sensitive to CN variations might clarify whether there is indeed no radial variation in the fraction of M71 intermediate population stars or the two populations are characterized by a weak radial gradient that is not detectable with the number of stars in our sample. In any case, our study (Fig. 10) suggests that the two populations in M71 are more spatially mixed than those of 47 Tuc. A possible clue as to why 47 Tuc and M71 exhibit different degrees of radial population mixing may be found in a comparison of the clusters’ dynamical ages, defined as the ratio of the cluster age to its half-mass relaxation time. Assuming the clusters have similar ages (e.g. 12 Gyr), the dynamical age of 47 Tuc is about while that of M71 (where we have used the values of from the Harris catalogue (2010). Considering the difference in dynamical age, the fact that M71 populations are more mixed than those of 47 Tuc is qualitatively consistent with the results of the simulations of the long-term dynamical evolution of multiple-population clusters of Vesperini et al. (2013). The simulations of Vesperini et al. (2013) also suggest a connection between the level of spatial mixing and the amount of mass lost due to two-body relaxation: clusters which have lost a larger fraction of their mass are expected to be more spatially mixed.
The extreme flattening of the stellar mass function reported by De Marchi et al. (2007) for M71 suggests that this cluster should indeed have suffered a significant mass loss due to two-body relaxation. Carretta et al. (2010) also suggested, on the basis of an excess of X-ray sources (Elsner et al. 2008), that M71 might have lost a significant fraction of its mass. Finally, we also point out that according to Dinescu et al. (1999) M71’s orbit is confined within 6.7 kpc from the Galactic center and the stronger tidal field of the inner Galactic regions can enhance the cluster’s mass loss rate (see e.g. Vesperini & Heggie 1997, Baumgardt & Makino 2003).
V.2 The Aluminum Abundance in M71
New insight on the nature of the polluters responsible for the star-to-star variations found within Galactic GCs can be obtained from Al, whose production through the proton-capture Mg-Al cycle requires higher temperatures (70MK) than that needed to produce Na at the expenses of Ne, due to their higher Coulomb barriers (e.g. Langer et al. 1997, Prantzos et al. 2007). Unfortunately, studies of Al in M71 have been limited to samples of 9-11 stars (Ramírez and Cohen 2002, MC09, CBG09b). These studies have found average [Al/Fe] abundance ratios ranging from +0.25 to +0.49, and a small scatter in Al (0.05-0.20 dex). As noticed by O’Connell et al. (2011) and references therein, more metal-poor GCs tend to show larger scatter in Al. Interestingly, the same trend described by Galactic GCs is also found in the massive GC Omega Cen, with past studies finding a decrease in the range of observed [Al/Fe] ratios with increasing metallicity. For instance, an [Al/Fe] ratio as high as +1.4 dex is found in the more metal-poor stars of the cluster, whereas the more metal-rich population, with a metallicity comparable to M71, only reaches [Al/Fe]+0.6 dex. These observational trends are consistent with the predicted Al-yields of intermediate mass (4-8 ) AGB stars (e.g. Ventura & D’Antona 2009, Karakas 2010), whose models indicate that a lower Al enhancement is produced by more metal-rich AGBs due to the lower temperatures in their convective envelopes and fewer dredge-up episodes. In particular, the [Al/Fe] ratios predicted for AGB and Super AGB stars with metallicity comparable to M71 and M4, range from 0.3-0.5 dex (Ventura et al. 2014).
We find a median [Al/Fe]=+0.37 dex (standard deviation 0.11) for 25 stars, consistent with the predictions from Ventura et al. (2014). Using the same Al doublet, line list, and procedure, we found that 47 Tuc has a median [Al/Fe]=+0.38 dex (standard deviation 0.12) (Cordero et al. 2014). Despite the present-day mass of M71 being significantly smaller than 47 Tuc’s, which is inferred from their absolute magnitudes used as proxies of their total mass (Mv=-5.61 and -9.42, respectively, from Harris 1996), the clusters exhibit a similar median [Al/Fe] ratio. This suggests that the metallicity of the polluters is responsible for the mild Al production and modest scatter (interquartile range) detected in these two more metal-rich clusters.
To assess what factors are important in Al production in Galactic GCs, CBG09b have shown that a linear combination of a cluster luminosity and metallicity correlates with the Al production (their Fig. 13). Interestingly, M71 does not follow the trend outlined by the other clusters of their survey. In addition to Al, M71 and 47 Tuc also show similar behavior in the light elements C and N. As shown by Briley et al. (2001), the range and distribution of CN and CH are identical in these two clusters, despite their different mass, suggesting that these similarities are a consequence of the comparable metallicity of the polluters. Given the similar [Al/Fe] interquartile range and median value we have found between 47 Tuc and M71, we suggest that the Al pattern in this metallicity regime is more sensitive to the metallicity of the polluters than to cluster mass, thus breaking the metallicity-mass degeneracy for the Al pattern.
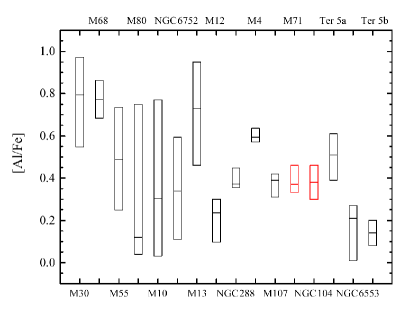
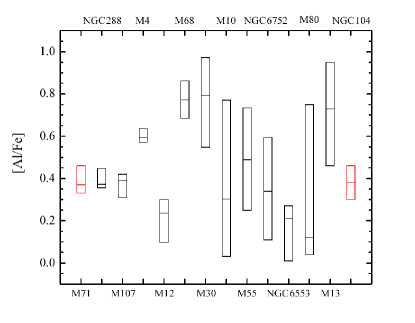
The [Al/Fe] scatter seen in M71 is consistent with other similar metallicity clusters, as shown in Fig. 7. Furthermore, we compare the interquartile range for the clusters with -1.8[Fe/H]+0.27 (from M80 to NGC 6553) presented in Fig. 7 with the results shown in Ventura et al. (2014). According to their Fig. 2, the maximum scatter in [Al/Fe] produced by AGB pollution decreases monotonically as a function of metallicity from 0.6 to 0.15 dex consistent with the results shown in our Fig. 7. Moreover, our interquartile range for M71 (0.13 dex) is consistent with their prediction of a maximum scatter of 0.25 dex in [Al/Fe] at M71’s metallicity. The star-to-star scatter in [Al/Fe] decreases around the metallicity of NCG 288 ([Fe/H]=-1.24 from CBG09a), as shown in Fig. 7. Interestingly, a histogram of GC [Fe/H] values suggests a bimodal distribution where the transition from the metal-poor to metal-rich clusters occurs at roughly the same point as the strong drop in the [Al/Fe] scatter, as seen in Fig. 6 from Muratov & Gnedin (2010). Comparing the [Al/Fe] scatter with GC mass, as shown in Fig. 8, we find that the more massive clusters exhibit a larger interquartile range for [Al/Fe] ratios. 47 Tuc seems to be the outlier exhibiting a smaller interquartile range within the more massive clusters, which is probably a consequence of being a more metal-rich cluster.
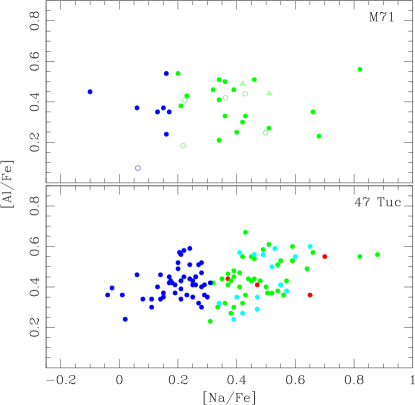
The Al-Na correlation detected in metal-poor GCs (e.g. Shetrone 1996, Ivans et al. 2001, CBG09b) is not present in the more metal-rich population of Omega Cen (e.g. Johnson & Pilachowski 2010) or in a large sample of RGB stars of 47 Tuc (Cordero et al. 2014), although see Carretta et al. (2013) for a different conclusion. In order to assess whether this trend is shared by the more metal-rich GCs, we have increased the number of published aluminum measurements in M71. No correlation of Al with Na is found for M71 giants, as shown in Fig. 9. In the same figure we added the Al abundances for five stars from CBG09b after removing a systematic offset of -0.15 found in a common subsample of six stars. Additionally, we added two stars from the sample of MC09 after correcting for a systematic offset of +0.18 based on a common subsample of seven stars. The additional Al measurements available from the literature are consistent with the distribution described by our sample.
The lack of correlation of Al with Na is verified by pairs of stars within the sample that have nearly identical atmospheric parameters but differ significantly in their Na content, while displaying identical line strength for Al, as shown in Fig. 5. This visual inspection of the spectra suggests that differences in the Al content can be subtle for stars that belong to different generations, distinguished by their Na abundance, and therefore Al is a less sensitive parameter to be used to distinguish multiple generations in this metallicity regime.
Comparing Al abundances with yields from IMAGB, FRMS, and supermassive stars might allow to identify polluting sources. Unfortunately, extensive predictions of [Al/Fe] yields from FRMS or supermassive stars are not yet available.
VI Summary
The characterization of the Al content of M71 has stimulated the present work, since this element can provide observational constraints to improve our understanding of the nature of the polluters in metal-rich GCs.
We summarize our results as the following.
1. The Fe content in our sample of 33 stars is homogeneous (standard deviation of 0.03) while star-to-star variations exceeding typical uncertainties were detected for O, Na, and Al.
2. We find that M71’s stellar populations are more spatially mixed than the populations of 47 Tuc. Although this result is based on a small sample of stars and additional studies of this issue are desirable, the difference between the level of spatial mixing in 47 Tuc and M71 is consistent with the predictions of numerical studies of multiple-population spatial mixing (Vesperini et al. 2013).
3. Compared to more metal-poor GCs, M71 and 47 Tuc have a smaller median [Al/Fe], consistent with model predictions for AGB stars in this metallicity regime. The fact that these two clusters have different total mass but the same metallicity suggests that the metallicity of the polluters is responsible for a smaller median [Al/Fe] and interquartile range compared to metal-poor GCs.
4. The scatter in [Al/Fe] detected in M71 follows the trend described by more metal-rich clusters. We have studied the variation in the [Al/Fe] scatter as a function of the cluster metallicity and found that an abrupt change in the [Al/Fe] scatter occurs at around the same metallicity marking the transition between metal-poor and metal-rich GCs (e.g. Muratov & Gnedin 2010).
5. Similarly to what found in other metal-rich clusters, no Na-Al correlation is found in M71 (Johnson & Pilachowski 2010; Cordero et al. 2014).
Acknowledgements.
We would like to thank Karen Butler, Jena Christensen, Charles Corson, Dianne Harmer, Jennifer Power, Heidi Schweiker, David Summers, and Daryl Willmarth for their assistance in the data acquisition. This research has made use of the NASA Astrophysics Data System Bibliographic Services. This publication makes use of data products from the Two Micron All Sky Survey, which is a joint project of the University of Massachusetts and the Infrared Processing and Analysis Center/California Institute of Technology, funded by the National Aeronautics and Space Administration and the National Science Foundation. This work was supported by Sonderforschungsbereich SFB 881 “The Milky Way System” (subprojects A4 and A5) of the German Research Foundation (DFG). CAP acknowledges the generosity of the Kirkwood Research Fund at Indiana University. CIJ gratefully acknowledges support from the Clay Fellowship, administered by the Smithsonian Astrophysical Observatory. Enrico Vesperini acknowledges supports from grant NASA-NNX13AF45G. We thank the anonymous referee for her/his suggestions in improving this paper.References
- Alonso et al. (1999) Alonso, A., Arribas, S., & Martinez Roger, C. 1999, A&AS, 140, 261 (erratum A&A, 376, 1039 [2001])
- Baumgardt et al. (2003) Baumgardt, H. & Makino, J. 2003 MNRAS, 340, 227
- Bedin et al. (2000) Bedin, L. R., Piotto, G., Zoccali, M., Stetson, P. B., Saviane, I., Cassisi, S., Bono, G. 2000, A&A, 363, 159
- Bedin et al. (2004) Bedin, L. R., Piotto, G., Anderson, J., Cassisi, S., King, I. R., Momany, Y., Carraro, G. 2004, Astrophys. J. , 605, 125
- Bellazzini et al. (2008) Bellazzini, M., Ibata, R. A. Chapman, S. C. Mackey, A. D. Monaco, L. Irwin, M. J. Martin, N. F. Lewis, G. F. Dalessandro, E. 2008, AJ, 136, 1147
- Boesgaard et al. (2005) Boesgaard, A. M., King, J. R., Cody, A. M., Stephens, A.,& Deliyannis, C. P. 2005, Astrophys. J. , 629, 832
- Briley (1997) Briley, M. M. 1997, AJ, 114, 1051
- Briley et al. (2001) Briley, M. M., Smith, G. H., & Claver, C. F. 2001, AJ, 122, 2561
- Carretta et al. (2009a) Carretta, E., Bragaglia, A. Gratton, R. G., and Lucatello, S. 2009a, A&A, 505, 139
- Carretta et al. (2009b) Carretta, E., Bragaglia, A., Gratton, R. G., Lucatello, S., Catanzaro, G., Leone, F., Bellazzini, M., Claudi, R., D’Orazi, V., Momany, Y., Ortolani, S., Pancino, E., Piotto, G., Recio-Blanco, A., Sabbi, E. 2009b, A&A, 505, 117
- Carretta et al. (2010) Carretta, E., Bragaglia, A. Gratton, R. G., Recio-Blanco, A., Lucatello, S, D’Orazi, V., and Cassisi, S. 2010, A&A, 516, 55
- Carretta et al. (2013) Carretta, E. Gratton, R. G., Bragaglia, A.; D’Orazi, V., & Lucatello, S. 2013, A&A, 550, 34
- Castelli & Kurucz (2003) Castelli, F. & Kurucz, R. L. 2003, Modelling of Stellar Atmospheres (IAU Symp. 210), ed. N. E. Piskunov, W. W. Weiss, & D. F. Gray (San Francisco, CA: ASP), 20
- Cavallo & Nagar (2000) Cavallo R. M. & Nagar N. M. 2000, AJ, 120, 1364
- Cavallo et al. (2004) Cavallo, R. M., Suntzeff, N. B., & Pilachowski, C. A. 2004, AJ, 127, 3411
- Charbonnel et al. (2013) Charbonnel, C., Chantereau, W., Decressin, T., Meynet, G., & Schaerer, D. 2013, A&A, 557, L17
- Cohen (1999) Cohen, J. G. 1999, AJ, 117, 2434
- Cohen et al. (2001) Cohen, J. G., Behr, B. B., & Briley, M. M. 2001, AJ, 122, 1420
- Cohen & Meléndez (2005) Cohen, J. G. & Meléndez, J. 2005, AJ, 129, 303
- Cordero et al. (2014) Cordero, M. J., Pilachowski, C. A. , Johnson, C. I., McDonald, I., Zijlstra, A. A., & Simmerer, J. 2014, Astrophys. J. , 780, 94
- Cudworth (1985) Cudworth, K. M. 1985, AJ, 90, 65
- D’Antona et al. (2012) D’Antona, F., D’Ercole, A., Carini, R., Vesperini, E., & Ventura, P. 2012, MNRAS, 426, 1710
- Decressin et al. (2007) Decressin, T., Meynet, G., Charbonnel, C., Prantzos, N., & Ekstr m, S. 2007, A&A, 464, 1029
- Decressin et al. (2010) Decressin, T., Baumgardt, H., Charbonnel, C., & Kroupa, P. 2010, A&A, 516, A73
- De Marchi et al. (2007) De Marchi, G., Paresce, F., & Pulone, L. 2007, Astrophys. J. , 656, 65
- de Mink et al. (2009) de Mink, S. E., Pols, O. R., Langer, N., & Izzard, R. G. 2009, A&A, 507, 1
- D’Ercole et al. (2008) D’Ercole, A, Vesperini, E, D’Antona, F, McMillan, S. L. W.; & Recchi, S. 2008, MNRAS, 391, 825
- Denissenkov & Hartwick (2014) Denissenkov, P. A., Hartwick, F. D. A. 2014, MNRAS, 437, 21
- Dinescu et al. (1999) Dinescu, D. I., Girard, T. M., van Altena, W. F. 1999, AJ, 117, 1792
- Elsner et al. (2008) Elsner, R. F., Heinke, C. O., Cohn, H. N., Lugger, P. M., Maxwell, J. E., Stairs, I. H., Ransom, S. M., Hessels, J. W. T., Becker, W., Huang, R. H. H., Edmonds, P. D., Grindlay, J. E., Bogdanov, S., Ghosh, K., & Weisskopf, M. C., 2008, Astrophys. J. , 687, 1019
- Gratton et al. (2004) Gratton, R., Sneden, C., & Carretta, E. 2004, ARA&A, 42, 385
- Gratton et al. (2012) Gratton, R. G., Carretta, E., and Bragaglia, A. 2012, A&Arv, 20, 50
- Ivans et al. (2001) Ivans, I. I., Kraft, R. P., Sneden, C., Smith, G. H., Rich, R. M., & Shetrone, M. 2001, AJ, 122, 1438
- Kraft et al. (1997) Kraft, R.P., Sneden, C., Smith, G.H., Shetrone, M.D., Langer, G.E. & Pilachowski, C.A. 1997, AJ, 113, 279
- Han et al. (2009) Han, S., Lee, Y., Joo, S., Sohn, S. T., Yoon, S., Kim, H., Lee, J. 2009, Astrophys. J. , 707, 190
- Harris (1996) Harris, W. E. 1996, AJ, 112, 1487
- Johnson & Pilachowski (2010) Johnson, C. I. & Pilachowski, C. A. 2010, Astrophys. J. , 722, 1373
- Johnson & Pilachowski (2012) Johnson, C. I. & Pilachowski, C. A. 2012, Astrophys. J. , 754, 38
- Johnson et al. (2005) Johnson, C. I., Kraft, R. P., Pilachowski, C. A., Sneden, C., Ivans, I. I., & Benman, G. 2005, PASP, 117, 1308
- Johnson et al. (2008) Johnson, C. I., Pilachowski, C. A., Simmerer, J., & Schwenk, D. 2008, Astrophys. J. , 681, 1505
- Johnson et al. (2009) Johnson, C. I., Pilachowski, C. A., Rich, R. M., & Fulbright, J. P. 2009, Astrophys. J. , 698, 2048
- Karakas (2010) Karakas, A. I. 2010, MNRAS, 403, 1413
- Langer et al. (1997) Langer, G. F., Hoffman, R. D., and Zaidins, C. S. 1997, PASP, 109, 244L
- Lind et al. (2011) Lind, K.; Asplund, M.; Barklem, P. S.; & Belyaev, A. K. 2011, A&A, 528, 103
- Meléndez & Cohen (2009) Meléndez, J., Cohen, J. G. 2009, Astrophys. J. , 699, 2017
- Milone et al. (2008) Milone, A. P., Bedin, L. R., Piotto, G., Anderson, J., King, I. R., Sarajedini, A., Dotter, A., Chaboyer, B., MarFranch, A., Majewski, S., Aparicio, A., Hempel, M., Paust, N. E. Q., Reid, I. N., Rosenberg, A., Siegel, M. 2008, Astrophys. J. , 673, 241
- Milone et al. (2010) Milone, A. P., Piotto, G., King, I. R., Bedin, L. R., Anderson, J., Marino, A. F., Momany, Y., Malavolta, L., Villanova, S. 2010, Astrophys. J. , 709, 1183
- Milone et al. (2012) Milone, A. P., Marino, A. F., Cassisi, S., Piotto, G.; Bedin, L. R., Anderson, J., Allard, F., Aparicio, A., Bellini, A., Buonanno, R., Monelli, M., & Pietrinferni, A. 2012, Astrophys. J. , 745, 27
- Muratov & Gnedin (2010) Muratov, A. L. & Gnedin, O. Y. 2010, Astrophys. J. , 718, 1266
- O’Connell et al. (2011) O’Connell, J. E., Johnson, C. I., Pilachowski, C. A., & Burks, G. 2011, PASP, 123, 1139
- Origlia et al. (2011) Origlia, L., Rich, R. M., Ferraro, F. R., Lanzoni, B., Bellazzini, M., Dalessandro E., Mucciarelli, A., Valenti, E., & Beccari, G. 2011, Astrophys. J. , 726, 20
- Peterson & Latham (1986) Peterson, R. C. & Latham, D. W. 1986, Astrophys. J. , 305, 645
- Piotto et al. (2007) Piotto, G., Bedin, R. R., Anderson, J., King, I. R., Cassisi S., Milone, A. P., Villanova S., Pietrinferni A., & Renzini A. 2007, ApJL, 661, L53
- Piotto et al. (2014) Piotto, G., et al. 2014, AJ, in press (arxiv:1410.4564)
- Prantzos et al. (2007) Prantzos, N., Charbonnel, C., Iliadis, C., et al. 2007, A&A, 470, 179
- Ramírez & Cohen (2002) Ramírez, S. & Cohen, J. G. 2002, AJ, 123, 3277
- Richer et al. (2013) Richer, H. B.; Heyl, J.; Anderson, J.; Kalirai, J. S.; Shara, M. M.; Dotter, A.; Fahlman, G. G.; Rich, R. M. 2013, Astrophys. J. , 771, 15
- Shetrone (1996) Shetrone, M. D. 1996, AJ, 112, 1517
- Sneden (1973) Sneden, C. 1973, Astrophys. J. , 184, 839
- Sneden et al. (1994) Sneden, C., Kraft, R. P., Langer, G. E., Prosser, C. F., & Shetrone, M. D. 1994, AJ, 107, 1773
- Sneden et al. (2004) Sneden, C., Kraft, R. P., Guhathakurta, P., Peterson, R. C., & Fulbright, J. P. 2004, AJ, 127, 2162
- Sweigart & Mengel (1979) Sweigart, A. V. & Mengel, J. G. 1979, Astrophys. J. , 229, 624
- Ventura et al. (2001) Ventura, P., D’Antona, F., Mazzitelli, I., & Gratton, R. 2001, Astrophys. J. , 550, L65
- Ventura & D’Antona (2008) Ventura, P. & D’Antona, F. 2008, A&A, 479, 805
- Ventura et al. (2014) Ventura, P., Di Criscienzo, M., D’Antona, F., Vesperini, E., Tailo, M., Dell’Agli, F., & D’Ercole, A. 2014 MNRAS, 437, 3274
- Vesperini & Heggie (1997) Vesperini, E. & Heggie, D. C. 1997 MNRAS, 289, 898
- Vesperini et al. (2013) Vesperini, E., McMillan, S. L. W., D’Antona, F., & D’Ercole, A. 2013, MNRAS, 429, 1913

| UT Date | Exp. Time | Wavelength |
|---|---|---|
| (s) | () | |
| 25 May 2000 | 3600 | 6490-6800 |
| 19 June 2000 | 3600 | 6490-6800 |
| 10 July 2000 | 3600 | 6490-6800 |
| 19 July 2003 | 3600 | 6490-6800 |
| 22 June 2013 | 2700 | 6100-6400 |
| 23 June 2013 | 2700 | 6100-6400 |
| 3 July 2013 | 2700 | 6100-6400 |
| 4 July 2013 | 2700 | 6100-6400 |
| 21 July 2013 | 2700 | 6100-6400 |
| R.A. | DEC | V | K | T | r | ||||||||||
|---|---|---|---|---|---|---|---|---|---|---|---|---|---|---|---|
| Star | J2000 | J2000 | (K) | log g | [Fe/H] | (km s-1) | [O/Fe] | [Na/Fe] | [Al/Fe] | Prob | (km s-1) | Pop | (arcmin) | ||
| 1-88 | 298.4367500 | 18.7636000 | 14.26 | 11.800 | 5175 | I | |||||||||
| 1-101 | 298.4373750 | 18.7721583 | 14.39 | 11.850 | 5295 | 0.37 | I | ||||||||
| KC-118 | 298.4189167 | 18.8189389 | 14.55 | 11.906 | 5170 | I | |||||||||
| X | 298.4212917 | 18.7365472 | 14.48 | 11.814 | 5145 | 0.35 | P | ||||||||
| 1-50 | 298.4739167 | 18.8117278 | 14.53 | 11.860 | 5140 | 0.24 | P | ||||||||
| 1-33 | 298.4602083 | 18.7849833 | 14.40 | 11.724 | 5130 | 0.62 | P | ||||||||
| 1-107 | 298.4286667 | 18.7771611 | 13.70 | 10.966 | 5062 | I | |||||||||
| 1-62 | 298.4191250 | 18.8079833 | 14.56 | 11.757 | 4985 | 0.45 | P | ||||||||
| 1-75 | 298.4231667 | 18.7953722 | 14.85 | 11.940 | 4870 | I | |||||||||
| 1-3 | 298.4448333 | 18.7502389 | 14.93 | 12.014 | 4870 | 0.62 | 0.51 | I | |||||||
| 1-111 | 298.4017083 | 18.7690222 | 14.89 | 11.966 | 4850 | 0.33 | I | ||||||||
| 1-58 | 298.4383333 | 18.8107361 | 14.93 | 12.000 | 4845 | I | |||||||||
| KC-130 | 298.3927500 | 18.7820667 | 14.30 | 12.090 | 4700 | 0.26 | 0.54 | P | |||||||
| 1-14 | 298.4796250 | 18.7596417 | 13.86 | 10.763 | 4680 | 0.53 | 0.46 | I | |||||||
| 1-51 | 298.4633333 | 18.8086583 | 14.34 | 11.220 | 4660 | 0.54 | I | ||||||||
| 1-68 | 298.4335833 | 18.7863028 | 14.38 | 11.240 | 4640 | 0.47 | 0.38 | I | |||||||
| 1-1 | 298.4683333 | 18.7484556 | 14.13 | 10.950 | 4605 | 0.16 | I | ||||||||
| 1-9 | 298.4544583 | 18.7668250 | 13.43 | 10.186 | 4550 | 0.33 | I | ||||||||
| 1-95 | 298.4209583 | 18.7683194 | 13.39 | 10.120 | 4530 | 0.31 | 0.25 | I | |||||||
| 1-56 | 298.4511667 | 18.8071194 | 13.25 | 9.873 | 4445 | 0.35 | 0.3 | I | |||||||
| KC-22 | 298.4133333 | 18.7342639 | 13.97 | 10.544 | 4405 | 0.56 | 0.37 | P | |||||||
| 1-21 | 298.4480000 | 18.7714667 | 13.02 | 9.588 | 4400 | 0.43 | 0.37 | P | |||||||
| S232 | 298.4902917 | 18.7992389 | 13.56 | 10.042 | 4340 | 0.23 | 0.35 | I | |||||||
| 1-53 | 298.4609583 | 18.8188167 | 12.97 | 9.271 | 4220 | 0.22 | 0.56 | I | |||||||
| I | 298.4365833 | 18.7764722 | 12.38 | 8.663 | 4210 | 0.27 | 0.51 | I | |||||||
| 1-64 | 298.4423333 | 18.7906639 | 13.13 | 9.395 | 4195 | 0.44 | 0.5 | I | |||||||
| S | 298.4161667 | 18.7314778 | 13.01 | 9.217 | 4160 | 0.05 | 0.21 | I | |||||||
| A9 | 298.4061250 | 18.7500139 | 13.10 | 9.052 | 4025 | 0.36 | 0.35 | P | |||||||
| A4 | 298.4720000 | 18.7798278 | 12.28 | 8.040 | 3935 | 0.33 | 0.41 | P | |||||||
| 1-45 | 298.4511250 | 18.8007056 | 12.35 | 8.094 | 3930 | 0.11 | 0.23 | I | |||||||
| 1-46 | 298.4646250 | 18.8017222 | 12.34 | 7.968 | 3880 | 0.52 | 0.46 | I | |||||||
| 1-113 | 298.4406250 | 18.7986778 | 12.48 | 7.974 | 3825 | 0.31 | 0.43 | I | |||||||
| H | 298.4477917 | 18.7809472 | 12.08 | 7.449 | 3780 | 0.05 | 0.27 | I |
| Ion | [M/H]0.10 | 0.20 | No. | ||||
|---|---|---|---|---|---|---|---|
| (K) | (cgs) | (dex) | (km s-1) | lines | (dex) | (dex) | |
| 1-64 | |||||||
| Fe I | |||||||
| O | |||||||
| Na | |||||||
| Al | |||||||
| X | |||||||
| Fe I | |||||||
| Na | |||||||
| Al |