Solving the puzzle of subhalo spins
Abstract
Investigating the spin parameter distribution of subhaloes in two high resolution isolated halo simulations, recent work by Onions et al. suggested that typical subhalo spins are consistently lower than the spin distribution found for field haloes. To further examine this puzzle, we have analyzed simulations of a cosmological volume with sufficient resolution to resolve a significant subhalo population. We confirm the result of Onions et al. and show that the typical spin of a subhalo decreases with decreasing mass and increasing proximity to the host halo center. We interpret this as the growing influence of tidal stripping in removing the outer layers, and hence the higher angular momentum particles, of the subhaloes as they move within the host potential. Investigating the redshift dependence of this effect, we find that the typical subhalo spin is smaller with decreasing redshift. This indicates a temporal evolution as expected in the tidal stripping scenario.
Subject headings:
methods: numerical – galaxies: haloes– galaxies: evolution – cosmology: theory – dark matter1. Introduction
In the standard model of structure formation, the rotation velocities of disc galaxies are correlated with the spin properties of their surrounding dark matter haloes (Fall & Efstathiou, 1980). The simplest model explains this correlation via angular momentum conservation and assuming baryons and dark matter initially share the same specific angular momentum distribution (Mestel, 1963). Even though subsequent models paint a more complex picture, this link continues to exist (e.g. Dalcanton et al., 1997; Mo et al., 1998; Navarro & Steinmetz, 2000; Abadi et al., 2003; Bett et al., 2010). Consequently, the halo spin is an important parameter in many semi-analytic models of galaxy formation (Kauffmann et al., 1993, 1997; Frenk et al., 1997; Cole et al., 2000; Benson et al., 2001; Bower et al., 2006; Croton et al., 2006; De Lucia & Blaizot, 2007; Bertone et al., 2007; Font et al., 2008; Benson, 2012) and a number of studies have investigated the spin of individual dark matter haloes in cosmological simulations (Peebles, 1969; Bullock et al., 2001; Hetznecker & Burkert, 2006; Bett et al., 2007; Macciò et al., 2007; Gottlöber & Yepes, 2007; Knebe & Power, 2008; Antonuccio-Delogu et al., 2010; Wang et al., 2011; Lacerna & Padilla, 2012; Trowland et al., 2013; Bryan et al., 2013).
Due to a lack of resolution in previous generations of large cosmological simulations, subhalo spins have not been thoroughly investigated so far, despite their application within current semi-analytic models (Guo et al., 2011). Initial work by Lee & Lemson (2013) analyzed the spins of the two most massive substructures of Local Group like systems in the Millennium-II simulation (Boylan-Kolchin et al., 2009) and revealed possible consequences for the application of subhalo spins to near-field cosmology.
Onions et al. (2013) investigated the spin distribution of subhaloes in two high resolution simulations of a Milky Way-like halo (the Aquarius simulation (Springel et al., 2008) and the ghalo simulation (Stadel et al., 2009)) analyzed by a variety of subhalo finders. They suggested that subhalo spins are significantly offset to lower values than those seen in typical distribution functions fitted to haloes (Bullock et al., 2001; Bett et al., 2007). As this result is independent of the subhalo finder used, it suggests that this is a true physical effect. This could not be investigated further because their resimulation did not contain a large field halo population. Excluding subhaloes, Colín et al. (2004) found the spin parameter distribution of isolated dwarf dark matter haloes to be perfectly consistent with that of larger haloes. This suggests that the consistently lower spin of substructure is not due to the generally smaller mass of subhaloes, but is more likely related to tidal stripping of high angular momentum material. On the other hand, this offset could also be due to differences between the Aquarius and ghalo simulations and those used by Bullock to define the field relation. To answer this question we require a single simulation that simultaneously includes both a significant subhalo and field halo population.
In this work we use purpose built simulations, specifically designed to contain both a field and subhalo population, to investigate the difference in spin distribution functions between subhaloes and haloes. In Section 2, we present these simulations and the corresponding (sub-)halo catalogues. The different theoretical models of dimensionless spin parameters are described in Section 3, while our results are summarized in Section 4. We discuss our work and conclude in Section 5.
2. Simulation Data
As we require our halo and subhalo masses to span a wide dynamic range () , we have run four dark matter only comoving cosmological boxes containing particles, with linear sizes of , , , respectively (hereafter BoxA, BoxB, BoxC, BoxD). The softening lengths are chosen to be of the mean separation between particles. This set of simulations can both sufficiently resolve subhalo spins (at least 300 particles per subhalo; Bett et al., 2007) and have significant statistics for haloes (c.f. Table 1). We also ran two simulations with the same parameters as those used for the BoxA simulation except for the gravitational softening parameter. BoxA_S1 has a smaller softening length whereas BoxA_S2 has a larger softening length. We also ran a low resolution simulation containing particles and the same linear size, as BoxA which we designate BoxLo. The mass resolution of BoxA ( per particle) is very close to that of the Aquarius-A simulation at level 4 (Springel et al., 2008) which had a particle mass of in the high resolution region. This is roughly three times better mass resolution than the Millennium-II simulation () used by Lee & Lemson (2013). The cosmology was chosen to be the same as in the Aquarius simulation, i.e. CDM with . Initial conditions were generated at by the code N-GenIC using the Zel’dovich approximation (written by Volker Springel) to linearly evolve positions from an initially glass-like state. This was then evolved to the present day using gadget-2 (Springel, 2005).
All simulations except BoxLo were analyzed with the (sub-)halo finding code subfind (Springel et al., 2001), ahf (Gill et al., 2004; Knollmann & Knebe, 2009) and hbt (Han et al., 2012). BoxLo was only analyzed with subfind . A summary of our simulations is given in Table 1 and details of all the halo finding algorithms we have used and a discussion of their relative merits can be found in Knebe et al. (2013).
| Name | Box size | Particle mass | Force softening | ||||||
| BoxLo | 8 | 1.25 | 1136 | - | - | 213 | - | - | |
| BoxA_S1 | 8 | 0.04 | 6589 | 6698 | 6775 | 1934 | 2169 | 1460 | |
| BoxA | 8 | 0.63 | 6651 | 6587 | 6798 | 1651 | 1899 | 1216 | |
| BoxA_S2 | 8 | 1.25 | 6585 | 6476 | 6529 | 1388 | 1618 | 944 | |
| BoxB | 20 | 1.56 | 8923 | 8785 | 9139 | 2111 | 2494 | 1302 | |
| BoxC | 50 | 3.91 | 12791 | 12533 | 12874 | 2687 | 3325 | 1597 | |
| BoxD | 100 | 7.81 | 17562 | 17053 | 16901 | 3072 | 3949 | 1737 | |
| BoxA* | 1132 | - | - | 215 | - | - |
-
*
This higher particle number threshold is used to compare with BoxLo over the same halo mass range.
3. Theory
The dimensionless spin parameter indicates how much a collection of particles is supported by the angular momentum against gravitational collapse assuming gravitational equilibrium, where a negligible spin parameter represents minimal support, while the value for a completely supported system depends on the chosen parametrisation. There are two standard parametrisations defined by Peebles (1969) and Bullock et al. (2001), respectively, that we describe in the following two sections.
Hetznecker & Burkert (2006) showed that Bullock’s parametrisation is less dependent on redshift evolution than Peebles’ parametrisation. This is due to it being more robust to variations in the position of the structure’s outer radius and therefore not as strongly affected by the many minor mergers over a halo’s merging history. Therefore, the two descriptions are not readily interchangeable and results need to be compared using the same parameter.
3.1. Peebles Spin Parameter
Peebles (1969) proposed to parameterise the (sub-)halo spin in the following way:
| (1) |
where is total angular momentum, the energy and the mass of the (sub-)structure. With this choice a value of represents a purely rotationally supported object (Frenk & White, 2012).
Applying this parametrisation Bett et al. (2007) determined the spin distribution of haloes in the Millennium Simulation (Springel et al., 2005). The Millennium Simulation has a mass resolution of and therefore contains very few subhaloes. The vast majority of the objects in the TREEclean catalogue of Bett et al. (2007) are haloes rather than subhaloes. The probability density function of they found to fit the distribution used the following parametrisation;
| (2) |
where A is given by,
| (3) |
and is the gamma function. They found and best fit the distribution of halo spins.
3.2. Bullock Spin Parameter
Bullock et al. (2001) proposed a dimensionless spin parameter of the form:
| (4) |
where is the angular momentum within a virilized sphere with radius and mass , and is the circular velocity at the virial radius (). They also proposed a parametrisation of the probability density function based on Barnes & Efstathiou (1987),
| (5) |
They found the best fit for haloes is given by and .
4. Results
Note that in this section we will show results for the discrete, normalized derivative of the spin distribution function and , while the fitted functions are for the continuous probability density function and , respectively. For Peebles spin, we set the bin width to be . For Bullock spin, the bin width is .
4.1. Halo finding code, softening, and resolution test
In this section, we first test whether simulation data set and the specific choice of substructure finding code will affect the derived spin of (sub-)haloes. Macciò et al. (2008) has tested halo spins with different cosmological parameters. They found that the spin distributions of haloes is essentially independent of cosmology, at least for changes between WMAP1,WMAP3 and WMAP5. We choose not to confirm this result here. BoxA, BoxA_S1 and BoxA_S2 are used to compare different force resolutions. BoxA and BoxLo are used to compare different mass resolutions. To ensure reliable properties are recovered only (sub-)haloes with more than 300 particles are selected throughout this work. While calculating the spin of haloes, all their substructures are removed from them. Spin distributions are fitted by Equation 2 and Equation 5, and the fitting parameters are listed in Table 2.
| Peebles Spin | haloes | subhaloes | |||
|---|---|---|---|---|---|
| subfind | BoxA_S1 | ||||
| BoxA | |||||
| BoxA_S2 | |||||
| hbt | BoxA_S1 | ||||
| BoxA | |||||
| BoxA_S2 | |||||
| ahf | BoxA_S1 | ||||
| BoxA | |||||
| BoxA_S2 | |||||
| Bullock Spin | haloes | subhaloes | |||
| subfind | BoxA_S1 | ||||
| BoxA | |||||
| BoxA_S2 | |||||
| hbt | BoxA_S1 | ||||
| BoxA | |||||
| BoxA_S2 | |||||
| ahf | BoxA_S1 | ||||
| BoxA | |||||
| BoxA_S2 | |||||
As Table 2 shows, the recovered spin properties of haloes are largely independent of the choice of gravitational softening. For subhaloes there is a slight trend for the Peebles spin parameter to increase as the softening is increased but this effect is only barely resolved. Such a trend would be expected as a larger softening will produce a shallower core potential, lowering slightly the central kinetic energy and altering the energetics and angular momentum profile, thus affecting the spin parameter. For the Peebles measure (Equation 1), the change in energy is outweighed by the change in angular momentum but the two effects counteract each other. For the Bullock spin parameter (Equation 4), only angular momentum has an affect on the spins. So we find that the Bullock spin of subhaloes is more sensitive to the softening, as shown in Table 2.
Table 2 also shows that, contrary to Onions et al. (2013), the three halo finding methods do not recover consistent spin parameters. While they all agree on the halo spins, ahf recovers significantly larger spins on average for the subhalo population than either subfind or hbt which are consistent with each other. The subhalo spins for ahf are broadly consistent with the field population, particularly for larger values of the gravitational softening. This is also discrepant with Onions et al. (2013) who found lower spin parameter values for their subhaloes. This result is due to the failure of ahf to resolve a significant fraction of subhaloes within the simulations. The subhalo numbers given in Table 1 indicate that around of the subhaloes containing 300 or more particles in BoxA are missed by ahf. Difficulties for ahf in resolving substructures where the density contrast between the subhalo and the main halo is expected to be small have also been reported elsewhere (Avila et al., 2014). Further evidence for this issue is the rising incidence of missing substructures as the box size is increased evidenced in Table 1: for the largest box (BoxD), ahf misses of the subhaloes found by subfind. ahf is missing small subhaloes in the outskirts of the host halo and (as we shall demonstrate later) these small subhaloes are precisely the ones with the lowest spin parameters.
This naturally produces a population of subhaloes with higher average spin parameter for ahf. As hbt and subfind produce consistent results and ahf fails to recover the complete subhalo population we choose to concentrate our analysis on subfind for the remainder of this paper.
| Peebles Spin | haloes | subhaloes | ||
|---|---|---|---|---|
| BoxA() | ||||
| BoxA() | ||||
| BoxA_S2() | ||||
| BoxLo() | ||||
| Bullock Spin | haloes | subhaloes | ||
| BoxA() | ||||
| BoxA() | ||||
| BoxA_S2() | ||||
| BoxLo() | ||||
In Table 3 we test the influence of mass resolution. In the brackets after simulation name, we note the particle number threshold chosen. This is set in order to match (sub)halo masses between BoxA and BoxLo, the lower resolution version of this simulation. This ensures that the halo and subhalo catalogues for BoxLo(), BoxA() and BoxA_S2() have the same mass range. The gravitational softening lengths for both BoxLo and BoxA were set to of mean particle separation. BoxLo and BoxA_S2 have the same absolute softening length (). The results show that mass resolution has almost no effect on spin distribution. The first three rows of each sub-table also give a hint about the influence of softening: as suggested above softening mainly affects the spin of small subhaloes. This is not surprising for the reasons already indicated.
4.2. Haloes vs. Subhaloes
So far we have seen that the lower spin parameter distribution observed for subhaloes appears to be a robust result that does not depend upon the choice of halo finder, gravitational softening or mass resolution. Here we explore a possible physical origin for the lower subhalo spins.
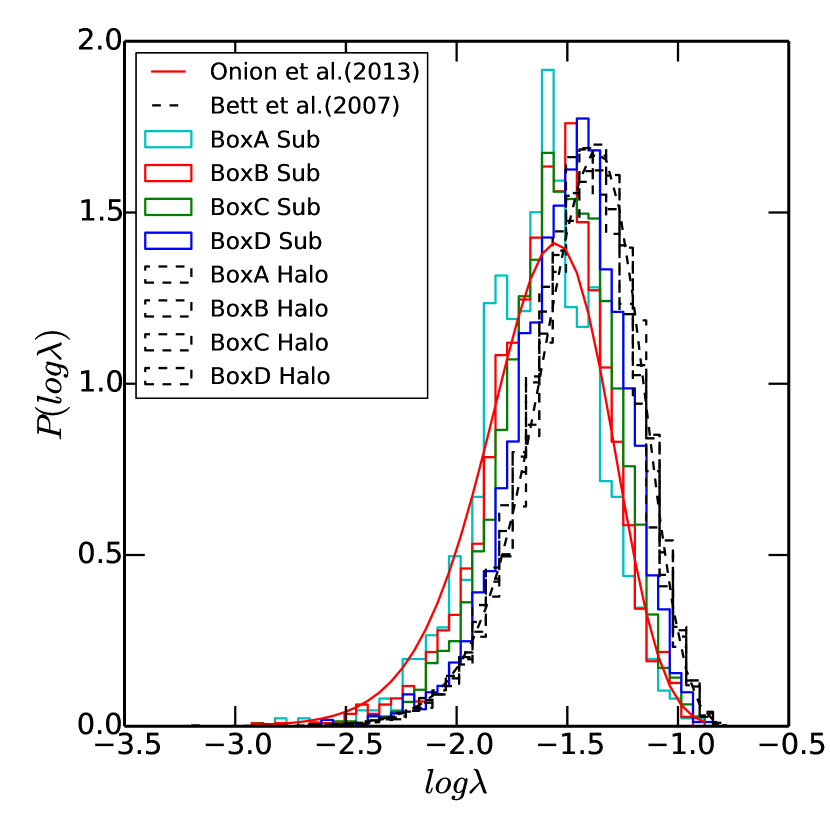
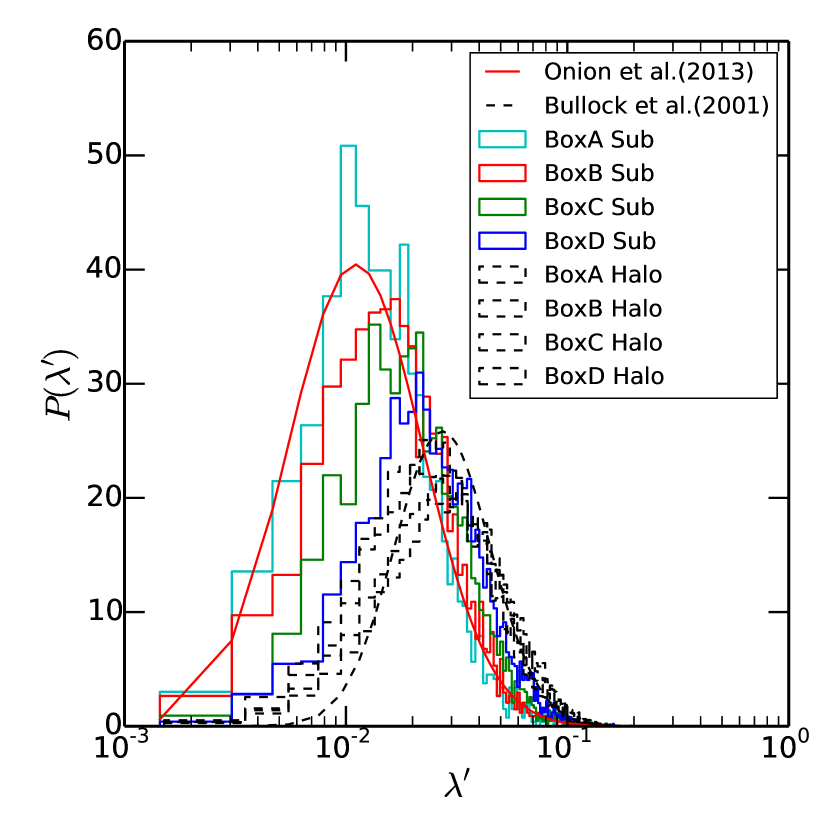
The left and right panel of Figure 1 show the Peebles spin and Bullock spin distributions of subhaloes as well as haloes in all the simulation boxes and the respective fitting functions from Bett et al. (2007), Bullock et al. (2001) and Onions et al. (2013). To assure robustness, only structures resolved with at least 300 particles are included. For haloes we remove particles contained within substructures when we calculate the spin. We make fits to the histograms in Figure 1 using Equation 2 and Equation 5. The respective fitting parameters are given in Table 4.
| Peebles Spin | haloes | subhaloes | ||
|---|---|---|---|---|
| Bett et al. (2007) | * | - | - | |
| Onions et al. (2013) | - | - | 0.028 | 3.64 |
| BoxA | ||||
| BoxB | ||||
| BoxC | ||||
| BoxD | ||||
| Bullock Spin | haloes | subhaloes | ||
| Bullock et al. (2001) | ** | - | - | |
| Onions et al. (2013) | - | - | 0.018*** | 0.70 |
| BoxA | ||||
| BoxB | ||||
| BoxC | ||||
| BoxD | ||||
-
*
In Bett et al. (2007), the parameters have much smaller uncertainty because there are much lager populations of halos in the work (17709121 raw FOF halos including 1332239 ”clean” ones).
-
**
In Bullock et al. (2001), the parameters have larger uncertainty because they use less haloes for fitting (only 500 haloes).
-
***
Note that these parameters differ from the ones originally stated in Onions et al. (2013). The original values were derived using an incorrect fitting routine. The values stated here are the correct values fitted to the Aquarius L4 data set.
Figure 1, Table 2, Table 3 and Table 4 all show that the subhalo spin distribution is different from the halo spin distribution. This further confirms earlier results by Onions et al. (2013) who found that the spin distribution of subhaloes in the Level 4 resolution Aquarius simulation (Springel et al., 2008) is significantly different to the one derived by Bett et al. (2007) for haloes in the Millennium Simulation.
Our results reveal new information about the spin of subhaloes. As the box size grows from BoxA to BoxD, the discrepancy between of haloes and subhaloes decreases gradually, i.e. the scale of the effect is mass dependent with larger subhaloes tending to have higher spin. One possibility is that in small simulations such as BoxA or isolated halo models such as Aquarius-A to E studied by Onions et al. (2013), large substructures are generally absent. In the next section we will demonstrate that subhalo spins increase with subhalo mass while halo spins do not have a significant mass dependence.
As an aside, it should be noted that while our fits do not match those given by Bullock et al. (2001), Bett et al. (2007) and Onions et al. (2013) exactly they are within the range of results covered by these works. In practice, previous work does not arrive at an agreement on the exact value of haloes’ spin. Most of these studies fix in the range , with between (see section 4.1 and Fig.7 in Shaw et al., 2006). In Bett et al. (2007), they found median values of for the entire population of haloes, depending on the definition of halo, and for the catalogue of haloes they refined. Different sets of simulations and halo selection criteria may result in this variation of the recovered spin parameter. As Subsection 4.1 demonstrated, such factors as mass resolution and gravitational softening influence the spin. On the other hand, the discrepancy between the spin of haloes and subhaloes within our simulations is much larger than the bias among simulations. It should therefore be regarded as an intrinsic physical property rather than a result of different data sets.
4.3. Mass Dependence
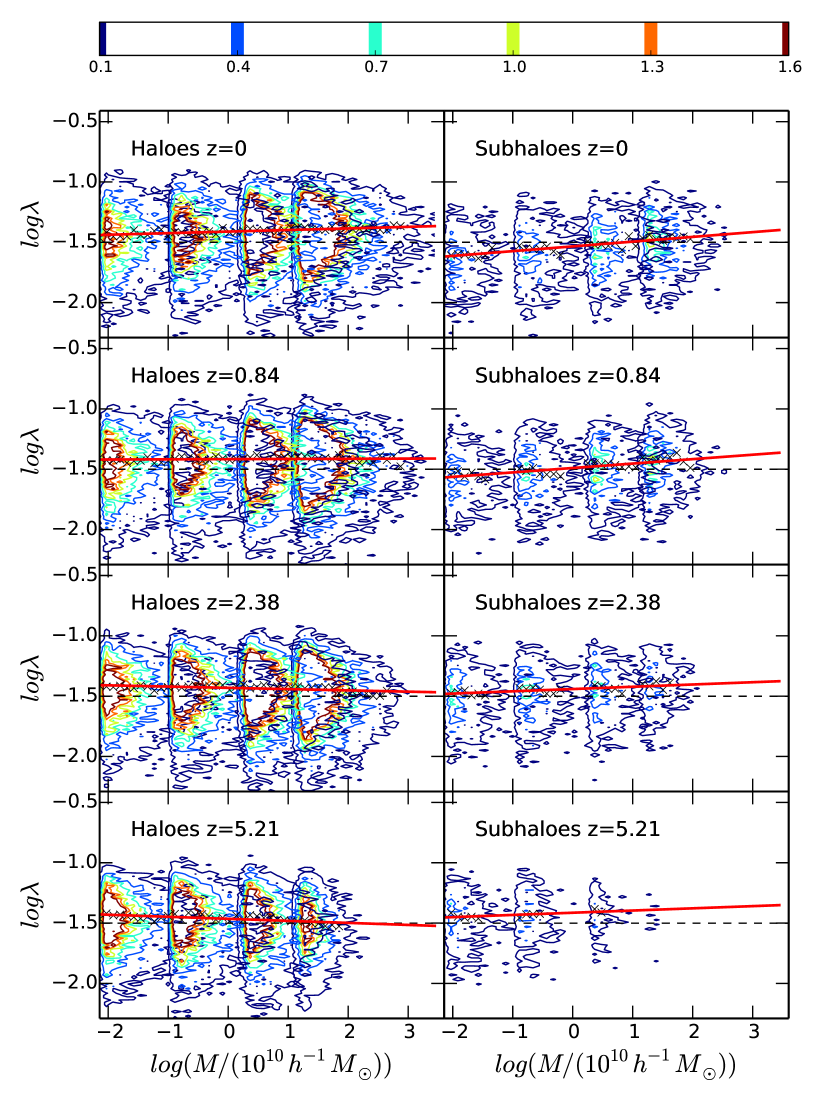
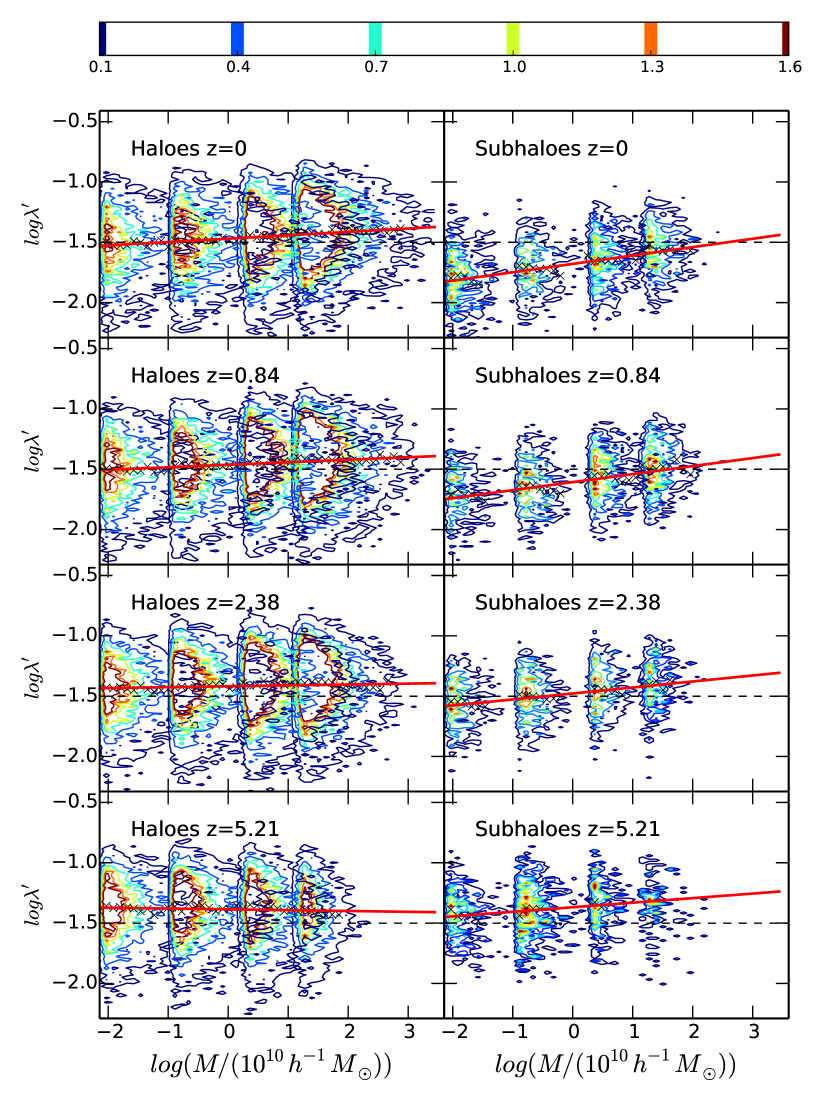
As we suggest above, mass dependence can explain the discrepancy between the spins of haloes and subhaloes. To validate this, we further explore the mass dependence of (sub-)halo spin. Figure 2 and Figure 3 show the two dimensional histogram of spin against (sub-)halo mass. They present a straightforward picture of how the spin distribution changes with mass. We use four simulations to expand the mass range. Contours for each simulation at the same redshift are normalized and stacked together into one subplot. We then divide the sample into 40 bins by (sub-)halo mass, fit the distribution by Equation 2 and Equation 5 (if the sample volume in that bin is large enough). () in each mass bin is calculated and marked on the plots with a cross, and a linear fit to () against mass is indicated by the red solid line. From the subplots corresponding to redshift 0 (top left and top right), we can see that, for subhaloes, () clearly increases with increasing subhalo mass. In contrast, the spin distribution of haloes is almost independent of mass. The increasing subhalo spin with mass is even more pronounced relationship for the Bullock spin parameter shown in Figure 3 because for the Bullock spin the (sub)halo mass has a higher weight (c.f. Equation 1,Equation 4). This results in a larger discrepancy between haloes and subhaloes at the low mass end. In Onions et al. (2013), their samples are from a Milky Way like re-simulation, which contains subhaloes similar to those found in BoxA. So the subhalo spin distribution in their work is closer to that from BoxA. Onions et al. (2013) suggest that the physical mechanism that drives this difference is mass stripping. Subhalo particles with high angular momentum are stripped preferentially which leads to a decrease in the spin parameter. Subhaloes with low mass are usually the ones stripped most severely. Our results strongly support the claims Onions et al. (2013) made.
The slightly positive slope of and is inconsistent with some previous work. They found that is constant or has a slightly negative slope ((Bett et al., 2007; Macciò et al., 2007, c.f.)). However we should not forget this trend includes the effect of systematic bias between simulations. Figure 10 in Macciò et al. (2008) shows that has a slope of 0.005 in a simulation using WMAP1, which is the same cosmology as that used here.
4.4. Radial Dependence
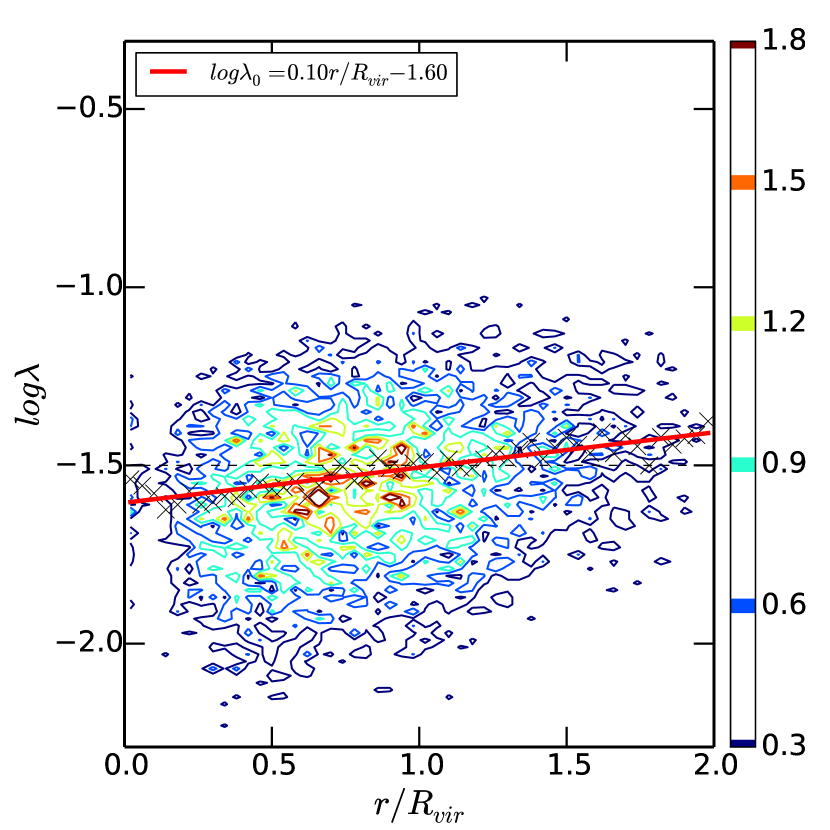
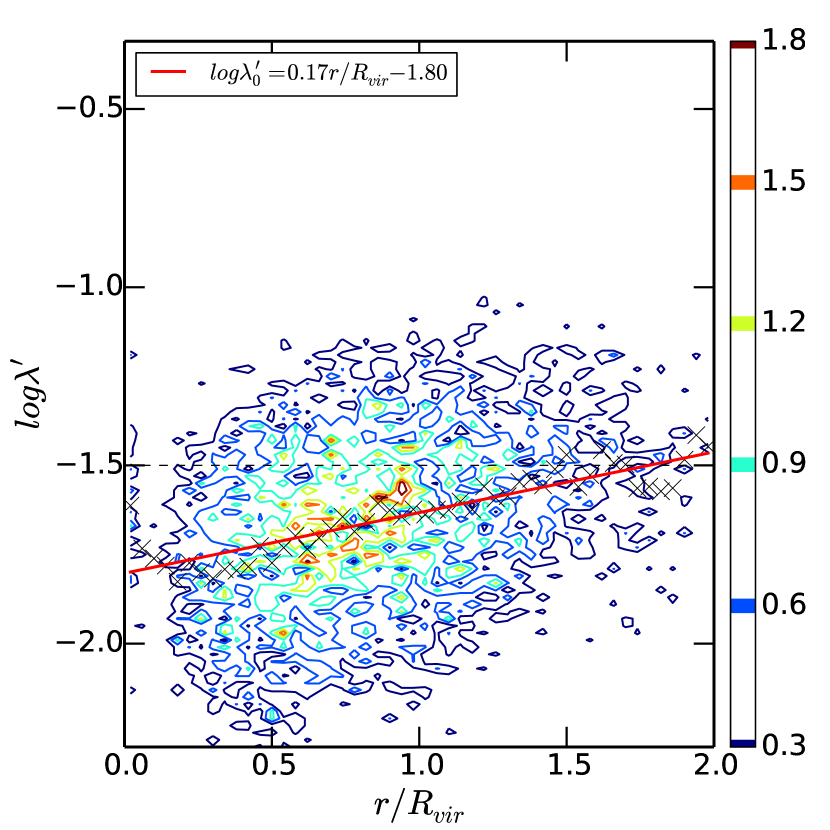
To understand further whether tidal stripping of high angular momentum material could cause the lower subhalo spin distribution, we investigate the radial dependence of the subhalo spins. Subhaloes located closer to the center of their host halo are likely to have undergone stronger tidal stripping than those nearer the virial radius. Onions et al. (2013) has done some tests to support their argument, e.g. they analyze the average spin parameter of subhaloes at different distances from the center of the host halo. Here we perform a more detailed test. We stack subhalo samples from four simulations together and then make the two dimensional histogram of spin against their centric distance. Then in each radial bin we fit the subhalo sample using Equation 2 and Equation 5. Finally we make a linear fit as or . The results are displayed in Figure 4 and show that the spin of subhaloes is suppressed close to the center of the host halo. This is consistent with the argument that subhaloes loose their high angular momentum particles as they are stripped of their outer layers after infall into a main halo.
4.5. Redshift Dependence
So far all our analysis was conducted on the snapshot. However, the spin distribution is known to change with redshift (Hetznecker & Burkert, 2006). Hence, we investigated the redshift dependence of the halo vs. subhalo spin distribution offset. In Figure 2 and Figure 3,we give the Peebles and Bullock spin distributions of (sub-)haloes at , , and , respectively. The spin of subhaloes at the lower mass end decreases significantly with time, while the spin of massive haloes increases slightly with time. We calculate the () in each mass bin and then use a linear function ( for Bullock spin) to fit () against mass. We list the parameters of each fitting line in Table 5. It is clear the difference between the halo and subhalo spin distribution increases with time. This is consistent with the argument that tidal stripping causes the difference. Affected by stripping, subhaloes loose more and more high angular momentum particles as time passes.
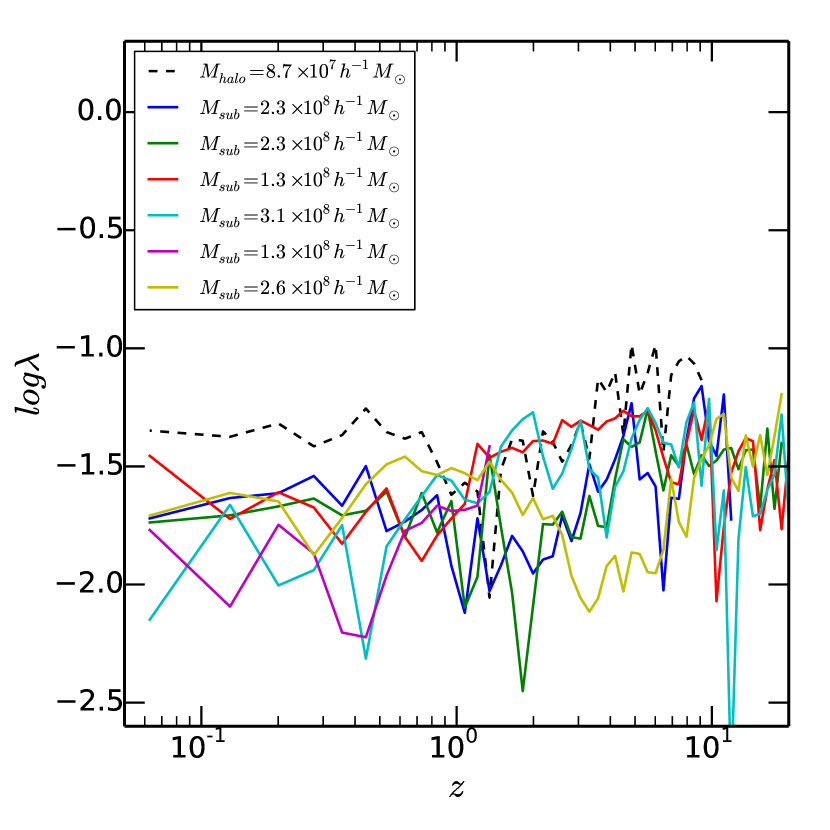
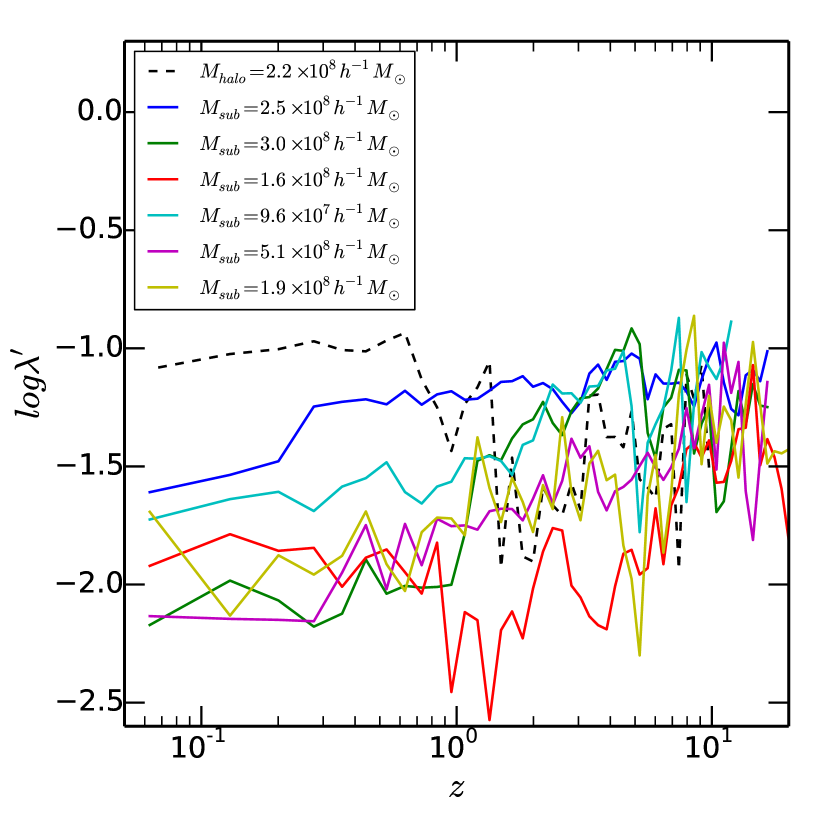
To confirm this result we checked how the spin of a single halo changes with time. We randomly select 6 subhaloes and plot their spin against redshift. We constrain the samples selected so that they are likely to be the subhaloes heavily stripped. As expected, heavily stripped subhaloes should have low mass (here we choose masses less than ) and have long histories, forming prior to redshift 8. As shown in Figure 5, the spin of subhaloes declines at low redshift. We have checked many more subhaloes not displayed in Figure 5 and we find that most of them display the same trend. We also plot a dashed line for a halo as reference. The halo is in the same mass range as those subhaloes selected. Its spin almost does not change at low redshift. This piece of evidence strongly supports the claim that subhaloes suffer from stripping, loosing their spin over time.
The information at the high redshift end in Figure 5 is not reliable since the progenitors don’t contain very many particles. This results in the large fluctuations seen here.
| Halo | Subhalo | ||||
|---|---|---|---|---|---|
| Peebles spin | 0.013 | -1.41 | 0.039 | -1.53 | |
| 0.0015 | -1.42 | 0.037 | -1.49 | ||
| -0.010 | -1.43 | 0.018 | -1.44 | ||
| -0.017 | -1.46 | 0.018 | -1.41 | ||
| Halo | Subhalo | ||||
| Bullock spin | 0.028 | -1.47 | 0.069 | -1.68 | |
| 0.021 | -1.46 | 0.066 | -1.61 | ||
| 0.0073 | -1.42 | 0.047 | -1.47 | ||
| -0.0068 | -1.39 | 0.037 | -1.37 | ||
5. Discussion & Conclusions
In this work we compared the spin distribution function of haloes and subhaloes in sets of cosmological box simulations. We found that the halo spin distribution function is well fitted by the parametrisations given by Bullock et al. (2001) and Bett et al. (2007) for the Bullock and Peebles (Peebles, 1969) spin parameter, respectively. For the subhalo spin distribution function, however, the typical spin of a small subhalo is significantly lower. This was previously suggested by Onions et al. (2013) for the subhaloes within Milky Way-like haloes, but is confirmed here for a full cosmological volume.
We investigated the origin of the difference between the halo and subhalo spin distributions. We examined the influence of (sub-)halo finder, spin parametrisation and resolution to confirm that these factors are not the origin of the difference between the halo and subhalo spin distributions. In this process we confirmed the difficulties that the ahf finder has in recovering substructures reliably where the density contrast between the main halo and the subhalo is low. We recommend that the ahf halo finder should be treated with caution in situations where a complete unbiased sample of the subhalo population is required.
In this paper, we have argued that the difference between the spin distributions is physical and it is caused by tidal stripping of subhaloes removing high angular momentum material. This argument is strongly supported by three pieces of evidence presented here. Firstly, subhaloes tend to have lower spin when compared to haloes of the same mass. This discrepancy gets larger towards the low mass end. Secondly, the spin distribution of subhaloes is radially dependent within a host halo. Subhaloes closer to the host halo center, which are expected to have been more tidally stripped, have lower spin than those closer to the virial radius. Thirdly the difference between halo and subhalo spin increases with time and hence is being caused by a dynamical effect, such as tidal stripping.
In summary, we have demonstrated that subhaloes typically have lower spin than haloes because tidal stripping removes their highest angular momentum material. This can have an important consequence for galaxy properties that require spin parameter information. Galaxy properties that are related to spin are more likely to be correlated to the spin of the subhalo before infall and not necessarily to its present value.
Acknowledgements
This work was supported by the NSFC projects (Grant Nos. 11473053, 11121062, 11233005, U1331201), the National Key Basic Research Program of China (Grant No. 2015CB857001), and the “Strategic Priority Research Program the Emergence of Cosmological Structures” of the Chinese Academy of Sciences (Grant No. XDB09010000). YW was supported by the EC framework 7 research exchange programme LACEGAL. HL acknowledges a fellowship from the European Commissions Framework Programme 7, through the Marie Curie Initial Training Network CosmoComp (PITN-GA-2009-238356). SIM acknowledges the support of the STFC Studentship Enhancement Programme (STEP) and the support of a STFC consolidated grant (ST/K001000/1) to the astrophysics group at the University of Leicester. Part of the simulations in this paper were performed on the High Performance Computing (HPC) facilities at the University of Nottingham (www.nottingham.ac.uk/hpc). This work also made use of the High Performance Computing Resource in the Core Facility for Advanced Research Computing at Shanghai Astronomical Observatory.
The authors contributed to this paper in the following way: YW led the project and is a PhD student of WPL, currently undertaking an extended exchange with FRP. YW conducted the simulation and analysis with assistance from SIM and JO. The manuscript was prepared by YW, HL and SIM, with comments and contributions from all authors.
YW also acknowledge Jiaxin Han, Zhaozhou Li for their supports on hbt.
References
- Abadi et al. (2003) Abadi, M. G., Navarro, J. F., Steinmetz, M., & Eke, V. R. 2003, The Astrophysical Journal, 591, 499
- Antonuccio-Delogu et al. (2010) Antonuccio-Delogu, V., Dobrotka, A., Becciani, U., et al. 2010, MNRAS, 407, 1338
- Avila et al. (2014) Avila, S., Knebe, A., Pearce, F. R., et al. 2014, MNRAS, 441, 3488
- Barnes & Efstathiou (1987) Barnes, J., & Efstathiou, G. 1987, ApJ, 319, 575
- Benson (2012) Benson, A. J. 2012, New Astronomy, 17, 175
- Benson et al. (2001) Benson, A. J., Pearce, F. R., Frenk, C. S., Baugh, C. M., & Jenkins, A. 2001, MNRAS, 320, 261
- Bertone et al. (2007) Bertone, S., De Lucia, G., & Thomas, P. A. 2007, MNRAS, 379, 1143
- Bett et al. (2007) Bett, P., Eke, V., Frenk, C. S., et al. 2007, MNRAS, 376, 215
- Bett et al. (2010) Bett, P., Eke, V., Frenk, C. S., Jenkins, A., & Okamoto, T. 2010, MNRAS, 404, 1137
- Bower et al. (2006) Bower, R. G., Benson, A. J., Malbon, R., et al. 2006, MNRAS, 370, 645
- Boylan-Kolchin et al. (2009) Boylan-Kolchin, M., Springel, V., White, S. D. M., Jenkins, A., & Lemson, G. 2009, MNRAS, 398, 1150
- Bryan et al. (2013) Bryan, S. E., Kay, S. T., Duffy, A. R., et al. 2013, MNRAS, 429, 3316
- Bullock et al. (2001) Bullock, J. S., Dekel, A., Kolatt, T. S., et al. 2001, ApJ, 555, 240
- Cole et al. (2000) Cole, S., Lacey, C. G., Baugh, C. M., & Frenk, C. S. 2000, MNRAS, 319, 168
- Colín et al. (2004) Colín, P., Klypin, A., Valenzuela, O., & Gottlöber, S. 2004, ApJ, 612, 50
- Croton et al. (2006) Croton, D. J., Springel, V., White, S. D. M., et al. 2006, MNRAS, 365, 11
- Dalcanton et al. (1997) Dalcanton, J. J., Spergel, D. N., & Summers, F. J. 1997, ApJ, 482, 659
- De Lucia & Blaizot (2007) De Lucia, G., & Blaizot, J. 2007, MNRAS, 375, 2
- Fall & Efstathiou (1980) Fall, S., & Efstathiou, G. 1980, MNRAS, 193, 189
- Font et al. (2008) Font, A. S., Bower, R. G., McCarthy, I. G., et al. 2008, MNRAS, 389, 1619
- Frenk & White (2012) Frenk, C., & White, S. 2012, Annalen der Physik, 524, 507
- Frenk et al. (1997) Frenk, C. S., Baugh, C. M., Cole, S., & Lacey, S. 1997, in Astronomical Society of the Pacific Conference Series, Vol. 117, Dark and Visible Matter in Galaxies and Cosmological Implications, ed. M. Persic & P. Salucci, 335
- Gill et al. (2004) Gill, S. P., Knebe, A., & Gibson, B. K. 2004, MNRAS, 351, 399
- Gottlöber & Yepes (2007) Gottlöber, S., & Yepes, G. 2007, ApJ, 664, 117
- Guo et al. (2011) Guo, Q., White, S., Boylan-Kolchin, M., et al. 2011, MNRAS, 413, 101
- Han et al. (2012) Han, J., Jing, Y. P., Wang, H., & Wang, W. 2012, MNRAS, 427, 2437
- Hetznecker & Burkert (2006) Hetznecker, H., & Burkert, A. 2006, MNRAS, 370, 1905
- Kauffmann et al. (1997) Kauffmann, G., Nusser, A., & Steinmetz, M. 1997, MNRAS, 286, 795
- Kauffmann et al. (1993) Kauffmann, G., White, S. D. M., & Guiderdoni, B. 1993, MNRAS, 264, 201
- Knebe & Power (2008) Knebe, A., & Power, C. 2008, ApJ, 678, 621
- Knebe et al. (2013) Knebe, A., Pearce, F. R., Lux, H., et al. 2013, MNRAS, 435, 1618
- Knollmann & Knebe (2009) Knollmann, S. R., & Knebe, A. 2009, ApJS, 182, 608
- Lacerna & Padilla (2012) Lacerna, I., & Padilla, N. 2012, MNRAS, 426, L26
- Lee & Lemson (2013) Lee, J., & Lemson, G. 2013, J. Cosm. & Astropart. Phys., 5, 22
- Macciò et al. (2008) Macciò, A. V., Dutton, A. A., & Van Den Bosch, F. C. 2008, MNRAS, 391, 1940
- Macciò et al. (2007) Macciò, A. V., Dutton, A. A., Van Den Bosch, F. C., et al. 2007, MNRAS, 378, 55
- Mestel (1963) Mestel, L. 1963, MNRAS, 126, 553
- Mo et al. (1998) Mo, H. J., Mao, S., & White, S. D. M. 1998, MNRAS, 295, 319
- Navarro & Steinmetz (2000) Navarro, J. F., & Steinmetz, M. 2000, ApJ, 538, 477
- Onions et al. (2013) Onions, J., Ascasibar, Y., Behroozi, P., et al. 2013, MNRAS, 429, 2739
- Peebles (1969) Peebles, P. 1969, ApJ, 155, 393
- Shaw et al. (2006) Shaw, L. D., Weller, J., Ostriker, J. P., & Bode, P. 2006, The Astrophysical Journal, 646, 815
- Springel (2005) Springel, V. 2005, MNRAS, 364, 1105
- Springel et al. (2001) Springel, V., White, S. D. M., Tormen, G., & Kauffmann, G. 2001, MNRAS, 328, 726
- Springel et al. (2005) Springel, V., White, S. D. M., Jenkins, A., et al. 2005, Nat, 435, 629
- Springel et al. (2008) Springel, V., Wang, J., Vogelsberger, M., et al. 2008, MNRAS, 391, 1685
- Stadel et al. (2009) Stadel, J., Potter, D., Moore, B., et al. 2009, MNRAS, 398, L21
- Trowland et al. (2013) Trowland, H. E., Lewis, G. F., & Bland-Hawthorn, J. 2013, ApJ, 762, 72
- Wang et al. (2011) Wang, H., Mo, H. J., Jing, Y. P., Yang, X., & Wang, Y. 2011, MNRAS, 413, 1973
circulate