Further author information: (Send correspondence to J.M.M.H.)
J.M.M.H.: E-mail: jonathan.hall@adelaide.edu.au
Predicting the whispering gallery mode spectra of microresonators
Abstract
The whispering gallery modes (WGMs) of optical resonators have prompted intensive research efforts due to their usefulness in the field of biological sensing, and their employment in nonlinear optics. While much information is available in the literature on numerical modeling of WGMs in microspheres, it remains a challenging task to be able to predict the emitted spectra of spherical microresonators. Here, we establish a customizable Finite-Difference Time-Domain (FDTD)-based approach to investigate the electromagnetic WGM spectrum of microspheres. The simulations are carried out in the vicinity of a dipole source rather than a typical plane-wave beam excitation, thus providing an effective analogue of the fluorescent dye or nanoparticle coatings used in experiment. The analysis of a single dipole source at different positions on the surface or inside a microsphere, serves to assess the relative efficiency of nearby radiating TE and TM modes, characterizing the profile of the spectrum. By varying the number, positions and alignments of the dipole sources, different excitation scenarios can be compared to analytic models, and to experimental results. The energy flux is collected via a nearby disk-shaped region. The resultant spectral profile shows a dependence on the configuration of the dipole sources. The power outcoupling can then be optimized for specific modes and wavelength regions. The development of such a computational tool can aid the preparation of optical sensors prior to fabrication, by preselecting desired the optical properties of the resonator.
keywords:
Whispering gallery modes, Microresonators, Resonators, Optical devices, Microcavities, Computational optics, Optics modeling, Spectroscopy1 INTRODUCTION
Whispering gallery modes (WGMs) are produced by the propagation of electromagnetic waves along the interface of the surface of a resonator and its environment. As a result, an evanescent field is produced, which extends beyond the surface of the resonator. WGMs represent an optical phenomenon which is applicable to sensing applications, due to the sensitivity of the evanescent field to the presence of virions [1], and macromolecules such as proteins [2, 3, 4, 5], which break the symmetry of the field [6]. WGMs have been used for the development of label-free detection technologies [7, 8], optical frequency combs [9], nonlinear optics [10] and quantum electrodynamics (QED) [11]. This work primarily focuses on the establishment of a computational modeling tool for investigating properties of WGM spectra in microspheres and microshells.
Optical microresonators have been the subject of much recent investigation since the discovery of extremely high quality()-factor generation (), which is possible by exciting the WGMs of a resonator, using a prism, or a tapered fiber coupled to the resonator [12, 13, 14, 15, 16]. An alternative approach to this is to excite the WGMs indirectly, using fluorescent media [17], surface plasmon effects [7, 18] or nanoparticle coating/doping using quantum dots [19]. WGMs of the resonator also exhibit high sensitivity to their external environment. This means that not only are WGMs potentially very distinguishable from one another in the power spectrum, but that changes due to the presence of a new electromagnetic source can also be identified easily.
The manufacture of optical resonators suited to a particular purpose using trial-and-error methods is expensive. Efforts to simulate and characterize the optical properties of WGMs in resonators using computational methods have so far focused on specific and ideal scenarios, such as excitation from a plane-wave beam [20, 21, 22]. This opens the way for an investigation into realistic mode excitation scenarios, and analyzing differences in the spectral profiles, with a view to making a robust prediction tool. Here, we investigate coupling strategies that involve the excitation of WGMs of microresonators, using dipole sources placed on the surface. The Finite-Difference Time-Domain (FDTD) computational tool developed in this work will address this coupling scenario in particular. The tool is also easily extended to include fiber-coupled methods of mode excitation.
2 FDTD MODEL
The FDTD technique [23] splits a volume of space into a three-dimensional grid, and calculates the solution of Maxwell’s Equations for the electromagnetic fields at each point. This is repeated for a finite number of time increments, and performed sequentially as the system evolves in time. FDTD constitutes a comprehensive solution of an optical system, with all radiation modes present in the simulation. The only artifacts in the calculation involve discretization and finite-volume effects, and assumptions made regarding ideal material properties and resonator configurations. The FDTD method is also suitable for accessing transient or unexpected electromagnetic properties, as each time step is evaluated individually. However, the method is computationally expensive when achieving a result that is sufficiently converged [24].
The power spectrum represents a useful quantity for representing the positions and the -factors of the excited modes [25]. To obtain this, a flux-collection region may be introduced into the simulation, placed a certain distance from the microresonator. The total output power () in terms of wavelength () is obtained by integrating the projection of the Poynting vector () onto a flux region of area , with a normal unit vector
| (1) |
The profile of the power spectrum, plotted as a function of , will show sharp peaks that correspond to the positions of TE and TM WGMs. Changes in this energy output exactly map out the WGMs, and thus offer an excellent diagnostic tool for the quality of the resonator scenario being examined.
An important aspect in developing the FDTD tool is a comparison with typical analytic models used in the field [26, 27], which can provide estimates on the systematic uncertainty of the WGM positions. To check the mode positions predicted by FDTD, an analytic model is used, in which Maxwell’s Equations are solved in a dielectric medium with a boundary [26]. In this model, the resonance conditions for the TE and TM modes may be expressed in terms of the spherical Bessel functions of the first kind, , and the spherical Hankel function, , for azimuthal mode number . These conditions are
| (2) | ||||
| (3) |
respectively, for a refractive index of inside a sphere of radius , and outside the sphere. The size parameters are defined as , for a wave number , where is the speed of light in a vacuum. Accurate matching of the mode structure of the spectrum allows one to identify the dominant contributions to the features of the spectrum. This identification facilitates future experimental studies in the reduction or enhancement of these features.

3 SIMULATION RESULTS
The FDTD method will be used to consider a variety of flux collection scenarios, source distribution configurations, and resonator properties. The use of dipole sources in the vicinity of a microresonator allows one to investigate the dependence of the optical modes on the size, shape and refractive index contrast associated with the resonator and its environment. Efforts to characterize the optical properties of WGMs in resonators using modeling techniques include both excitation from a plane-wave beam [20, 21, 22], and excitation from an electric dipole source [28, 29, 30, 31, 32, 33, 34, 35, 36]. The dipole sources can also serve as an effective analogue for fluorescent dyes or embedded nanoparticles that excite WGMs in microspheres [17].
3.1 Microspheres
An FDTD simulation of a polystyrene () microsphere, with a diameter of m, is carried out, as illustrated in Figure 1. To generate an electromagnetic current to excite the WGMs, one or several electric dipole sources may be placed in the vicinity of the sphere. Here, an electric dipole source is used, which emits a Gaussian pulse with a central wavelength of nm, and a width of fs. In simulating the orientation of the dipole with respect to the surface of the sphere, both the tangential and radial cases are considered. Note that the pulse width is significantly narrower than the decay transition rate expected from a typical fluorescent source, such as Rhodamine dye, which is approximately 1–3 ns [37, 38]. A circular flux collection region with a diameter of m is placed a distance of nm from the surface of the sphere, with its normal perpendicular to the surface. The power spectrum is then collected for wavelengths in the range - nm. The spectrum is normalized to , the dipole emission rate in an infinite bulk medium of the same refractive index as the surrounding medium.
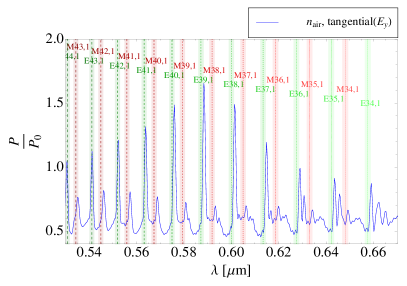
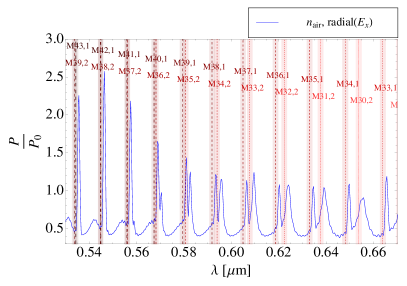
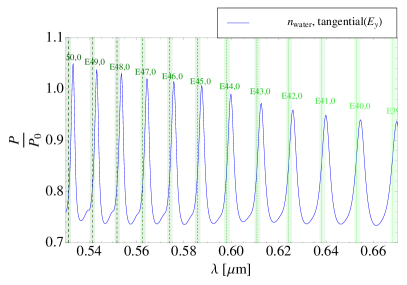
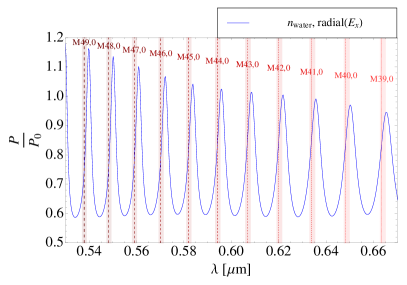
A comparison of the analytic model and the FDTD simulated spectrum for a microsphere is shown in Figure 3, for tangentially and radially oriented dipole sources in both air and water media. The WGM positions from the analytic model are shown as vertical bands, with TEm,n modes in green and TMm,n modes in red, for azimuthal and radial mode numbers and , respectively. The width of each band indicates the estimate of the shift in the WGM positions due to the uncertainty in the sphere diameter, m . In this case, the spatial resolution is held fixed at the value nm. For the temporal resolution, the spectral density yields an uncertainty of nm. The two uncertainties are added in quadrature.
3.2 Microshells
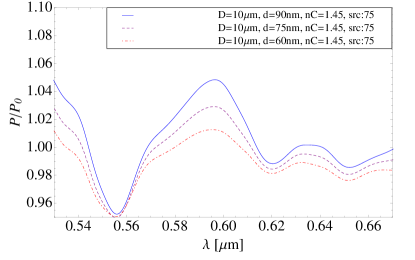
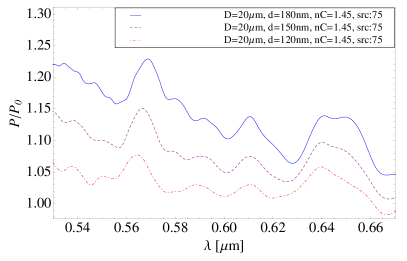
The FDTD method can be modified to consider a microshell resonator, where a hollow sphere is placed in a medium, and excited from a number of dipole sources. The shell may be of variable thickness, and in this investigation, is made from a higher refractive index material than the external medium. The interior of the shell is assigned the same refractive index as the surrounding medium. To approximate the effect of exciting the WGMs using a fluorescent coating, an evenly-spaced distribution of electric dipole sources is simulated on the outer surface of the microshell. The orientation of the dipoles is randomly generated, and the number of dipoles placed on the surface (in this case, ) is made large enough to provide an effective analogue of a medium of fluorescent emitters. Figure 3 shows the variation of the power spectrum due to changes in the shell thickness. In the left panel, an outer shell diameter of m is used, with shell thicknesses of , and nm considered. In the right panel, an outer shell diameter of m is used, considering shell thicknesses of , and nm. For a low refractive index contrast, a small sphere diameter and a small shell thickness, the WGMs are not easily resolvable. However, as the shell thickness increases, an improvement in definition is observed in the spectrum structure. For spectra obtained from a larger shell diameter (shown in the right panel of Figure 3) a peak structure begins to emerge as the shell thickness is increased. Note that the presence of the distribution of dipole sources serves to broaden the WGMs peaks by exciting a range of closely-spaced higher order modes.
4 SUMMARY
A customizable FDTD tool is established, and investigated in the context of whispering gallery mode generation in microresonators. The method can be tailored to more realistic scenarios, where the assumptions built into typical analytic models make direct comparison with experiment difficult. An important novel feature of FDTD is the ability to investigate the choice of source used for mode excitation, as-yet unexplored in the literature. Dipole sources may be placed at a variety of positions and orientations on the surface of the sphere, which can serve as an analogue for nanoparticle coatings.
The generation of whispering gallery modes in novel resonator structures represents an important application of the customizable FDTD approach. The FDTD tool is extended to explore configurations of microshell resonators, represented by a hollow sphere with a water medium placed both inside and outside, where the shell is made from a higher refractive index material. A distribution of randomly-oriented dipole sources is placed on the surface, analogous to a fluorescent dye coating.
The FDTD tool presented here represents the first step in establishing a realistic optical configuration simulator, useful for facilitating a cost-effective approach to designing tailored optical resonators. Tuning the characteristics of the resonator for optimal power coupling and identifying the most prominent spectral features will help to reduce fabrication costs and aid the development of the next generation of biosensing tools.
References
- [1] Vollmer, F. and Arnold, S., “Whispering-gallery-mode biosensing: Label-free detection down to single molecules,” Nat. Methods 5(7), 591–596 (2008).
- [2] Vollmer, F., Braun, D., Libchaber, A., Khoshsima, M., Teraoka, I., and Arnold, S., “Protein detection by optical shift of a resonant microcavity,” Appl. Phys. Lett. 80, 4057–4059 (May 2002).
- [3] Boyd, R. W. and Heebner, J. E., “Sensitive disk resonator photonic biosensor,” Appl. Opt. 40, 5742–5747 (Nov 2001).
- [4] Arnold, S., Khoshsima, M., Teraoka, I., Holler, S., and Vollmer, F., “Shift of whispering-gallery modes in microspheres by protein adsorption,” Opt. Lett. 28, 272–274 (Feb 2003).
- [5] Ksendzov, A. and Lin, Y., “Integrated optics ring-resonator sensors for protein detection,” Opt. Lett. 30, 3344–3346 (Dec 2005).
- [6] Dantham, V. R., Holler, S., Barbre, C., Keng, D., Kolchenko, V., and Arnold, S., “Label-free detection of single protein using a nanoplasmonic-photonic hybrid microcavity,” Nano Lett. 13(7), 3347–3351 (2013).
- [7] Armani, A. M., Kulkarni, R. P., Fraser, S. E., Flagan, R. C., and Vahala, K. J., “Label-free, single-molecule detection with optical microcavities,” Science 317(5839), 783–787 (2007).
- [8] Baaske, M. D., Foreman, M. R., and Vollmer, F., “Single-molecule nucleic acid interactions monitored on a label-free microcavity biosensor platform,” Nat. Nanotechnol. 9, 933–939 (Nov 2014).
- [9] Liang, W., Savchenkov, A. A., Matsko, A. B., Ilchenko, V. S., Seidel, D., and Maleki, L., “Generation of near-infrared frequency combs from a MgF2 whispering gallery mode resonator,” Opt. Lett. 36, 2290–2292 (Jun 2011).
- [10] Schliesser, A. and Kippenberg, T. J., “Chapter 5 - cavity optomechanics with whispering-gallery mode optical micro-resonators,” in [Advances In Atomic, Molecular, and Optical Physics ], Paul Berman, E. A. and Lin, C., eds., Advances In Atomic, Molecular, and Optical Physics 58, 207 – 323, Academic Press (2010).
- [11] McAuslan, D. L., Korystov, D., and Longdell, J. J., “Coherent spectroscopy of rare-earth-metal-ion-doped whispering-gallery-mode resonators,” Phys. Rev. A 83, 063847 (Jun 2011).
- [12] Knight, J. C., Cheung, G., Jacques, F., and Birks, T. A., “Phase-matched excitation of whispering-gallery-mode resonances by a fiber taper,” Opt. Lett. 22, 1129–1131 (Aug 1997).
- [13] Hossein-Zadeh, M. and Vahala, K. J., “Fiber-taper coupling to whispering-gallery modes of fluidic resonators embedded in a liquid medium,” Opt. Express 14, 10800–10810 (Oct 2006).
- [14] Xiao-Wei, D., Shao-Hua, L., Su-Chun, F., Ou, X., and Shui-Sheng, J., “All-fibre micro-ring resonator based on tapered microfibre,” Chin. Phys. B 17(3), 1029 (2008).
- [15] Boleininger, A., Lake, T., Hami, S., and Vallance, C., “Whispering gallery modes in standard optical fibres for fibre profiling measurements and sensing of unlabelled chemical species,” Sensors 10(3), 1765–1781 (2010).
- [16] Monifi, F., Odemir, S., Friedlein, J., and Yang, L., “Encapsulation of a fiber taper coupled microtoroid resonator in a polymer matrix,” IEEE Photonics Technol. Lett. 25, 1458–1461 (Aug 2013).
- [17] François, A., Rowland, K. J., Afshar V., S., Henderson, M. R., and Monro, T. M., “Enhancing the radiation efficiency of dye doped whispering gallery mode microresonators,” Opt. Express 21, 22566–22577 (Sep 2013).
- [18] Min, B., Ostby, E., Sorger, V., Ulin-Avila, E., Yang, L., Zhang, X., and Vahala, K., “High-Q surface-plasmon-polariton whispering-gallery microcavity,” Nature 457(7228), 455–458 (2009).
- [19] Shopova, S. I., Farca, G., Naweed, A., and Rosenberger, A. T., “Whispering-gallery-mode microlaser consisting of a HgTe-quantum-dot-coated microsphere,” Frontiers in Optics Microlasters III, TuT4 (2003).
- [20] Fujii, M., Haraguchi, M., Okamoto, T., and Fukui, M., “Characteristics of whispering gallery modes in single dielectric spheroid excited by gaussian beam,” Jpn. J. Appl. Phys. 44(7R), 4948 (2005).
- [21] Fujii, M., Haraguchi, M., Okamoto, T., and Fukui, M., “Characteristics of whispering gallery modes in single spheroid: Dependence on the direction of incident light,” J. Korean Phys. Soc. 47(38), S38–S42 (2005).
- [22] Quan, H. and Guo, Z., “Simulation of whispering-gallery-mode resonance shifts for optical miniature biosensors,” J. Quant. Spectrosc. Radiat. Transfer 93(1–3), 231–243 (2005).
- [23] Taflove, A., [Computational Electrodynamics: The Finite - Difference Time - Domain Method ], Antennas and Propagation Library, Artech House, Incorporated (1995).
- [24] Hall, J. M. M., Afshar V., S., Henderson, M. R., Francois, A., Reynolds, T., Riesen, N., and Monro, T. M., “Method for predicting whispering gallery mode spectra of spherical microresonators,” Submitted for Publication, Optics Express (Oct. 2014).
- [25] Henderson, M. R., Afshar V., S., Greentree, A. D., and Monro, T. M., “Dipole emitters in fiber: interface effects, collection efficiency and optimization,” Opt. Express 19, 16182–16194 (Aug 2011).
- [26] Johnson, B. R., “Theory of morphology-dependent resonances: shape resonances and width formulas,” J. Opt. Soc. Am. A 10, 343–352 (Feb 1993).
- [27] Teraoka, I. and Arnold, S., “Theory of resonance shifts in TE and TM whispering gallery modes by nonradial perturbations for sensing applications,” J. Opt. Soc. Am. B 23, 1381–1389 (Jul 2006).
- [28] Chew, H., McNulty, P. J., and Kerker, M., “Model for raman and fluorescent scattering by molecules embedded in small particles,” Phys. Rev. A 13, 396–404 (Jan 1976).
- [29] Chance, R., Prock, A., and Silbey, R., “Molecular fluorescence and energy transfer near interfaces,” Adv. Chem. Phys. 37(1), 65 (1978).
- [30] Gersten, J. and Nitzan, A., “Electromagnetic theory of enhanced Raman scattering by molecules adsorbed on rough surfaces,” J. Chem. Phys. 73(7), 3023–3037 (1980).
- [31] Gersten, J. and Nitzan, A., “Spectroscopic properties of molecules interacting with small dielectric particles,” J. Chem. Phys. 75(3), 1139–1152 (1981).
- [32] Chew, H., “Transition rates of atoms near spherical surfaces,” J. Chem. Phys. 87(2), 1355–1360 (1987).
- [33] Chew, H., “Radiation and lifetimes of atoms inside dielectric particles,” Phys. Rev. A 38, 3410–3416 (Oct 1988).
- [34] Ruppin, R., “Decay of an excited molecule near a small metal sphere,” J. Chem. Phys. 76(4), 1681–1684 (1982).
- [35] Schmidt, M. K., Esteban, R., Sáenz, J. J., Suárez-Lacalle, I., Mackowski, S., and Aizpurua, J., “Dielectric antennas - a suitable platform for controlling magnetic dipolar emission,” Opt. Express 20, 13636–13650 (Jun 2012).
- [36] Afshar V, S., Henderson, M. R., Greentree, A. D., Gibson, B. C., and Monro, T. M., “Self-formed cavity quantum electrodynamics in coupled dipole cylindrical-waveguide systems,” Opt. Express 22, 11301–11311 (May 2014).
- [37] Barnes, M. D., Whitten, W. B., Arnold, S., and Ramsey, J. M., “Homogeneous linewidths of rhodamine 6G at room temperature from cavity–enhanced spontaneous emission rates,” J. Chem. Phys. 97(10), 7842–7845 (1992).
- [38] Kolmakov, K., Belov, V. N., Bierwagen, J., Ringemann, C., Muller, V., Eggeling, C., and Hell, S. W., “Red-emitting rhodamine dyes for fluorescence microscopy and nanoscopy,” Chem. Eur. J. 16, 158–166 (Jan 2010).